Every Crypto Front Implied Volatility Crashed Together
Traders read a front-week vol crash as the market pricing danger passed. On 2026-09-17 six coins crashed inside their own bottom 5% while realised ran hot.
Every options desk has watched this morning. The one where the front week suddenly costs less than it did yesterday and every screen agrees. Textbooks call it a volatility crush; desks call it release. The tape does not always calm down on the same clock the price sheet does.
Across 12,821 cycles in the last 90 days, a crush this size on every one of six coins at the same moment has printed 31 times, on three calendar days. The last two are less than two weeks apart: 27 June, 5 September, and today. In the same cycle, five of six term structures also flipped out of BACKWARDATION. Two rare readings at one clock. Traders already fluent in term structure and 24-hour implied changes can jump straight to What actually printed.
The un-inversion, on six coins in one 24 hours
For what backwardation, contango and the flat middle look like on real Bitcoin days, and how often each shape shows up across four years of tape, the primer sits in When Is The Crypto Front Week Actually Cheap?. This note measures one specific transition. Un-inversion is the move from BACKWARDATION back to CONTANGO or FLAT, and Figure 1 shows one on all six coins between yesterday's and today's 11:00 UTC snapshot.
The definition is one subtraction.
where and are the ATM implied volatilities at the 7-day and 60-day tenors at cycle , both in annualised percentage points. Negative spread is BACKWARDATION, near zero is FLAT, positive is CONTANGO. Every coin in the plate below sat with a negative spread at 09-16 11:00 UTC. Twenty-four hours later, five of six no longer did.
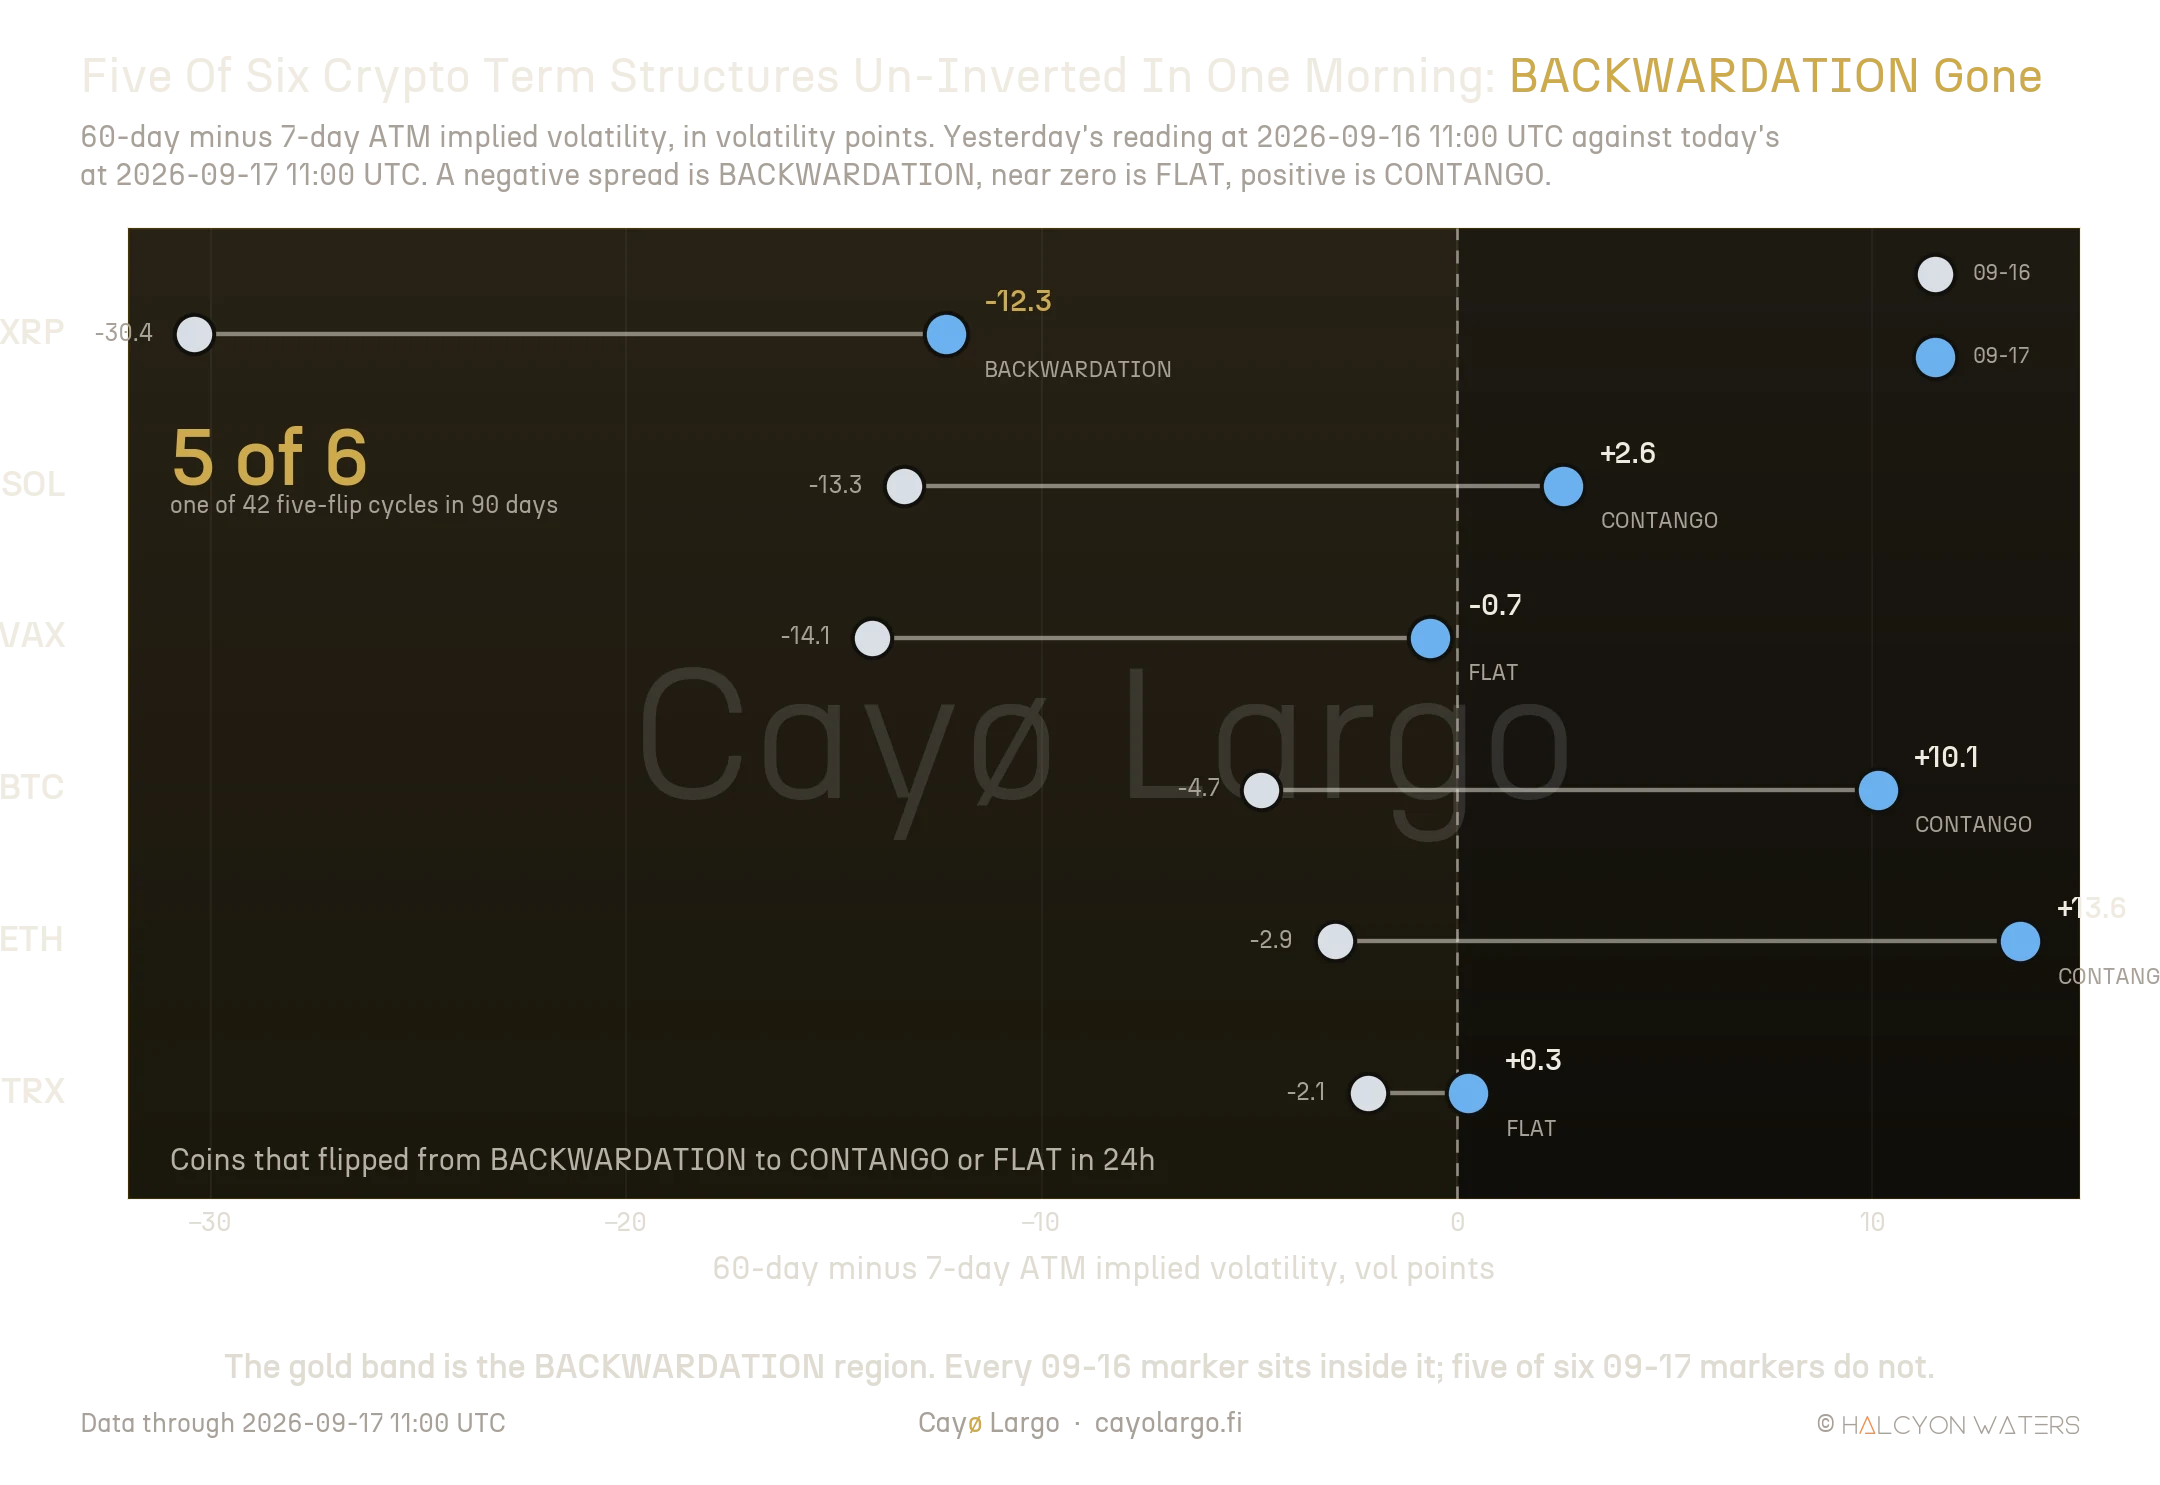
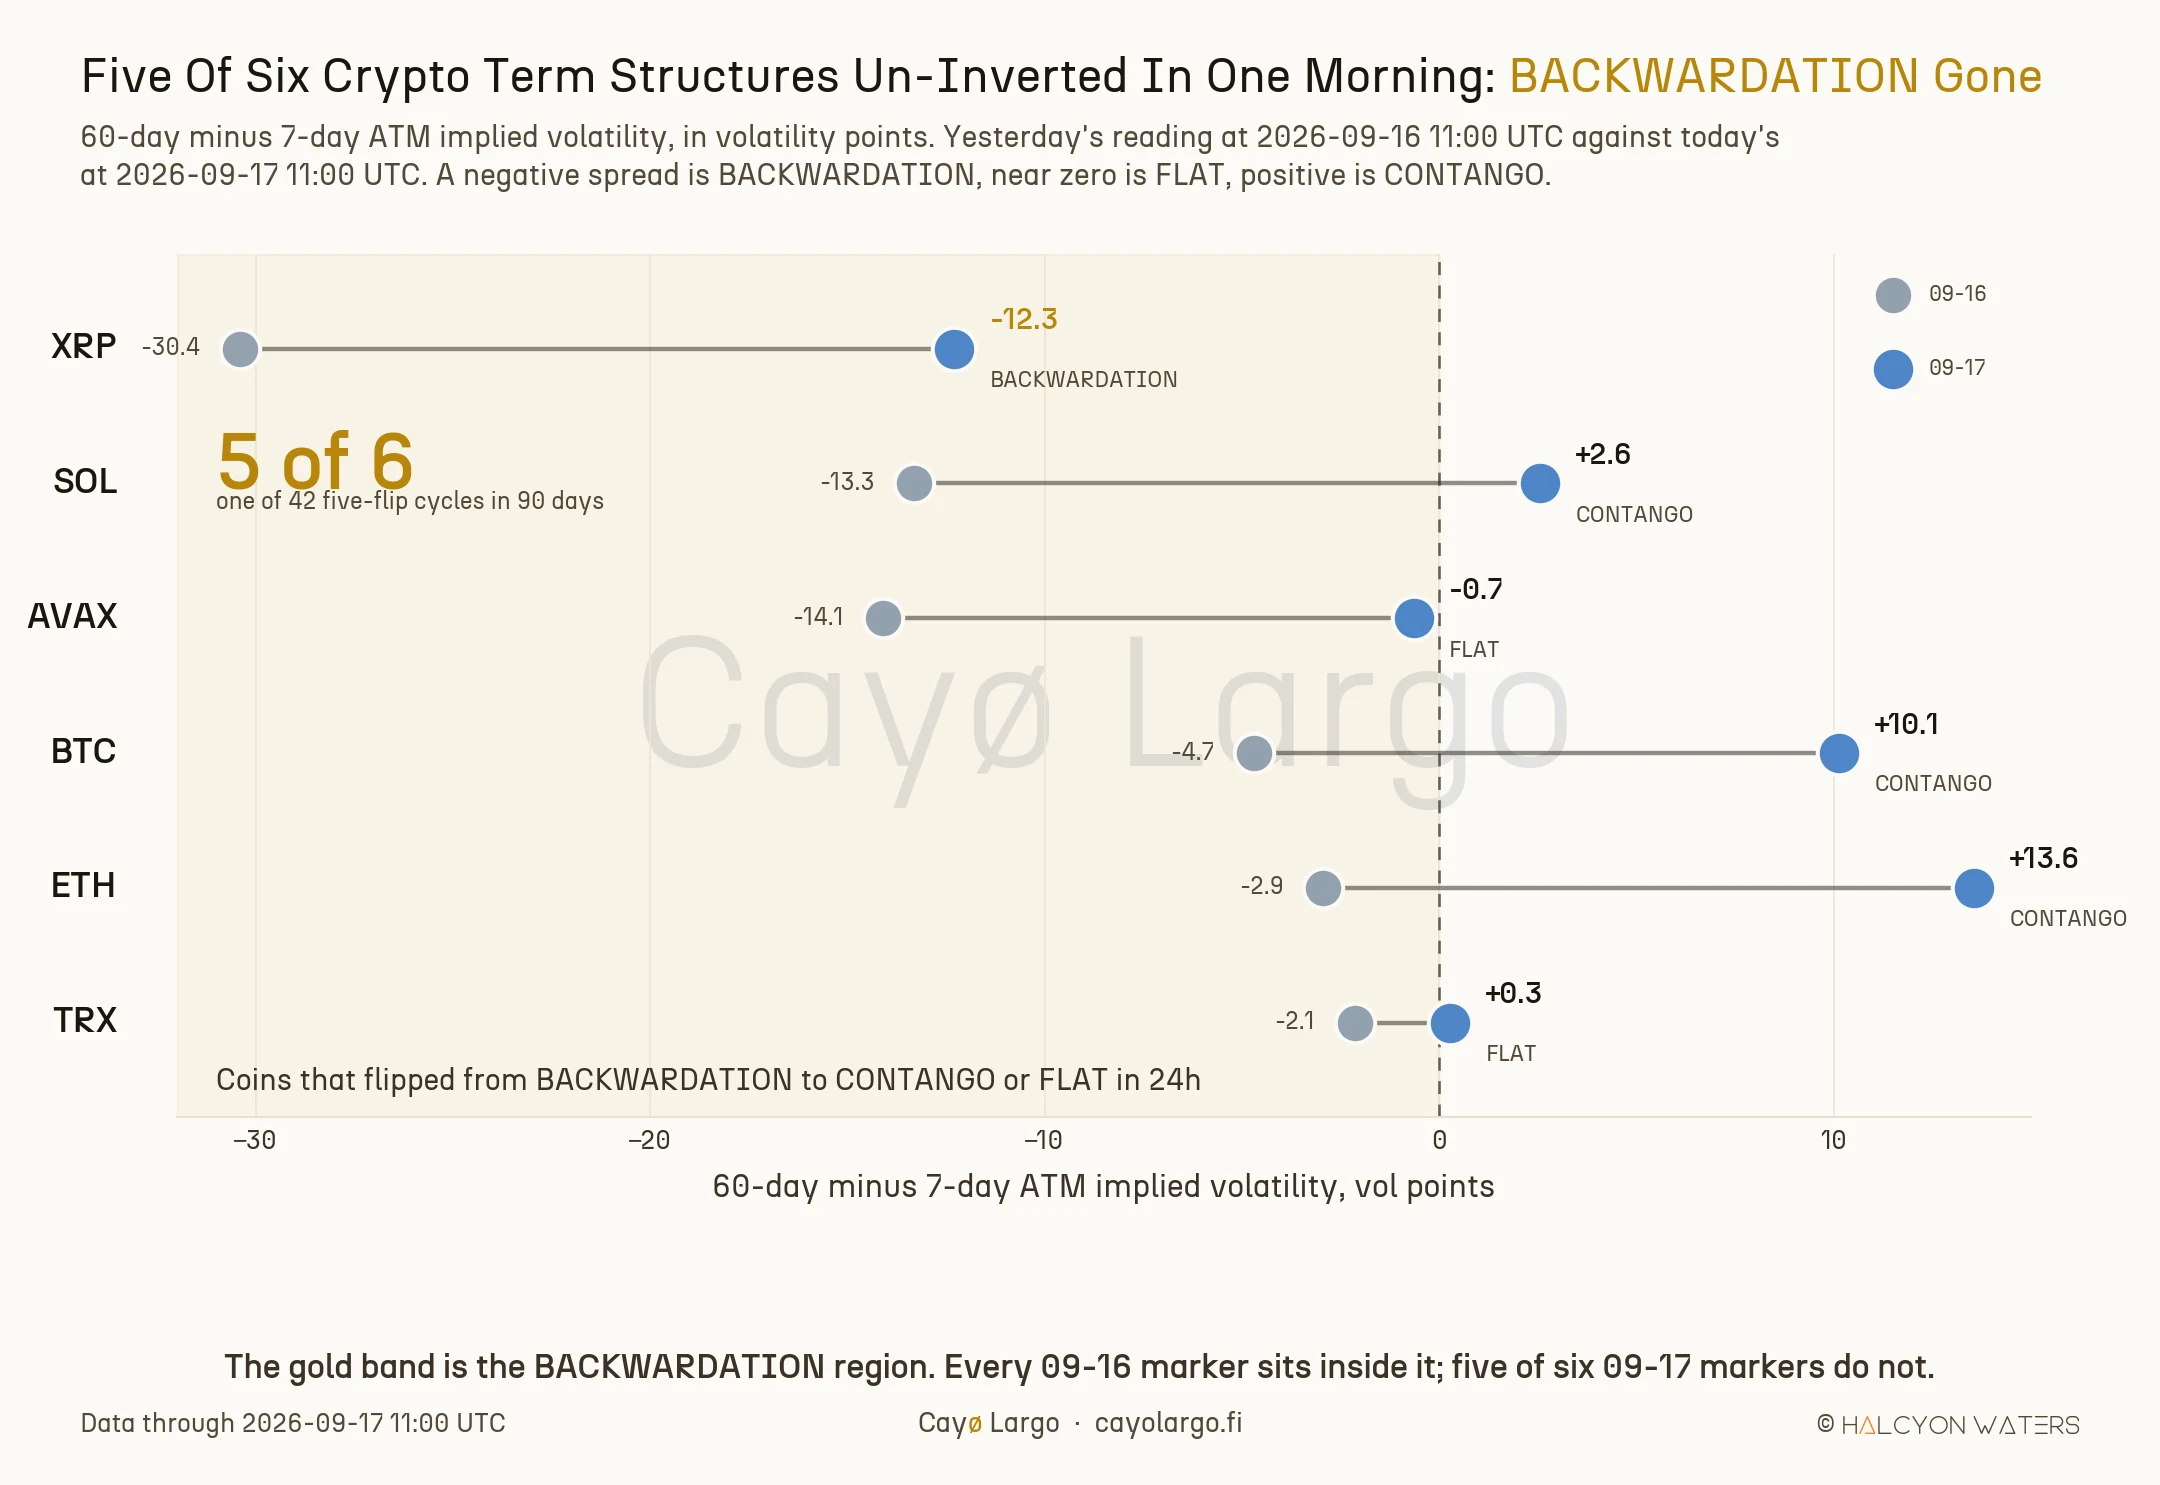
Figure 1: The gold band is the BACKWARDATION region. Yesterday's marker sits inside it for every coin. Today only XRP is still inside, and its spread has halved. BTC, ETH and SOL have moved into CONTANGO, AVAX and TRX into FLAT.
What actually printed
The finding lives inside the same table twice, along two orthogonal axes. First, the level of the shift, measured on each coin against its own 90-day distribution of 24h changes in . Second, the joint fact, which is that the two axes fired at the same cycle rather than in a run.
For each coin and each cycle over the sample window, we take
and its empirical percentile against every other 24h change on the same coin over the last 90 days,
where is the set of cycles for coin in the 90-day sample and counts them. A reading of says the coin has had a change that low or lower in 5% of its own cycles. The threshold is the bottom-five-percent gate the whole note turns on.
Today's readings, ordered by percentile.
| Coin | 24h Δσ7d | Own 90d percentile | 7d IV now | 7d RV now | VRP regime |
|---|---|---|---|---|---|
| XRP | -18.29 | 1.4% | 68.7 | 82.5 | CHEAP |
| AVAX | -13.11 | 1.5% | 59.0 | 69.4 | CHEAP |
| ETH | -16.27 | 2.4% | 40.4 | 59.6 | CHEAP |
| SOL | -14.45 | 2.8% | 53.3 | 62.3 | CHEAP |
| BTC | -16.27 | 3.3% | 27.1 | 40.3 | CHEAP |
| TRX | -2.61 | 4.7% | 20.9 | 17.1 | FAIR |
Every coin cleared the bottom-5% gate in the same 10-minute cycle. The last column is the reading the front-vol crush does not settle. On five of six coins realised 7-day volatility, computed from spot returns rather than from options prices, still sits above the just-crushed implied. The front-week vol premium unwound while the tape it was priced against was still running hot. The lifecycle phase reads EXPANSION on every coin. This is the honest caveat carried inside the finding. Not tacked on at the end.
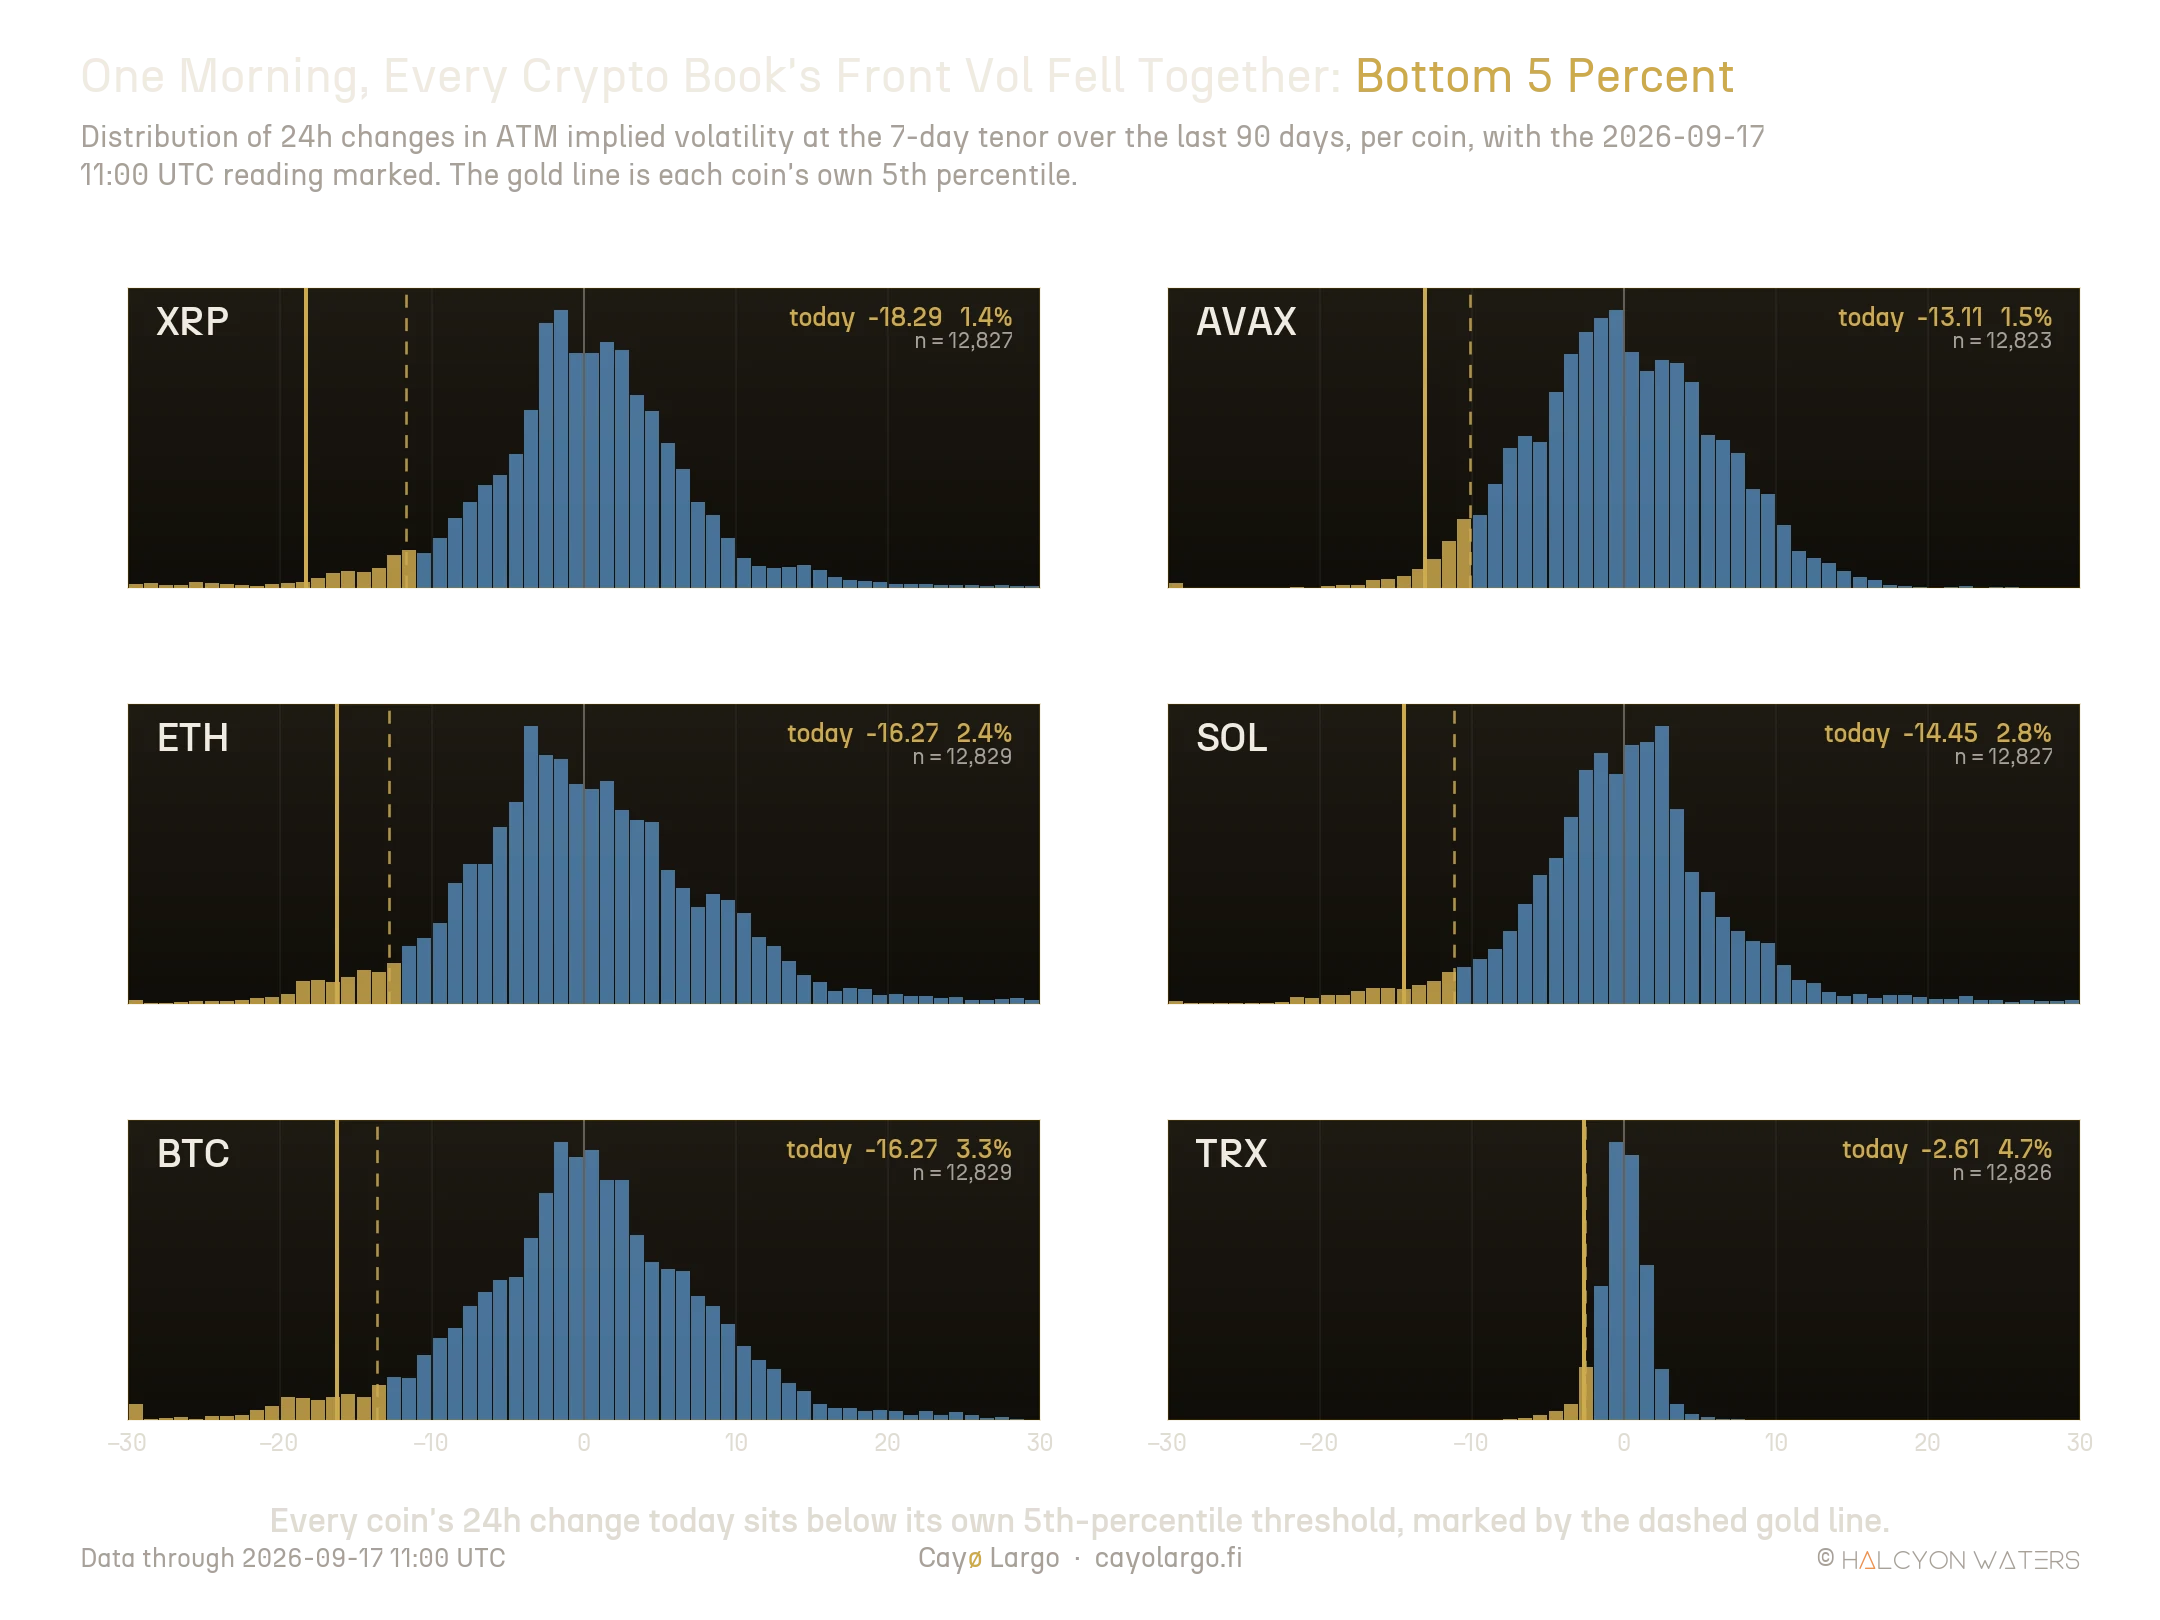
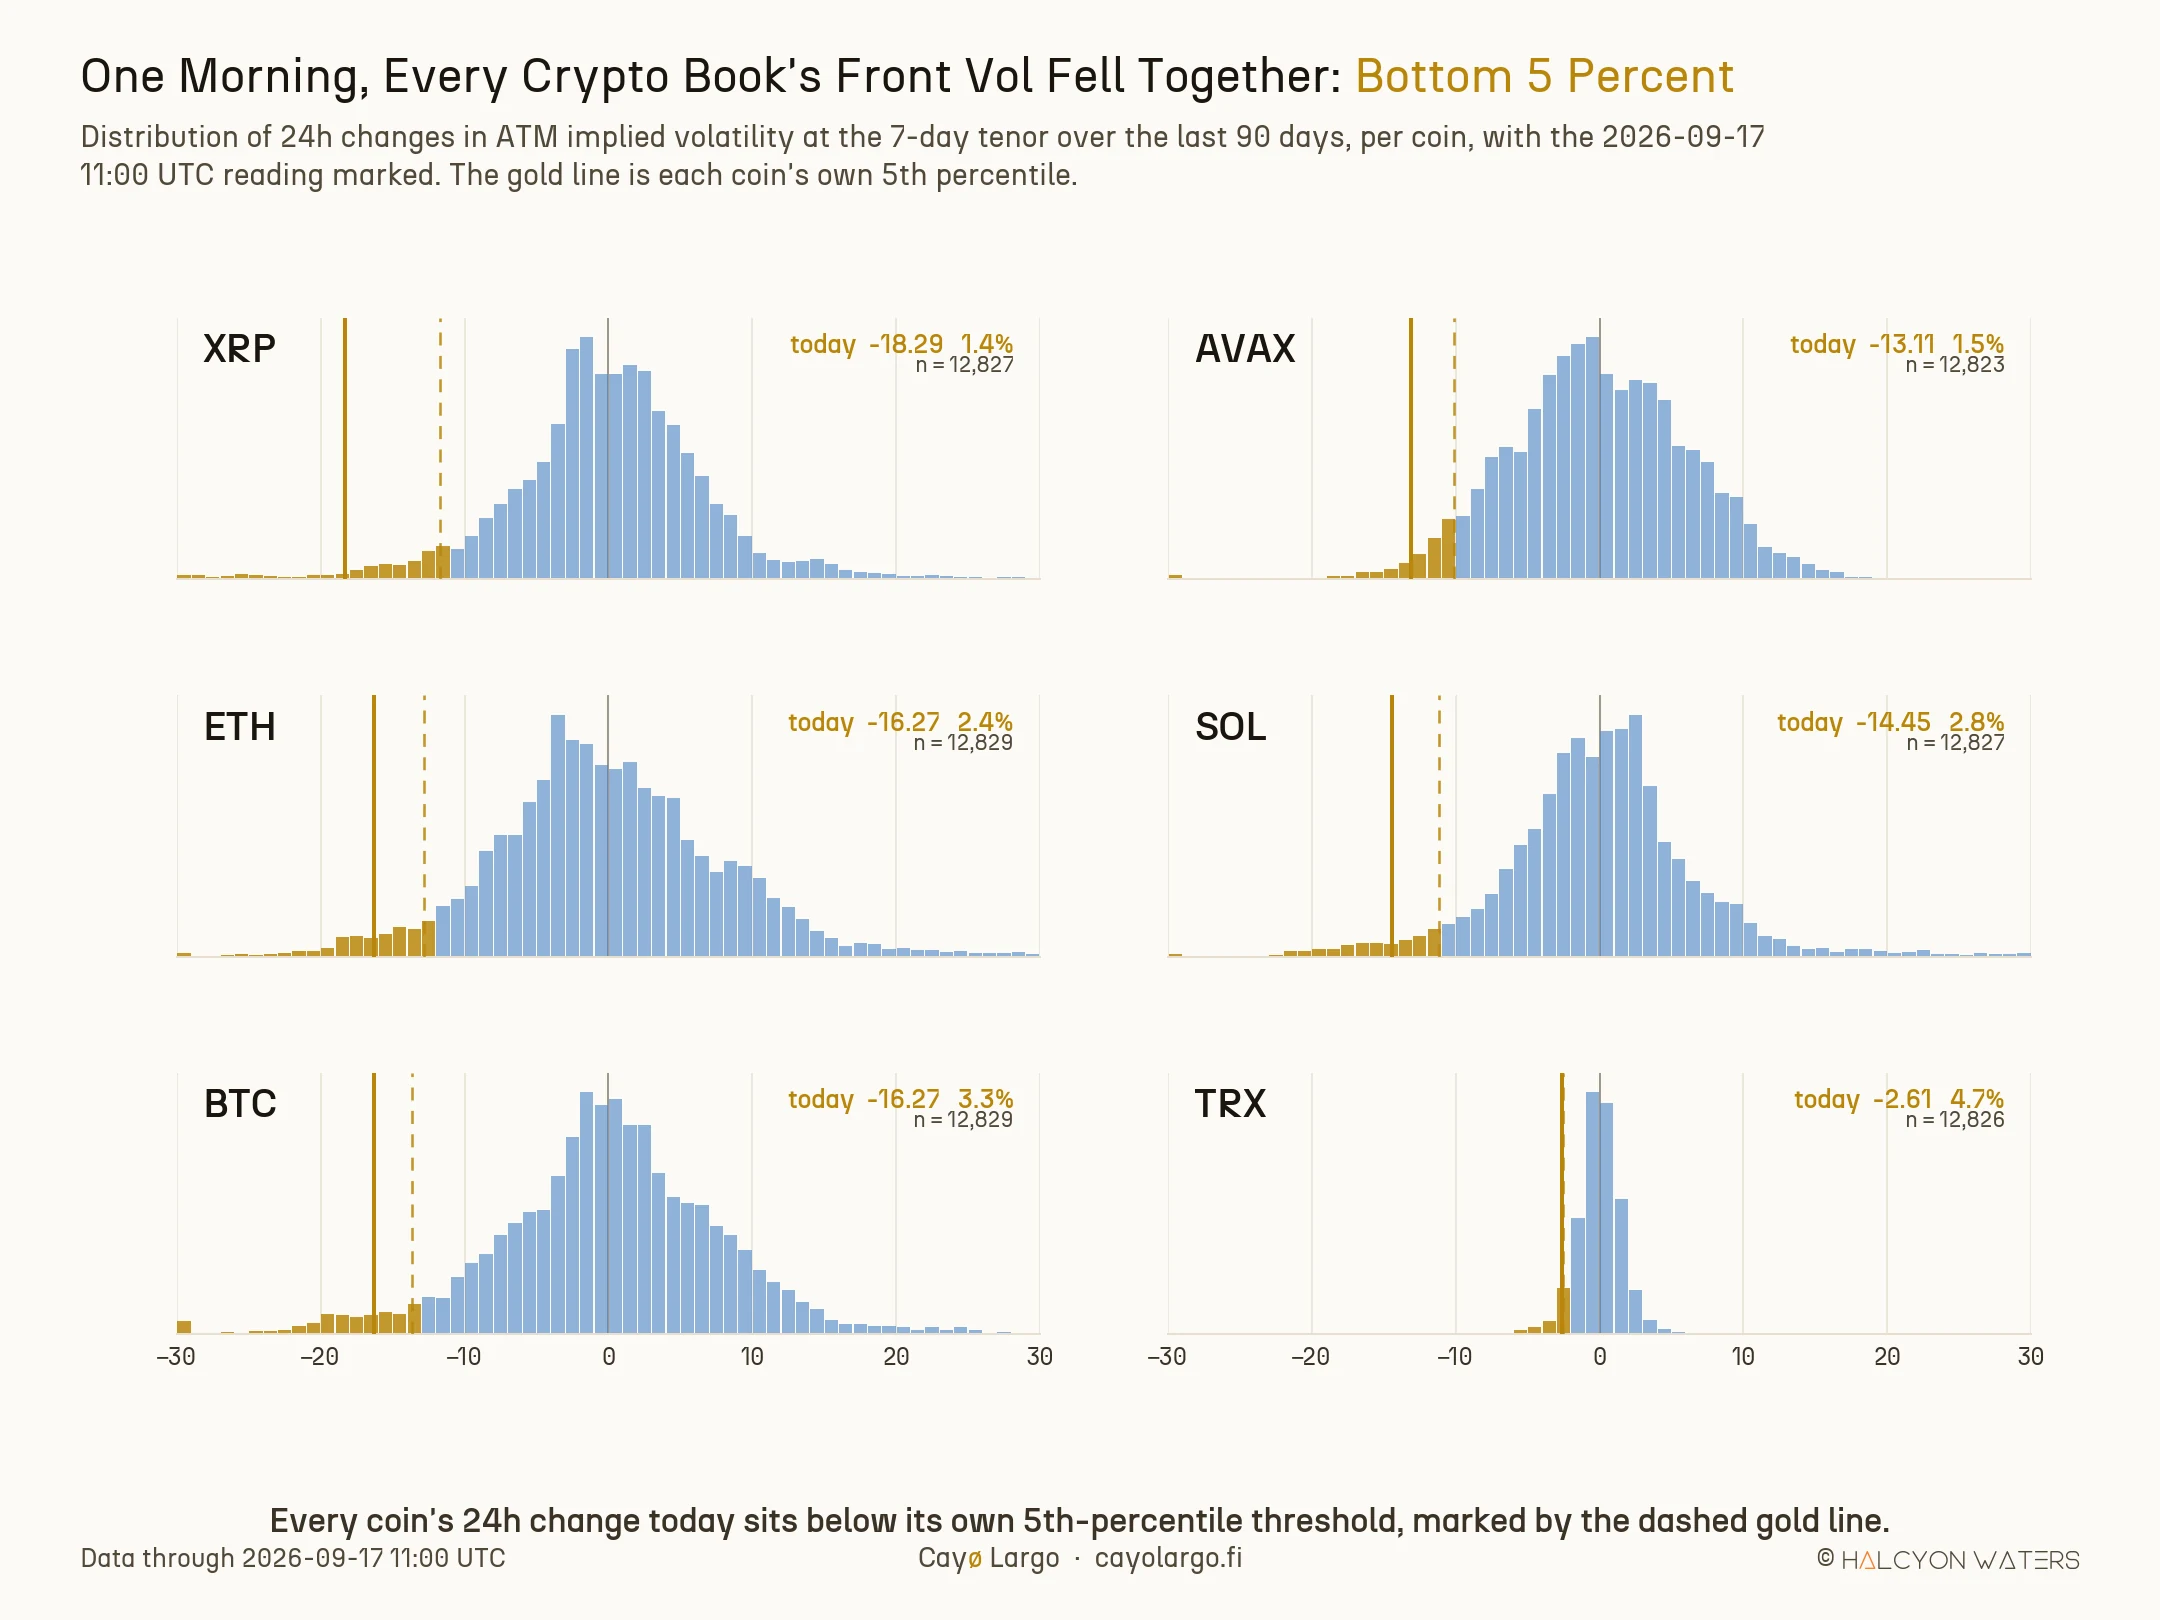
Figure 2: Each panel is one coin's 90-day distribution of 24h changes in $\sigma_{7d}$. The dashed line is that coin's 5th percentile, the solid line is today's reading. Today's line sits inside the tail on every coin. TRX has its own scale because its book is thinner; the geometry is the same.
The second axis of the same event lives in the dumbbell above. In 24 hours BTC, ETH and SOL flipped from BACKWARDATION to CONTANGO, TRX and AVAX to FLAT, and XRP's spread halved from -30.4 to -12.3 volatility points. The term-structure flip and the front-IV crash are the same shape read from two sides. When the front gives back this many points against a back end that barely moved, the shape has to un-invert. When every coin does it together, both readings print at once.
The base rate, and why it lands as a finding rather than a headline
The rate at which every one of six coins prints a bottom-5% 24h front-IV change in the same 10-minute cycle over the last 90 days is 0.24%: 31 cycles out of 12,821. Those 31 cycles cluster on three calendar dates. Everything else in the window sat between zero and five.
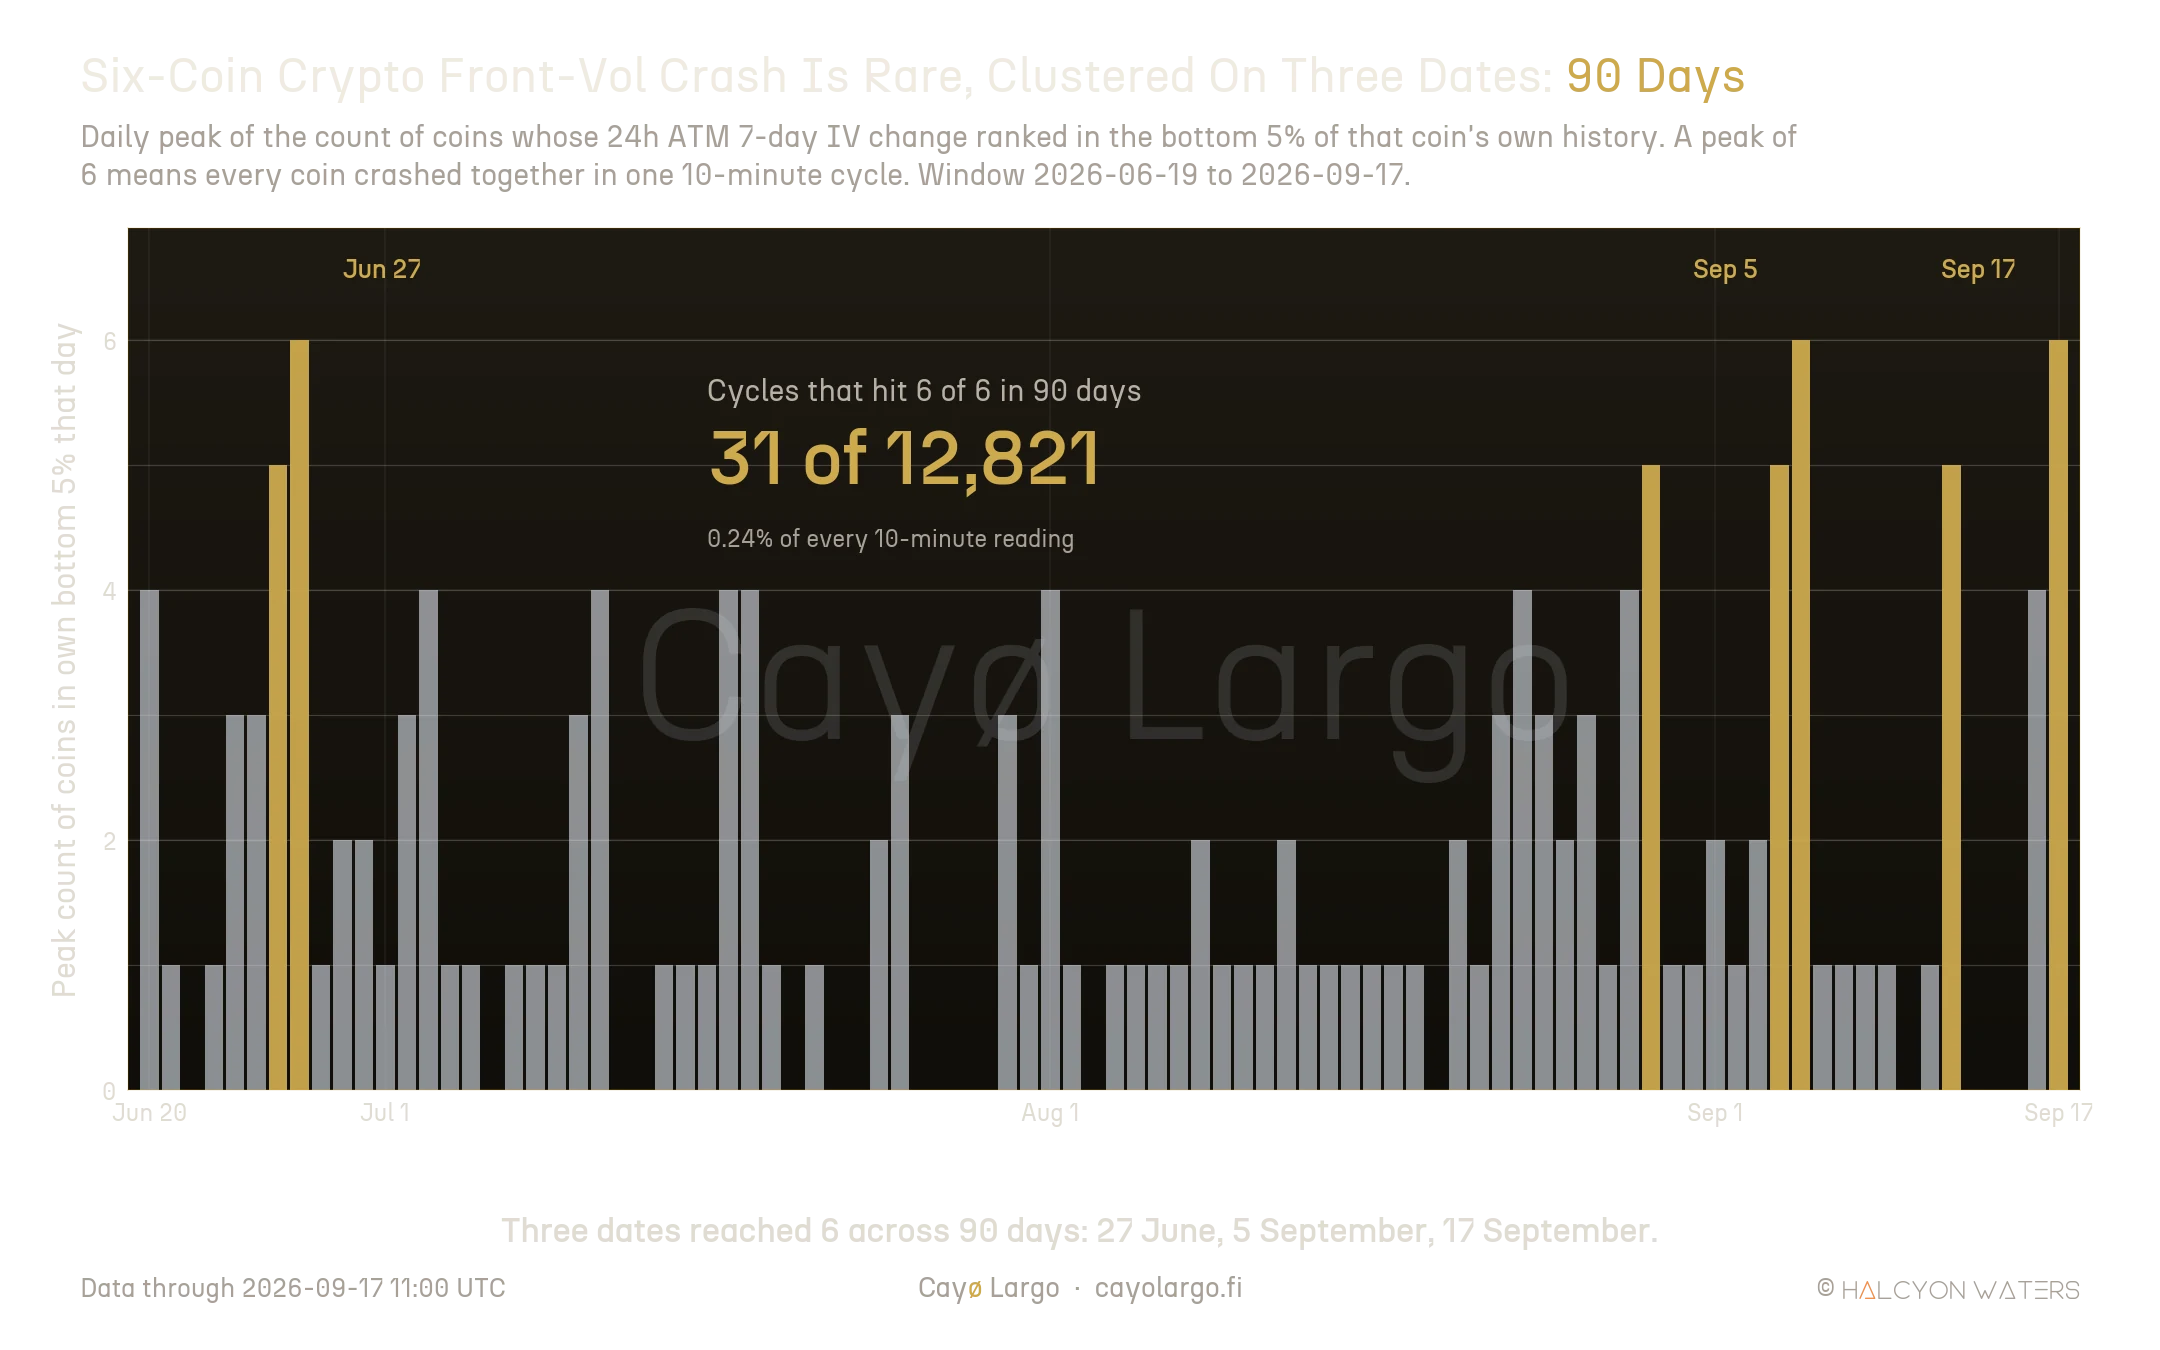
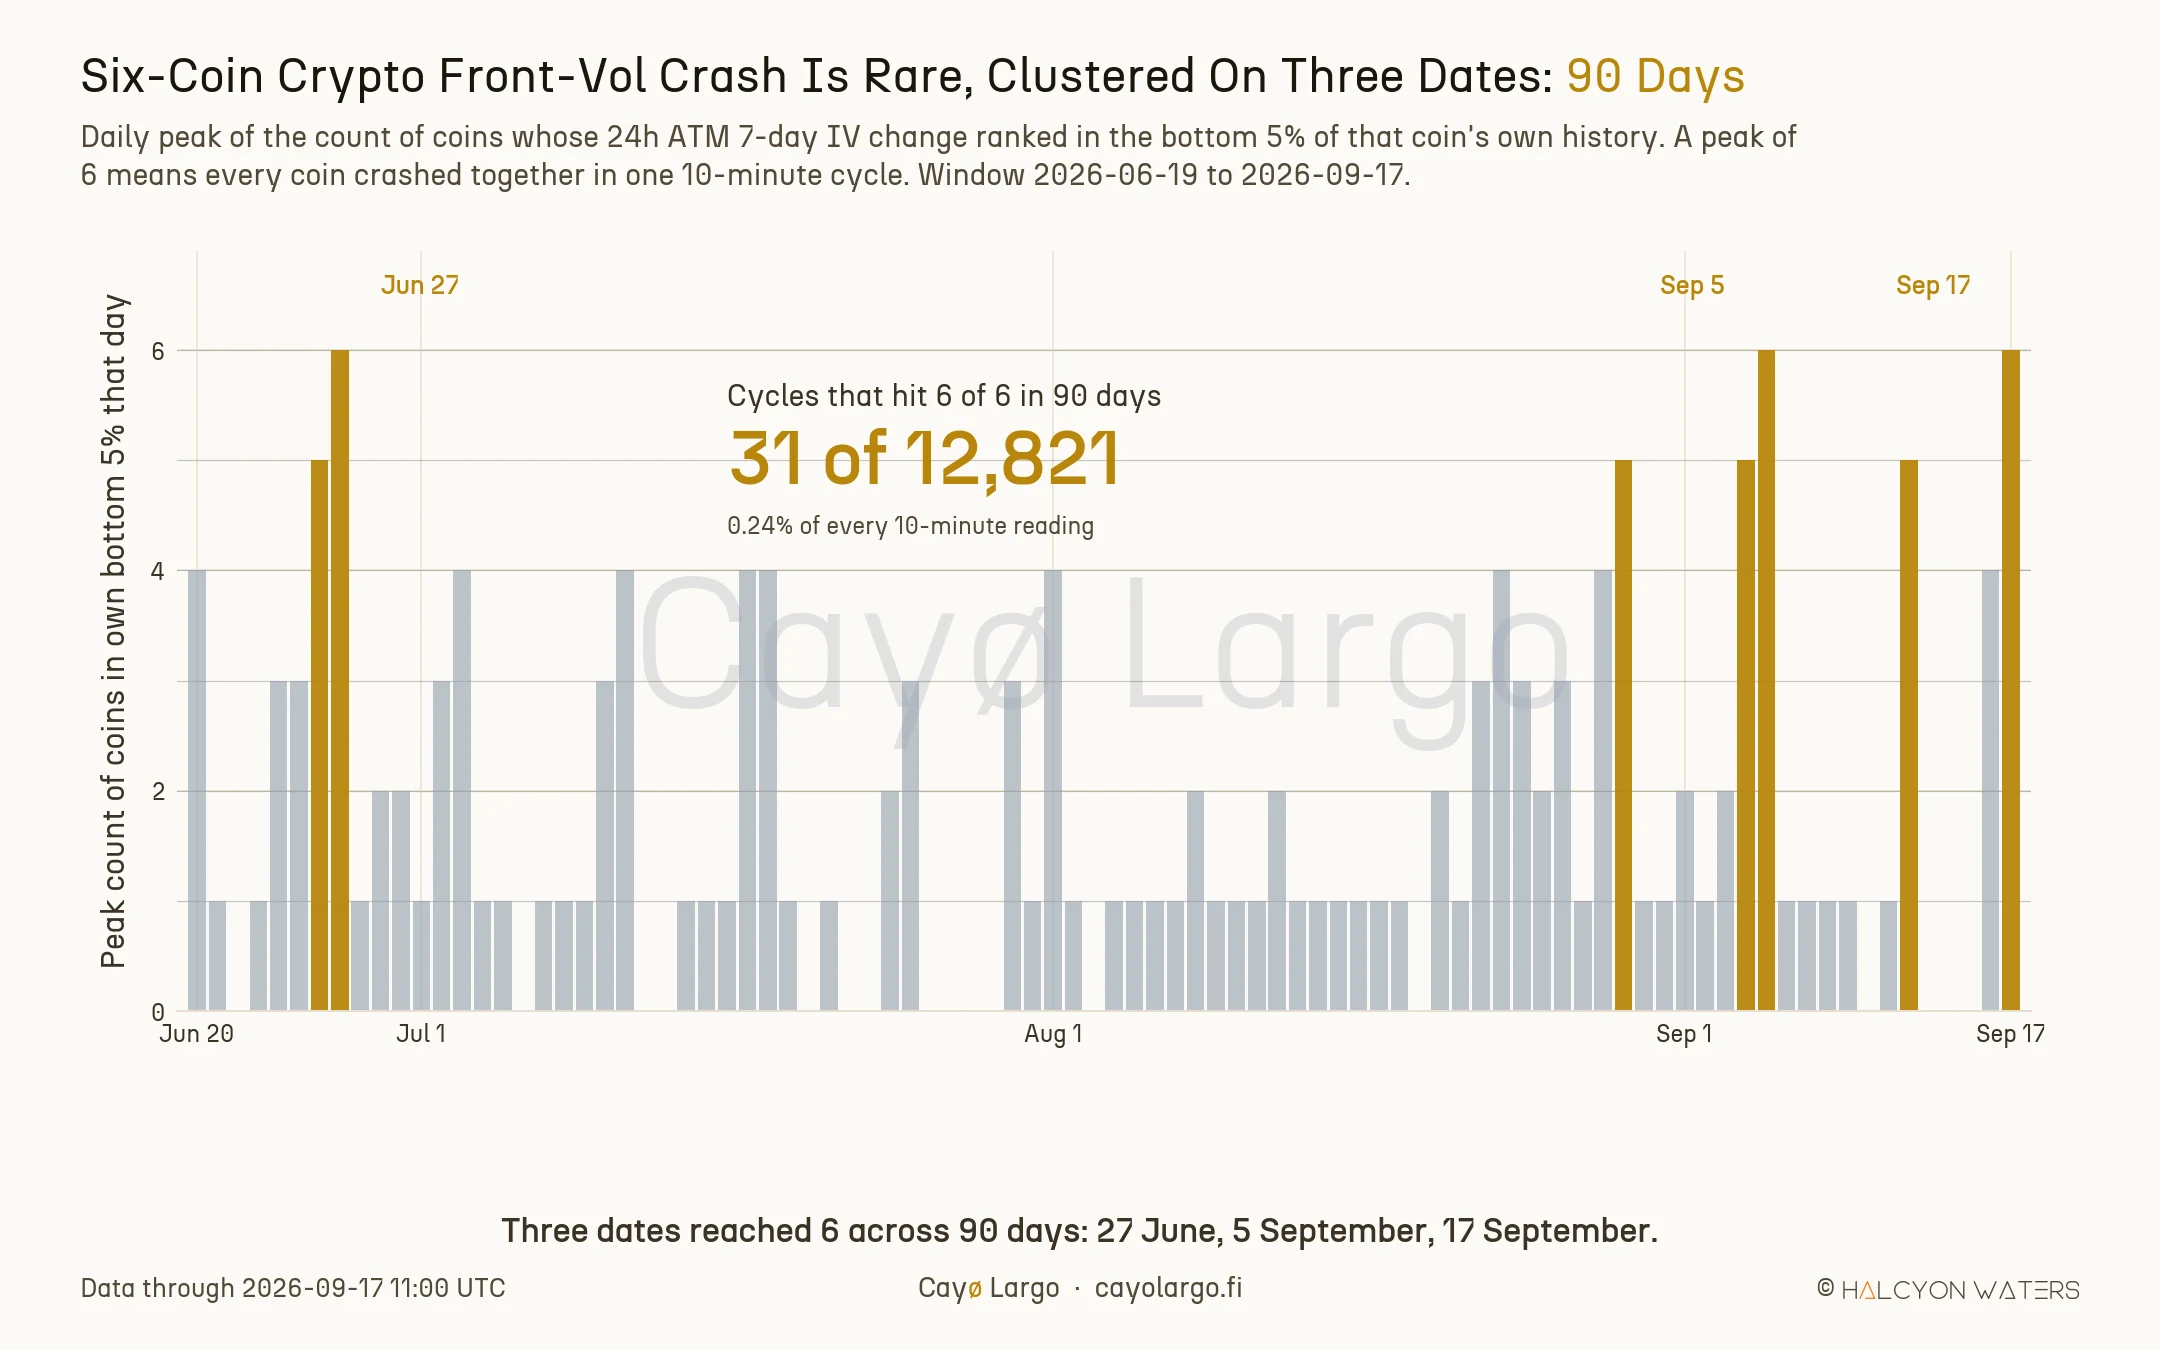
Figure 3: Daily peak of the count of coins whose 24h front-IV change ranked in their own bottom 5% during any cycle that day. Most days do not clear four. Three days across 90 reached six: 27 June, 5 September and 17 September.
The term-structure axis prints the same way, on a different denominator. Five simultaneous BACKWARDATION-to-CONTANGO-or-FLAT flips in one 24h window have printed in 42 of 12,797 cycles across 90 days. The six-of-six flip has printed once. On 27 June. The two axes disagree on which cycles are marginal. They agree, sharply, on which cycles are joint. The dates that carry a six-of-six front-IV crash are the dates the term structure flipped hard. Not coincidence. The same mechanism prints both, and it prints rarely.
The received view holds that BACKWARDATION is a shape a market wears because a specific event is priced into the front. That shape ends when the event does. Genesis wrote it up after the February 2023 CPI release: the front of the Bitcoin curve "collapsed from ~60% pre-CPI to the mid 30%s" once the print landed. Garrett DeSimone at OptionMetrics had made the mechanism explicit three years earlier for the 2020 US election. He called the VIX curve's backwardation an event-driven shape whose resolution would "produce a collapse in the November VIX contract". Both readings belong here. The joint cross-coin version is what our archive can show that theirs could not.
How this was measured
Every quantity in this note comes from deribit_options_oria_coin_surface, the per-coin volatility surface table behind the Volatility term structure endpoint in the API, at ten-minute cadence. The window runs 2026-06-19 to 2026-09-17 UTC on BTC, ETH, SOL, XRP, AVAX and TRX. The 24h change is a LAG(atm_iv_dte_7, 144) in the cycle grain and the percentile is the PERCENT_RANK() of that change over each coin's 90-day sample. The dumbbell plate is a direct read of the same table at two cycles 24 hours apart; the term-structure shape and inversion regime labels come out of term_structure_shape and inversion_regime. Realised 7-day volatility is realized_vol_7d from the same row, computed from spot returns. The current shape and the surface behind it are visible on the term structure page of the Volatility Landscape, and the whole ATM surface across expiries lives on the Vol Surface Explorer.
What this does not say
The finding is a joint fact, not a forecast. We measure that every coin's front implied volatility fell hard in the same cycle. We measure that five of six term structures un-inverted with it. And we can price how rare that joint event has been across 90 days. What we do not do is say where spot goes next. Nor do we test whether these three joint dates share any second common ingredient. A sample of three dates in one 90-day window will not carry that weight. Any prediction built from it would be a story the numbers do not tell.
We also stop short of interpreting the front-vs-realised gap. Variance risk premium CHEAP on five of six coins with realised 7-day above implied is a real reading. It has its own field note in our variance risk premium guide. The fast side of the term structure has its own too, in the pre-expiry IV bow shock. What each of those typically does next is not something we quote onto today's cycle. The sister piece on how long inversions actually last is the reason to be careful. A shape that ended today may reopen inside the hour.
What to watch
Two things are worth carrying out of this cycle rather than three. First, the joint index. A single 24h window in which every coin's front implied volatility ranks in its own bottom 5% has printed on three calendar dates in 90 days. Each of those dates coincides with a term-structure flip. A desk that reads only one coin's front-vol move today gets a percentile. A desk that reads all six against their own histories gets an event. Second, the gap the crush leaves behind. Front implied volatility fell to a level realised has not yet met, on five of six coins, and the lifecycle phase everywhere is still EXPANSION. If realised follows implied down over the next few sessions, this reads as a market that had been paying an event premium and stopped. If it does not, the front is now cheap against a tape that is still moving.
References
- 23 October 2020, Garrett DeSimone at OptionMetrics: the VIX curve's backwardation in front of the 2020 US election is "a larger premium for insuring against short-term variance relative to longer term variance" whose resolution is expected to produce a collapse in the near contract. The clearest statement in the vault of the event-premium mechanism whose joint cross-coin version this note measures.
- 16 February 2023, Genesis on Deribit Insights: after the February CPI release, the front of the Bitcoin curve collapsed "from ~60% pre-CPI to the mid 30%s" in a single session. A single-asset, single-event precedent for the same shape our archive now sees on six coins in one cycle.
- 28 February 2024, Imran Lakha on Deribit Insights: BTC and ETH sitting in front-end term-structure inversion, driven by 1-2 week expiries picking up interest. A practitioner reading of the same shape our dumbbell shows on 2026-09-16, one asset at a time.
Frequently Asked Questions
What is a crypto front implied volatility crash across coins?
It is a single 10-minute cycle in which every one of the six coins Cayø Largo tracks prints a 24-hour change in its ATM 7-day implied volatility that ranks in the bottom 5% of its own 90-day history. On 2026-09-17 at 11:00 UTC every coin cleared that bar in the same cycle. Over the last 90 days that has happened in 0.24% of cycles.
How rare is a six-of-six front implied volatility crash in crypto?
Across 12,821 cycles in the last 90 days on BTC, ETH, SOL, XRP, AVAX and TRX, only 31 cycles printed a bottom-5% 24h front implied volatility change on every coin at the same moment. Those 31 cycles cluster on three calendar days: 27 June, 5 September and 17 September 2026. It is a genuinely rare joint event, not a slow drift.
What is term-structure un-inversion in crypto options?
Un-inversion is the transition from BACKWARDATION, where 7-day at-the-money implied volatility trades above the 60-day, to CONTANGO or FLAT, where it does not. On 2026-09-16 all six coins sat in BACKWARDATION. Twenty-four hours later BTC, ETH and SOL had flipped to CONTANGO, TRX and AVAX to FLAT, and XRP alone remained inverted with its spread halved. Five simultaneous flips have printed in 42 of 12,797 cycles across the last 90 days, and a six-of-six flip has printed once.
Did realised volatility fall with implied volatility on the same day?
No, and that is the reading worth carrying. At 11:00 UTC on 2026-09-17 realised 7-day volatility ran between 40 and 82 points on the five coins whose front implied volatility crashed, above the crashed implied on every one. The variance risk premium printed CHEAP on five of six coins with the lifecycle phase EXPANSION everywhere. The front-week vol premium unwound while the tape it was priced against was still running hot.
Related Articles
When Is The Crypto Front Week Actually Cheap?
Options traders read an inverted vol curve as a warning. Across 830 crypto days it was calm contango, not backwardation, that priced the front week best.
How Long Does Crypto Backwardation Last?
Across 4,712 inversion episodes on six coins, 67.1% of crypto term-structure backwardations were finished inside one hour and 0.81% lasted a full day.
Crypto Variance Risk Premium: Live IV vs RV on Six Coins
How to read IV vs RV charts and the variance risk premium to figure out whether crypto options are overpriced, underpriced, or fairly valued. Live AVAX example from Deribit.