How Long Does Crypto Backwardation Last?
Across 4,712 inversion episodes on six coins, 67.1% of crypto term-structure backwardations were finished inside one hour and 0.81% lasted a full day.
On 8 September, AVAX inverted its volatility term structure and un-inverted it 19 separate times in the 26.7 hours to 09:00 UTC. The episodes ran from a single ten-minute cycle to 21 of them. Sample that same tape once an hour and you would report one backwardation, or perhaps two and you would position around it as a state of the market.
A crypto volatility term structure inverts when front-dated implied volatility (IV) prices above longer-dated IV. Desks read the shape as a regime. Measured every ten minutes across six coins over 236 days, it is usually not a regime at all: 33.1% of inversion episodes ended inside a single ten-minute cycle, 67.1% were finished within one hour and 0.81% lasted a full day.
In this note we measure how long that shape actually holds, across 4,712 closed episodes on six coins. Then we take the two candidate predictors of a long inversion, namely its depth and its age and put both under the only condition that matters to a desk: what you could have known at the time.
The floor is not the market
An inversion episode is a maximal run of consecutive observations in which the front sits above the back. Simple enough. What the definition hides is the thing that decides the answer, which is how often you look.
Everything in this note is one estimator, the survival function of episode duration.
where is the duration of episode , the number of consecutive cycles it ran, the sampling interval, the number of closed episodes and the indicator returning one when the condition holds. Figure 1 is for three records. The detail that matters sits in : a duration is a count of cycles multiplied by how often you looked, so no episode shorter than can exist in the record at all.
The only published measurement of this quantity we have found comes from Amberdata, in a January 2023 review of four years of Bitcoin volatility regimes on Deribit Insights. Its ATM term structure section reports a summary table for time spent inverted: mean 85.7 hours, median 48, maximum 417. The minimum in that table is 1.0 hours.
Read that minimum again. It is not a property of the market. It is the sampling interval. An hourly record cannot hold an episode shorter than an hour and it cannot separate two inversions that open and close inside the same hour.
Astronomers have a word for this and it is not a compliment. Point a small telescope at a close binary and you get one star, faithfully recorded, night after night. The second star is not hiding. The instrument cannot resolve it.
Cayø Largo samples every ten minutes, what puts our own floor at ten minutes and 33.1% of episodes sit exactly on it. Both records pile up against their own floor. That is the signature of a distribution that has been cut off rather than observed.
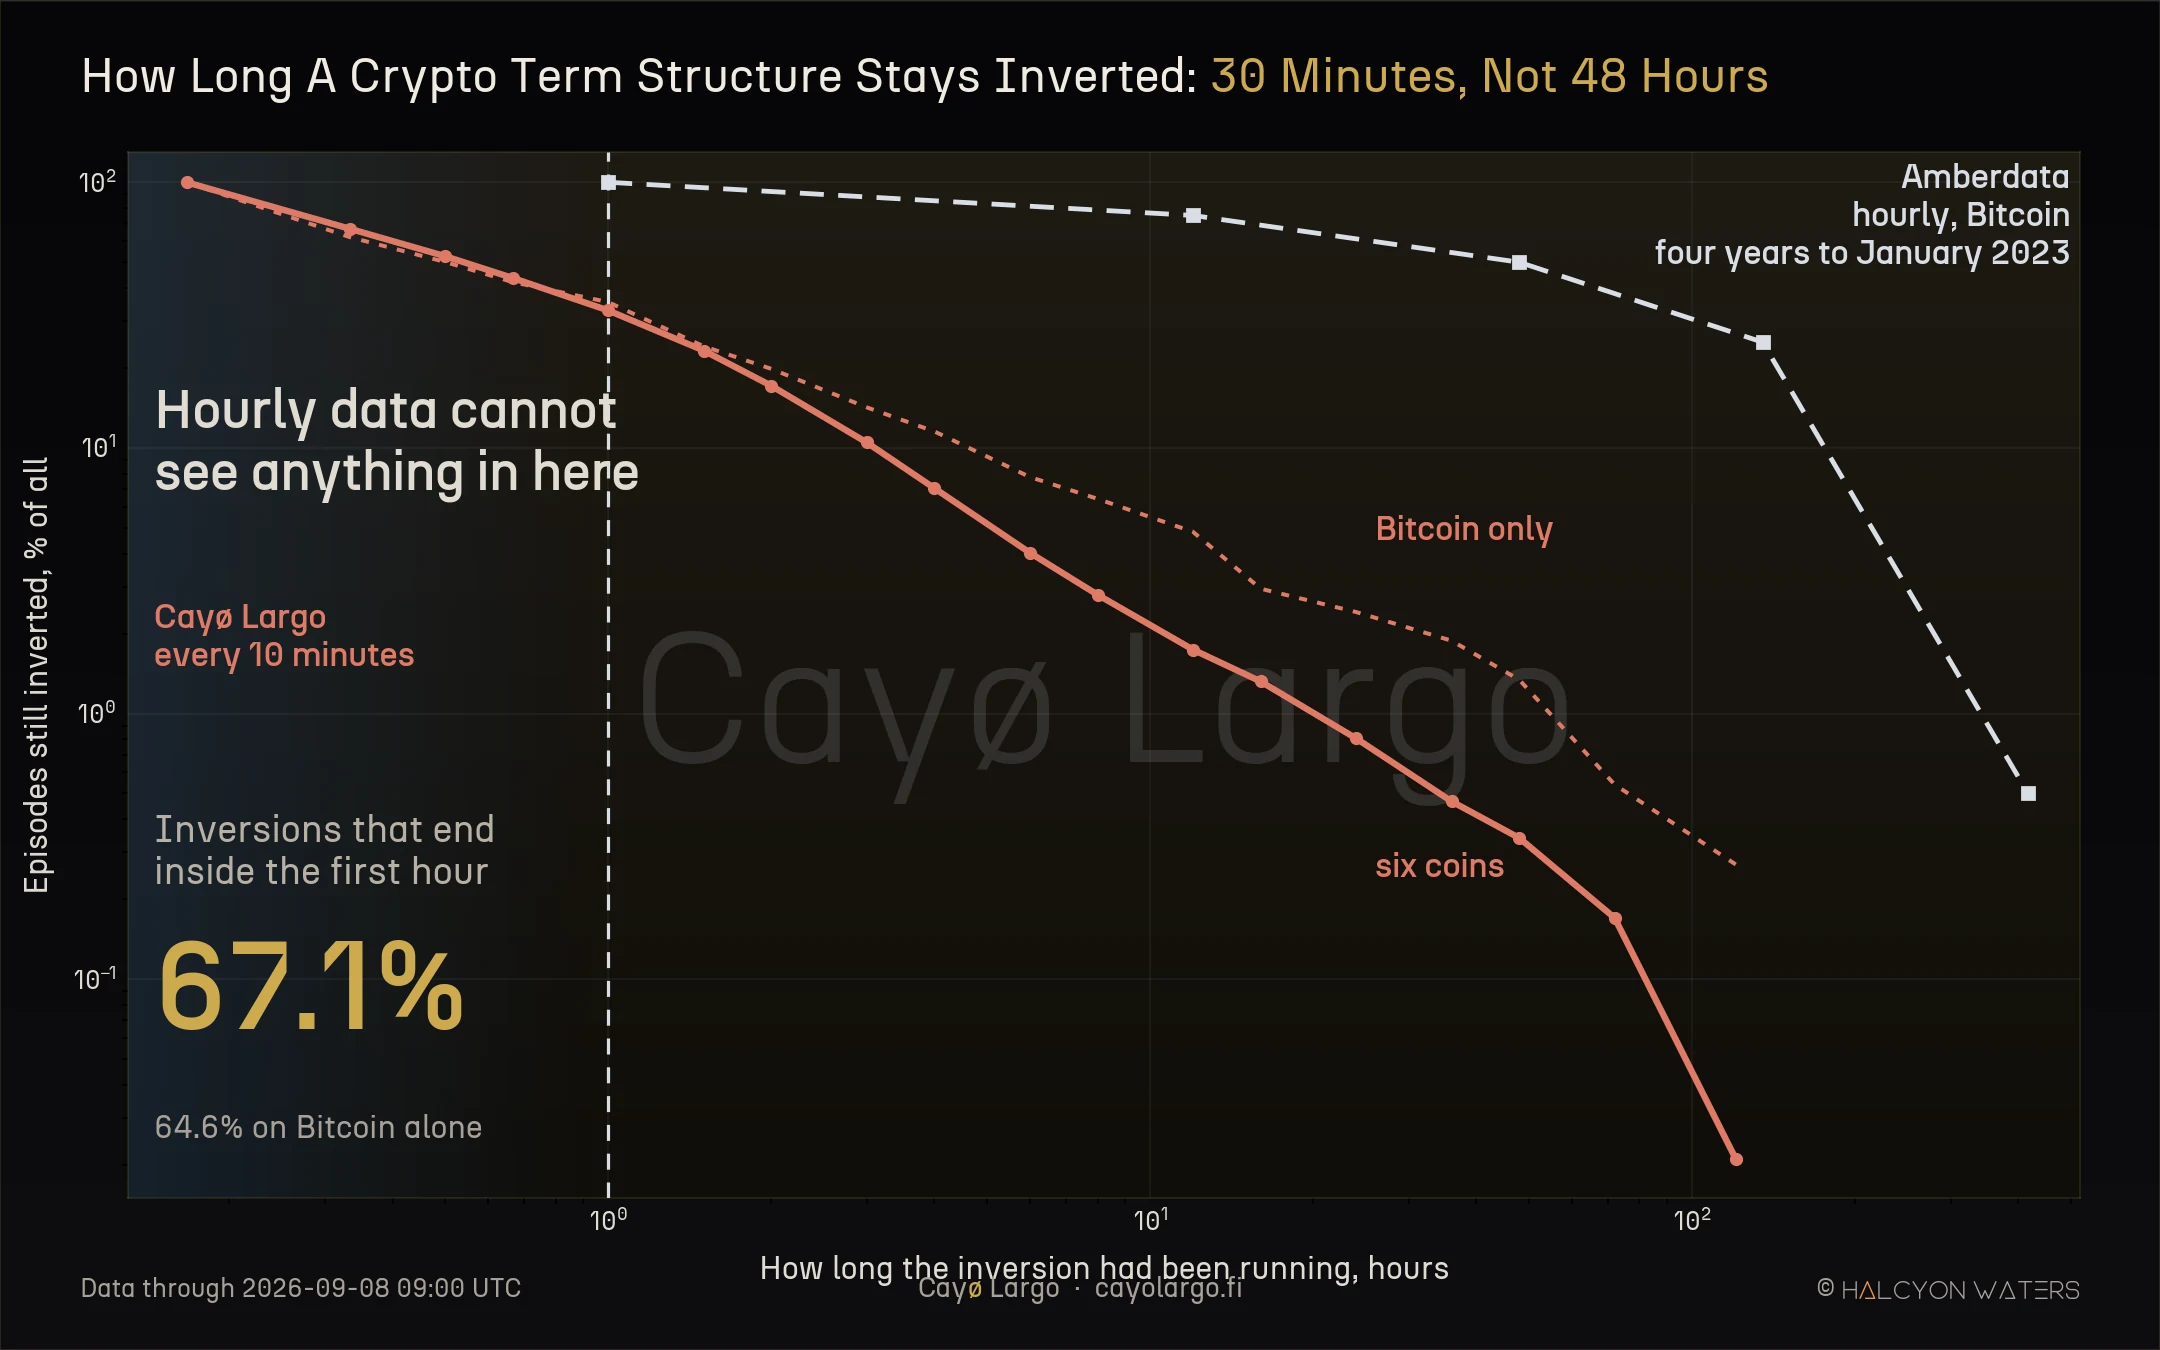
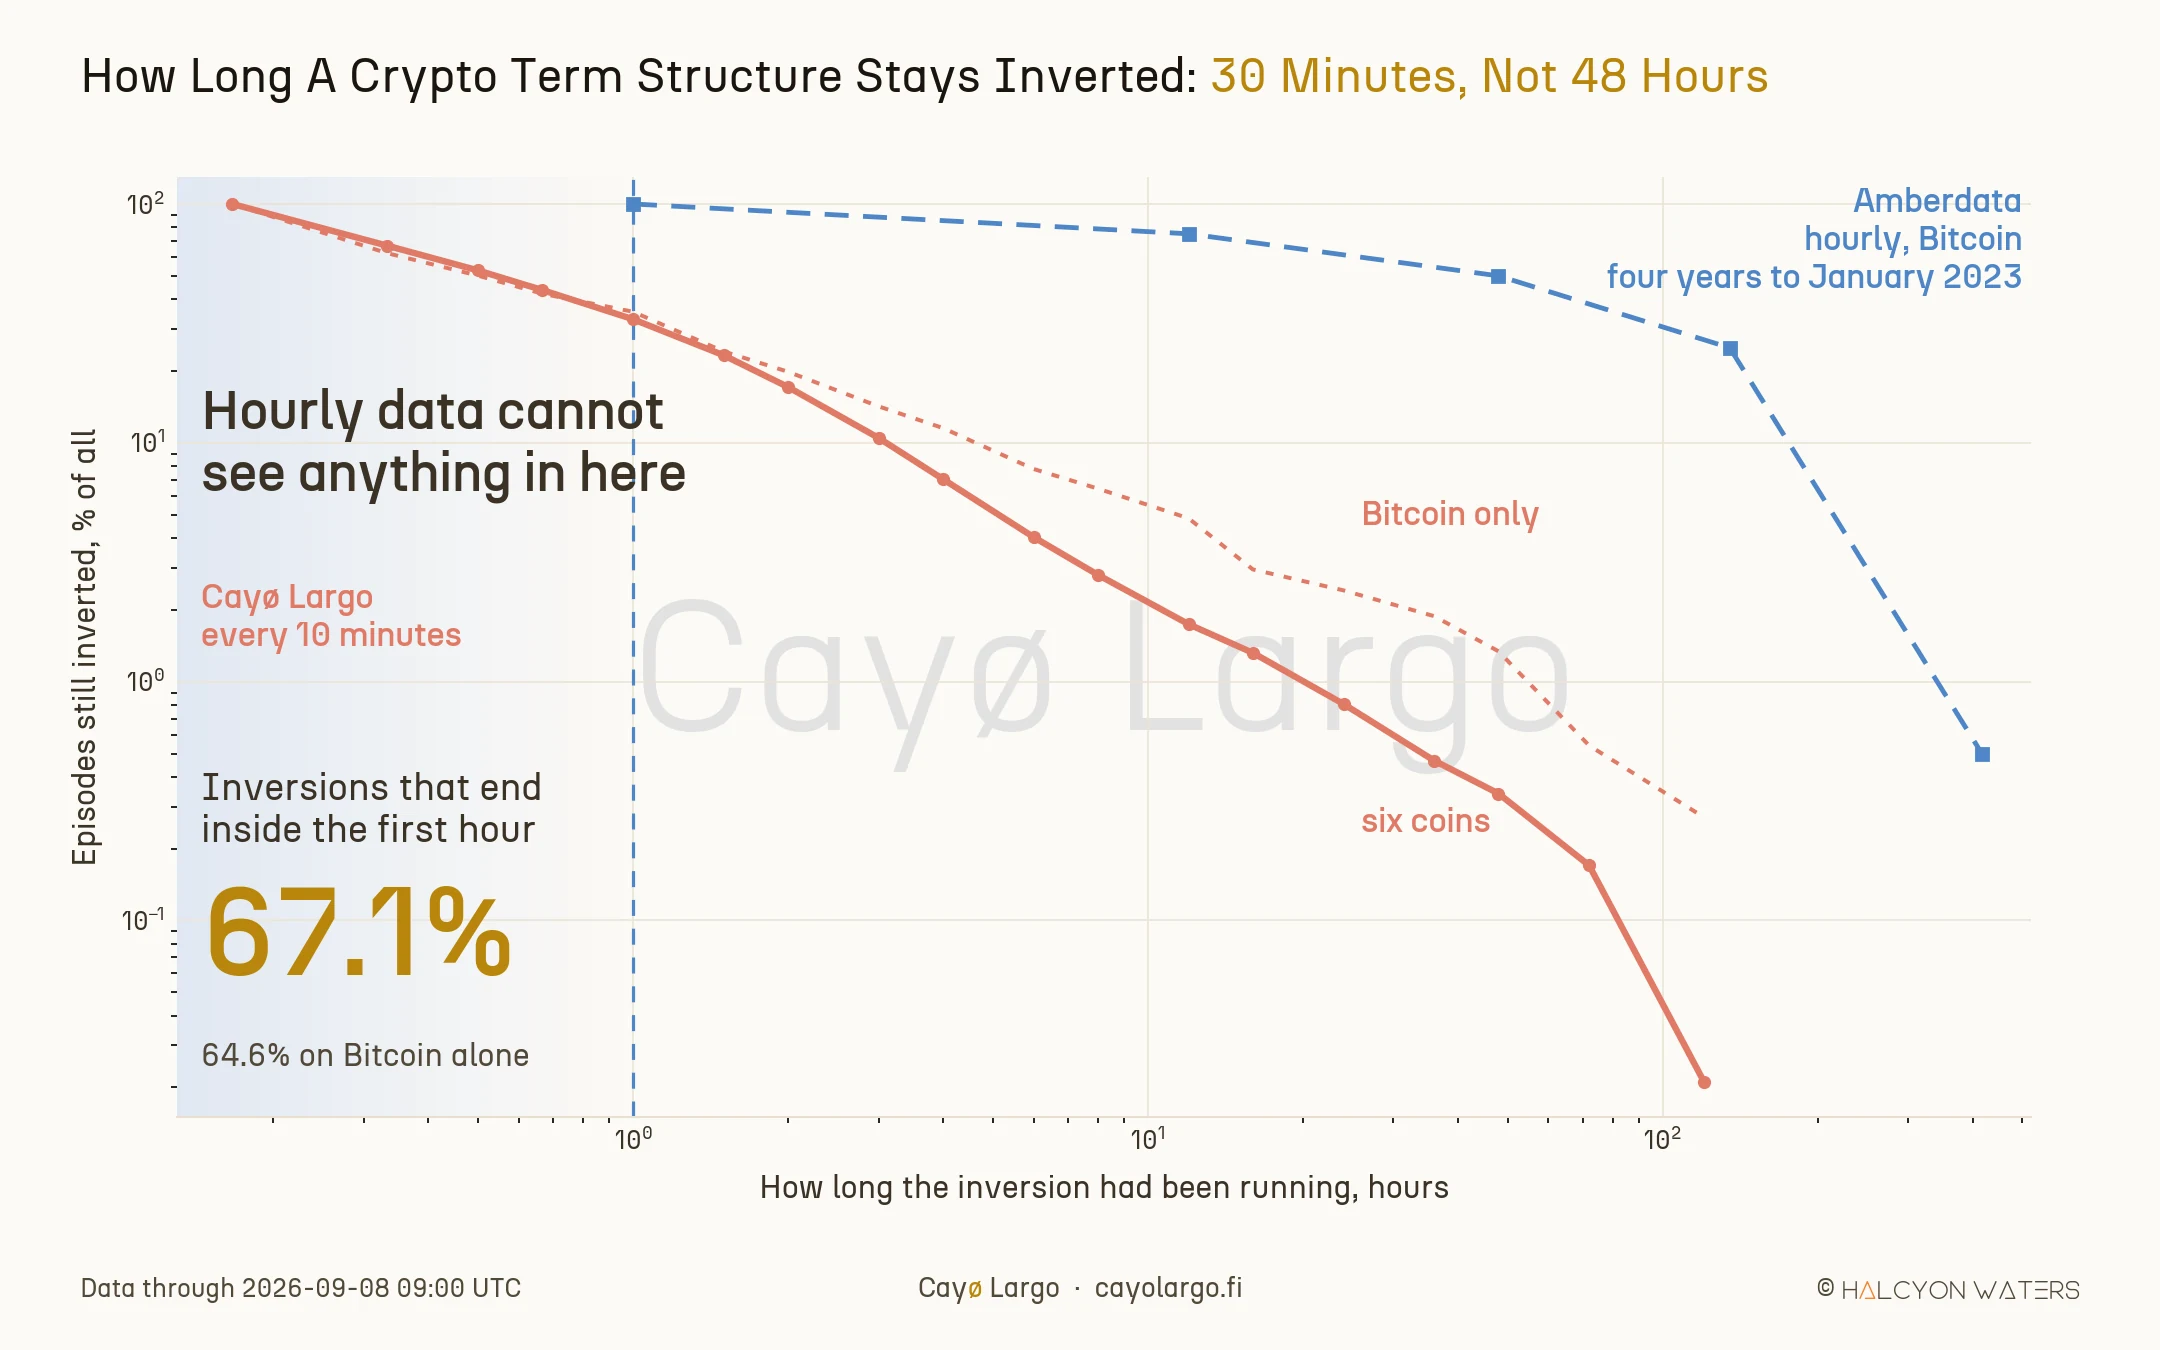
Figure 1: Both axes are logarithmic. The shaded band is everything an hourly record cannot resolve. The two Cayø Largo curves, six coins pooled and Bitcoin alone, are indistinguishable through the first hour and separate only in the tail, so the pooling is not what produces the result. Amberdata's hourly curve cannot begin until the one-hour mark.
A fair objection at this point: perhaps those ten-minute episodes are the classification boundary wobbling rather than real inversions. They are not. The mean deepest spread of a one-cycle episode is 5.09 volatility points of inversion and the gradient across duration buckets runs 5.09, 7.66, 10.66, 14.72 and 20.48 points for episodes lasting one cycle, up to an hour, up to six hours, up to a day and beyond. A ten-minute inversion is a real inversion. It is simply over quickly.
The numbers
| Coin | Episodes | Ended in one cycle | Finished inside 1h | Lasted 24h | Longest |
|---|---|---|---|---|---|
| BTC | 373 | 37.8% | 64.6% | 2.41% | 120.5h |
| ETH | 312 | 28.5% | 64.7% | 1.28% | 37.3h |
| SOL | 888 | 33.8% | 67.0% | 1.01% | 87.3h |
| XRP | 1,120 | 26.5% | 63.1% | 0.00% | 20.0h |
| AVAX | 954 | 29.1% | 64.2% | 0.00% | 10.8h |
| TRX | 1,065 | 42.8% | 75.5% | 1.50% | 112.3h |
| All six | 4,712 | 33.1% | 67.1% | 0.81% | 120.5h |
XRP and AVAX have never held an inversion for a full day in this archive, across 2,074 episodes between them. And the coin with the fewest episodes owns the longest one. Bitcoin held 723 consecutive ten-minute cycles of inversion, 120.5 hours, from 1 to 6 March 2026. Fewer inversions and far more conviction when they arrive.
The signal that broke
Rank the episodes by the deepest regime each one eventually reached and the result looks decisive. Of 3,484 episodes that never got past a shallow inversion, none lasted 24 hours. Of the 23 that reached an extreme inversion, all 23 did. Zero and 100%.
Too clean. The measurement is circular and we report it because the circularity is the lesson. Depth is taken over the whole episode, so an episode that runs three days has hundreds of chances to touch a deeper regime, while a ten-minute episode gets exactly one. We were not measuring depth against duration. We were measuring duration against itself.
The version a desk could act on takes the regime at the first cycle of the episode, which is the only moment the information exists in advance. Measured that way the separation nearly disappears. An episode that opens in a deep inversion reaches 24 hours 1.34% of the time, 13 of 970. One that opens shallow reaches it 0.67% of the time, 25 of 3,742. A factor of two, from a signal that had looked like a factor of infinity.
What does move the odds is the clock and the quantity to read is conditional survival.
where is the age an episode has already reached and the horizon asked about. An episode that has already run six hours goes on to a full day 20.0% of the time, against 0.81% measured from onset. One that has run twelve hours does so 46.3% of the time. Survival tells you far more than depth and it is only available if the curve is timed finely enough to know how long the episode has been running.
How this was measured
Episodes were extracted from deribit_options_oria_coin_surface, the per-coin volatility surface table behind the ORIA endpoints in the API, using the inversion_regime field at ten-minute cadence. The window runs from 15 January to 8 September 2026 across BTC, ETH, SOL, XRP, AVAX and TRX: 199,799 cycles, 4,727 episodes found and 4,712 closed. Episodes still open or ending on the final day are excluded, so nothing is right-censored. We cross-checked the extraction against the platform's own inversion_duration_cycles counter on all 34 SOL and AVAX episodes since 7 September, what agreed exactly on every one. The live shape and its history sit on the term structure page of the Volatility Landscape.
What this does not say
The comparison with Amberdata is not a claim that they are wrong. Their window is four years of Bitcoin, ours is 236 days across six coins in a different market and we have not reconstructed their inversion threshold. Their own chart already shows most episodes near zero with a small number of tall spikes carrying the mean, the same right-skew we find. The point here is narrower and it holds either way: duration is not a property of the market alone. It is a property of the market and the observation interval together.
One objection deserves an answer before anyone raises it. Our curve pools six coins against a study of Bitcoin alone, so the altcoins could be dragging the median down. They are not. Bitcoin on its own gives the same 30-minute median, with 64.6% of its 373 episodes finished inside the hour and 2.41% reaching a full day, against 67.1% and 0.81% pooled.
Nor does any of this say where volatility goes next and we have not tested it. An inversion that ends after twenty minutes may well be followed by another one twenty minutes later. On these six coins that happens constantly and AVAX on 8 September is the example we opened with rather than the exception we found afterwards.
What to watch
Two things change once inversion is treated as an episode rather than a state. A signal built on "the curve is inverted" fires many more times than its author expects and most of those firings are gone before a hedge reaches the book. A signal built on "the curve has been inverted for six hours" fires rarely and carries a base rate twenty-five times higher. Same shape, different question. The same holds for front-dated volatility more generally, where the fast structure only appears once the sampling is fine enough to hold it, as in the pre-expiry IV bow shock.
Which leaves one test you can run on any term-structure feed you pay for, in a single query. Ask it for the shortest inversion it has ever recorded. If the answer is exactly one sampling interval, you are not reading the market. You are reading the instrument.
References
- 2 April 2020, Cryptarbitrage on Deribit Insights: during the 12 and 13 March 2020 crash the Bitcoin futures curve moved from contango to backwardation in a matter of minutes. A different curve from the one measured here and the same point about speed.
- 23 October 2020, Garrett DeSimone at OptionMetrics: backwardation in the VIX futures curve read as an event-driven shape that would collapse once the 2020 US election resolved. The received framing of an inversion as a state with a cause and an end date.
- 24 January 2023, Amberdata on Deribit Insights: four years of Bitcoin volatility regimes, including the time-to-live table for backwardation in the ATM term structure section, with a mean of 85.7 hours and a minimum of one.
- 22 February 2023, Garrett DeSimone at OptionMetrics: the VIX counts only options expiring between 27 and 37 days out, so an index can be structurally blind to activity outside its own measurement window. The same problem in a different dimension.
Frequently Asked Questions
How long does crypto term-structure backwardation usually last?
Measured every ten minutes across six coins, the median inversion episode lasts 30 minutes. Two thirds are finished inside one hour and 0.81% survive a full day. The mean is pulled to 1.6 hours by a small number of long episodes, so the mean is not the typical case.
Does a deeper inversion last longer?
Barely, at the moment you could act on it. An episode that starts in a deep-inversion regime reaches 24 hours 1.34% of the time against 0.67% for one that starts shallow. Ranking episodes by the deepest regime they eventually reached produces a far cleaner separation but that measurement is circular because a longer episode has more chances to go deep.
Why do published estimates of backwardation duration differ so much?
Sampling interval. An hourly record cannot hold an episode shorter than an hour and it merges two inversions that happen inside the same hour into one. A ten-minute record splits them. Both distributions pile up against their own measurement floor, so the answer depends on how often the curve was observed.
What actually predicts a long inversion?
Elapsed time, not depth. An episode that has already run six hours reaches a full day 20.0% of the time, against 0.81% measured from onset. Survival is the useful conditioning variable and it is only available if the term structure is sampled often enough to time each episode.
Related Articles
Why Crypto IV Spikes Before Expiry: The Bow Shock
Why does crypto implied volatility spike before expiry? An IV Footprint heatmap shows a bow-shaped front flaring at the wings before each Deribit settlement.
Crypto Variance Risk Premium: Live IV vs RV on Six Coins
How to read IV vs RV charts and the variance risk premium to figure out whether crypto options are overpriced, underpriced, or fairly valued. Live AVAX example from Deribit.
Crypto Put Skew vs Volatility Level: Reading the Gap
Implied volatility fell on all six coins overnight and put skew did not follow. On five of six, skew now ranks higher than the volatility level itself.