Dealer Greek Exposure: GEX, Charm and Vanna, With the Maths
How dealer gamma exposure (GEX), charm and vanna are actually built, formula by formula and how the order-flow sign is set. Computed on live Deribit options data.
This is a methodology note from Cayo Lab, not a tutorial. It assumes Black-Scholes Greeks, the GEX construction and the idea of dealer hedging flow. Dealer-positioning heatmaps have become a staple on stock-index options desks. This note builds one from the ground up for crypto and it does not skip the step that quietly decides the colours.
The Picture and the Thesis
Greek exposure heatmaps have become popular among options traders in the stock market. A panel like the one below reads like a weather map. Price climbs one axis, time runs along the other. A coloured field seems to mark where market makers will be pushed to hedge. The picture is compelling and intuitive. The construction behind it is rarely spelled out.
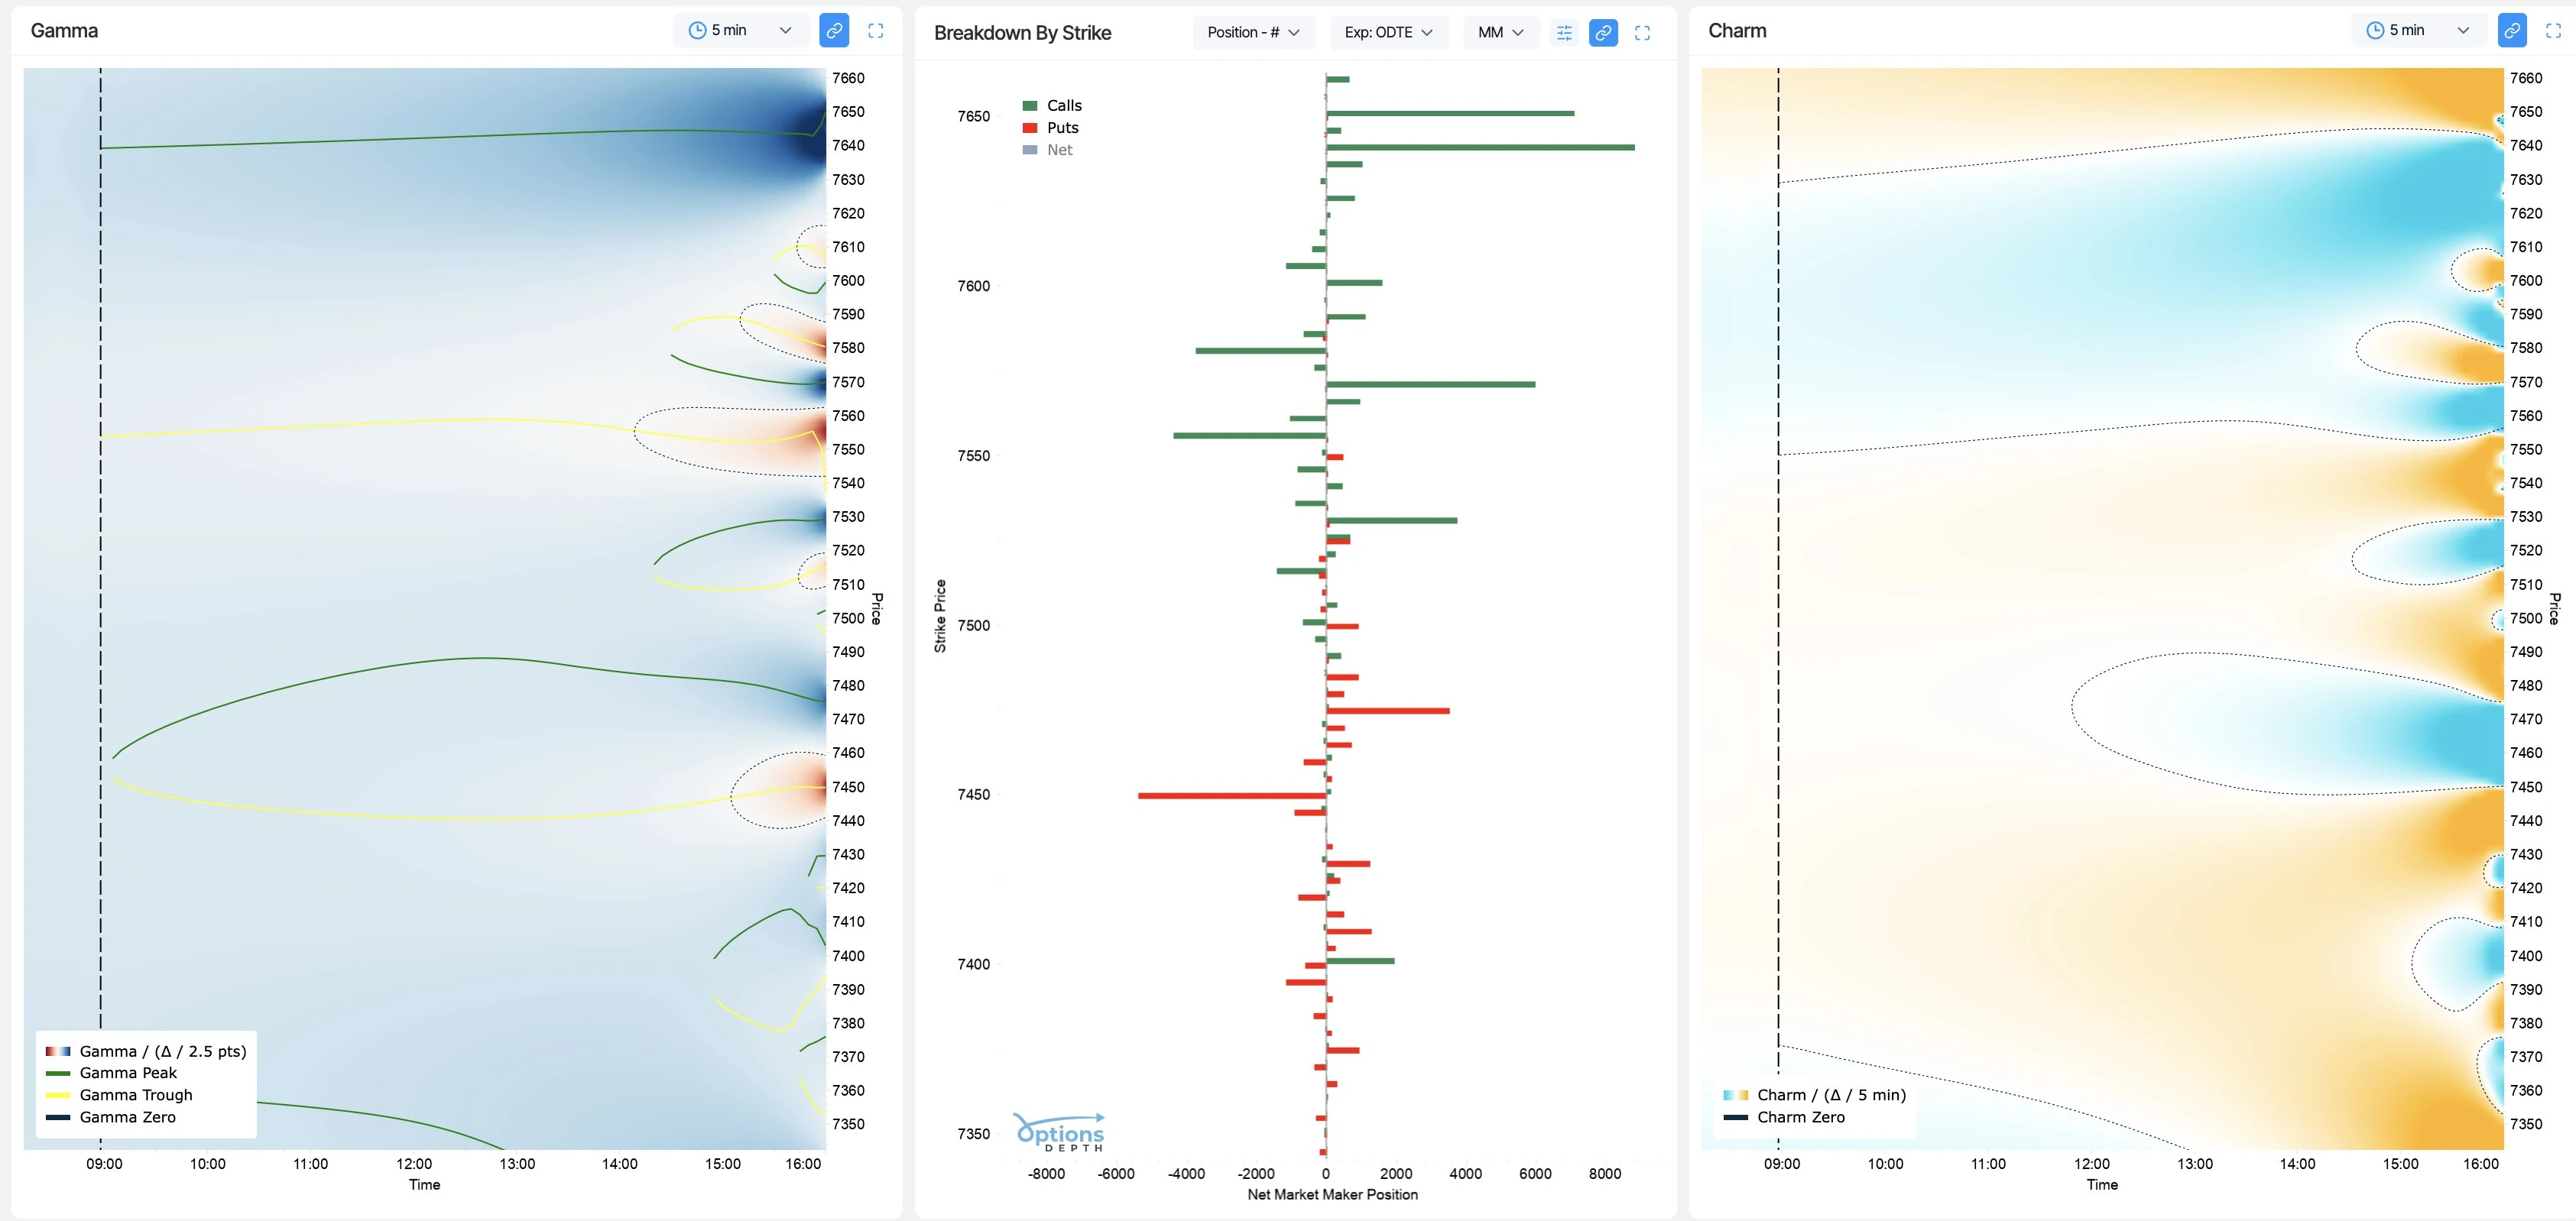
Figure 1: An SPX market-maker exposure dashboard. Gamma on the left and Charm on the right as price-by-time heatmaps, with a per-strike position breakdown between them. The shape is the inspiration; this note documents the construction, for crypto.
Source: @OptionsDepth on X.
Take one of the two heatmaps, say the Charm panel on the right. The layout becomes clear. Price climbs the side as a ladder of levels and time runs along the bottom. A dashed vertical line drops straight down across every price on the ladder, marking the current time on the x-axis (let's call it the NOW line hereafter). To its right the colour takes over, a smooth field that seems to show where the market is headed through the rest of the session.
That last impression is the trap and it is the first thing to unlearn. The colour to the right of the NOW line is not a forecast of price. Each cell answers a single what-if and nothing more. If spot were sitting at level at future time , the colour says, this is the net dealer hedging pressure the option book would carry. How that single number is actually built, cell by cell, is the next section's job. Read a single column and you are reading a what-if ladder of prices at one instant, not a claim that price will be anywhere on it. The map is a field, scanned. It is never a path.
So the picture is easy to draw and easy to misread. What almost no one writes down is how the field underneath it is built. That goes double for crypto and it goes double again for the one step that decides whether a patch of the chart comes out blue or red. The dashboard in Figure 1 draws two of these maps, Gamma on the left and Charm on the right. We build three. Charm is the pull of time, Gamma the pull of price, Vanna the pull of volatility. Together they are the full set of forces a dealer has to hedge. Vanna, the volatility channel, is the one almost no dashboard bothers to show.
This article opens up the whole construction, walks it across all three and ends where the honest accounts end, at the places the map breaks. Everything here drives a live tool, our Greek Exposure Projection panel and the BTC, ETH and SOL figures below are screenshots of it.
The General Construction
Underneath these heatmaps is a single engine and it is worth seeing once before the Greeks pull it apart. Pick any cell . Nothing about it is real yet. is a hypothetical spot level taken off the price ladder and is a clock time somewhere to the right of the NOW line. The engine's only job is to turn that one coordinate into a single signed number, the value that colours the cell. It does that in four moves, identical for every Greek.
Advance the clock. Each option in the chain expires at its own time . At the cell's time , its remaining life, in years, has shrunk to
Anything that would already have expired by drops out of the sum, which is why the chain thins as the cell moves to the right.
Re-price the moneyness at the hypothetical spot. For each surviving option, recompute the normalised log-moneyness at the cell's price and its shrunken life , not at today's spot. With strike , the option's implied vol read off today's surface and the Deribit-implied forward rate (near zero), the moneyness at the cell is
Slide the cell up the ladder and every moves; slide it to the right and every shrinks. This is the step where the cell's two coordinates actually enter the physics. The standard normal density , which all three Greeks share, completes the notation.
Evaluate the per-contract Greek. Feed that into the one Greek the map is drawing, written . This is the only slot in the whole pipeline that changes between the Charm, Gamma and Vanna maps. We leave it abstract here and fill it in section by section, one Greek at a time.
Sign it, scale it and sum. A bare Greek is per contract and points in whatever direction the option's convexity dictates. To turn it into the dealer's signed dollar exposure, multiply by the dealer sign and the open interest , which together are the raw per-strike positioning that the middle panel of Figure 1 plots directly, then by the contract multiplier and a power of spot that carries the units. Collected at a single strike price , summing the contracts that share it, that is
The power is fixed by the Greek's order in spot: for Charm and Vanna, for Gamma. Each is derived where that Greek lives. Every Greek also carries a small unit convention on top, a per-day, per-one-percent or per-vol-point factor, introduced in its own section. Summed over every strike in the chain, the cell finally has its value
and that single signed number is its colour.
That is the entire derivation of one cell. Slide across the grid, run the same four moves at every point and the smooth field assembles itself one independent cell at a time. Holding open interest and the volatility surface frozen while you sweep price and time is what makes this cheap enough to do thousands of times over. It is also what makes the map wrong in ways we come back to at the end. For now, hold onto the shape of the calculation, because everything that follows is a variation on it, the same engine with three choices of and .
The Dealer Sign
Before any of the maths, one decision quietly settles the colour of the whole map. The size of a Greek at a strike is mechanical, the formula hands it to you. The sign is not. Whether dealers are net long or net short a strike decides whether their hedging pushes with the magnitude or against it. Get it wrong and a whole cluster of strikes flips from positive to negative exposure. Magnitude is arithmetic. The dealer sign comes down to working out who is long and who is short. There are three ways to do it, each more honest than the one before.
The laziest is to assume dealers are short every strike. It costs no data and it is usually wrong. A better guess is the one equity-index desks lean on, the SpotGamma-style heuristic that clients buy downside puts and sell upside calls, leaving dealers short puts below and long calls above. Fair enough for the S&P but no basis in crypto. The honest way is to read the tapeReading the tape means watching the live feed of executed trades, the time-and-sales and for each fill noting who crossed the bid-ask spread to get done. That aggressor side reveals which way the dealer took the other end of the trade, so the dealer's net position can be added up strike by strike instead of guessed., classifying each trade by the side that crossed the spread, accumulating that aggressor flowAggressor flow is the running tally of volume sorted by who initiated each trade, the aggressor who lifted the offer or hit the bid to get filled. Buy-initiated minus sell-initiated volume at a strike shows whether traders were net adding or reducing positions there, which is what pins the dealer's sign on that strike. strike by strike until the book tells you its own sign.
The last path is the one Cayø Largo takes, using ORIA's taker-flow processor to sign the book per strike from real Deribit flow. Where a strike has live taker flow we sign it from the tape; where it does not, we fall back to the heuristic and flag it in the panel. Most crypto dashboards cannot sign the book at all, which is why this positions-up signing"Positions-up" means the sign is built bottom-up from actual positions, reconstructed trade by trade from the tape, rather than assumed top-down from a rule of thumb. There is no "positions-down" counterpart; the name simply marks that the book is rebuilt from real flow upward, not guessed from the index downward. is the edge, not a footnote. Exactly how we sign each strike and how confident we are in each call, gets its own article. Here it is enough that rides inside every formula that follows, with its quality shown rather than assumed.
With the sign settled, the engine is ready. Only one thing changes from map to map: which Greek goes into and how many powers of spot turn it into dollars. We take them in the order a desk feels them, slow to fast. Time first, then price, then volatility.
Charm: the Time Channel
Charm is the rate of change of delta as the clock runs, . It is the slow, overnight part of hedging, the flow that builds into expiry while price sits still.
The general Black-Scholes Charm, with no dividend and carrying the forward's implied rate , is
Crypto simplifies one half of this and not the other. The underlying pays no dividend, and that is what makes call Charm equal put Charm. With no dividend the call and put deltas differ by a constant, so their time derivatives are identical and we never track option type for the Charm sign. The rate, though, is not zero. Deribit's forward implies a funding rate we back out from put-call parity, roughly across our tables. The engine carries a single flat rate from that range rather than a full term structure, which is plenty at this resolution. Drop it and Charm would collapse to the textbook core but the term is no rounding error. It grows as and bites hardest near expiry. The engine therefore carries the full expression above.
The other half is the shape. Charm concentrates as , which makes it a near-expiry quantity. Days out it is small and smooth. Into the final hours it concentrates and fragments per strike.
Quote it per day by dividing the annual figure by 365, dealer-sign it and dollarise with one factor of because Charm is first order in delta:
The aggregate over the chain is the net dollar-delta the dealer book adds or reduces per day purely from time decay. Collapse the column at spot and you get the HedgeometerThe Hedgeometer is the single headline figure the panel reports in its Charm view, the net dollar Charm read at the current spot. It is the delta the dealer book would add or reduce per day from time decay alone, holding spot where it is now. Positive means the book gains delta as the clock runs, negative means it loses delta., the single number.
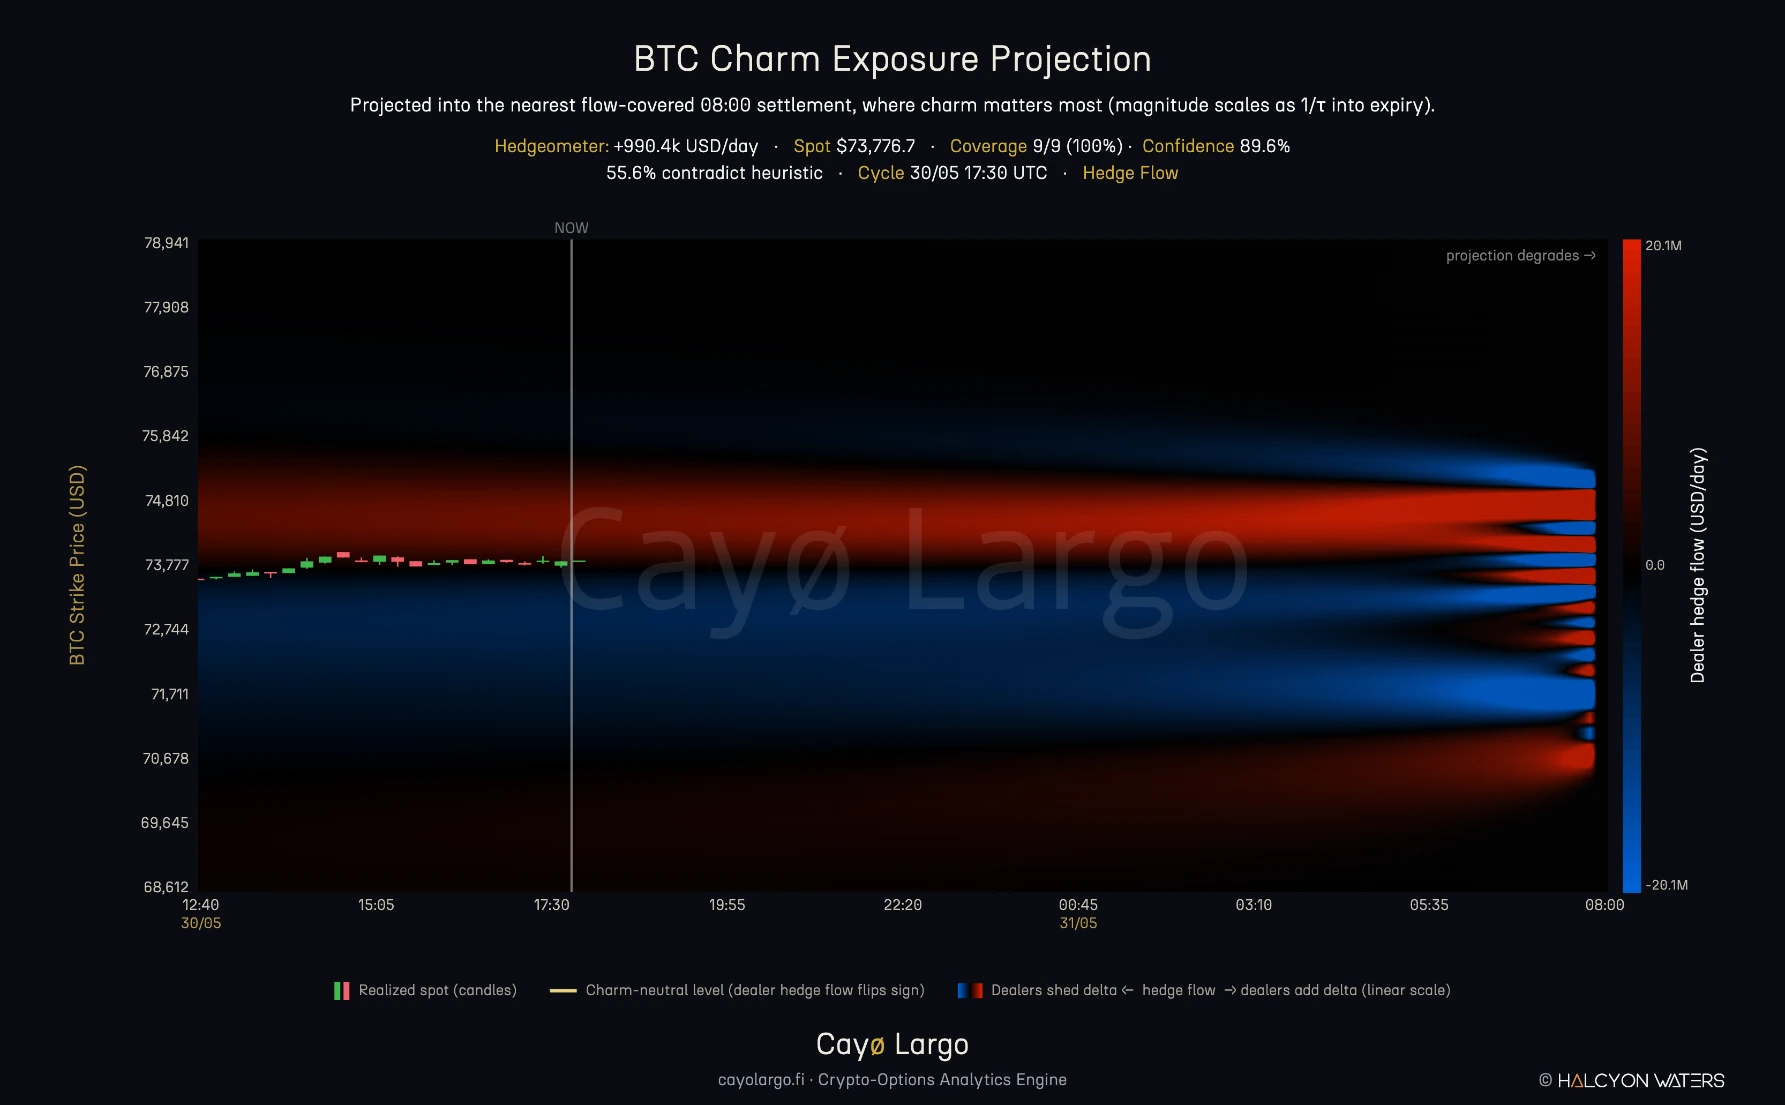
Figure 2: BTC Charm exposure, the hedge-flow view. Red is where the dealer book adds delta as time runs, blue where it reduces delta and the flip between them, the Charm-neutral level, sits near spot. Left of the NOW line are the realized spot candles; to the right the smooth bands run forward and then break into per-strike lobes as they reach the 08:00 settlement, the visible 1/τ concentration of Charm into expiry.
Because Charm collapses near expiry, the map keys to the nearest flow-covered expiry and projects the forward axis all the way into it. The per-strike fragmentation at the right edge is not noise. It is the profile width shrinking to a single strike as goes to zero, the exact regime a desk cares about and the one most maps crop off.
Gamma: the Price Channel
Gamma is the rate of change of delta as spot moves, . It is the fast, intraday driver and it has the cleanest dealer reading of the three.
Gamma is a second derivative in , so the dollar form, net Gamma exposure or GEX, carries an extra power of spot and a per-one-percent convention:
The factor is the difference from Charm: one converts Gamma to dollar-delta-per-percent, the second scales the percent move into dollars. The sign convention is the familiar one. Positive net Gamma means dealers are long Gamma. They trade against moves, dampening volatility and pinning price toward the heavy strikes. Negative net Gamma means dealers are short Gamma. They trade with moves, amplifying them.
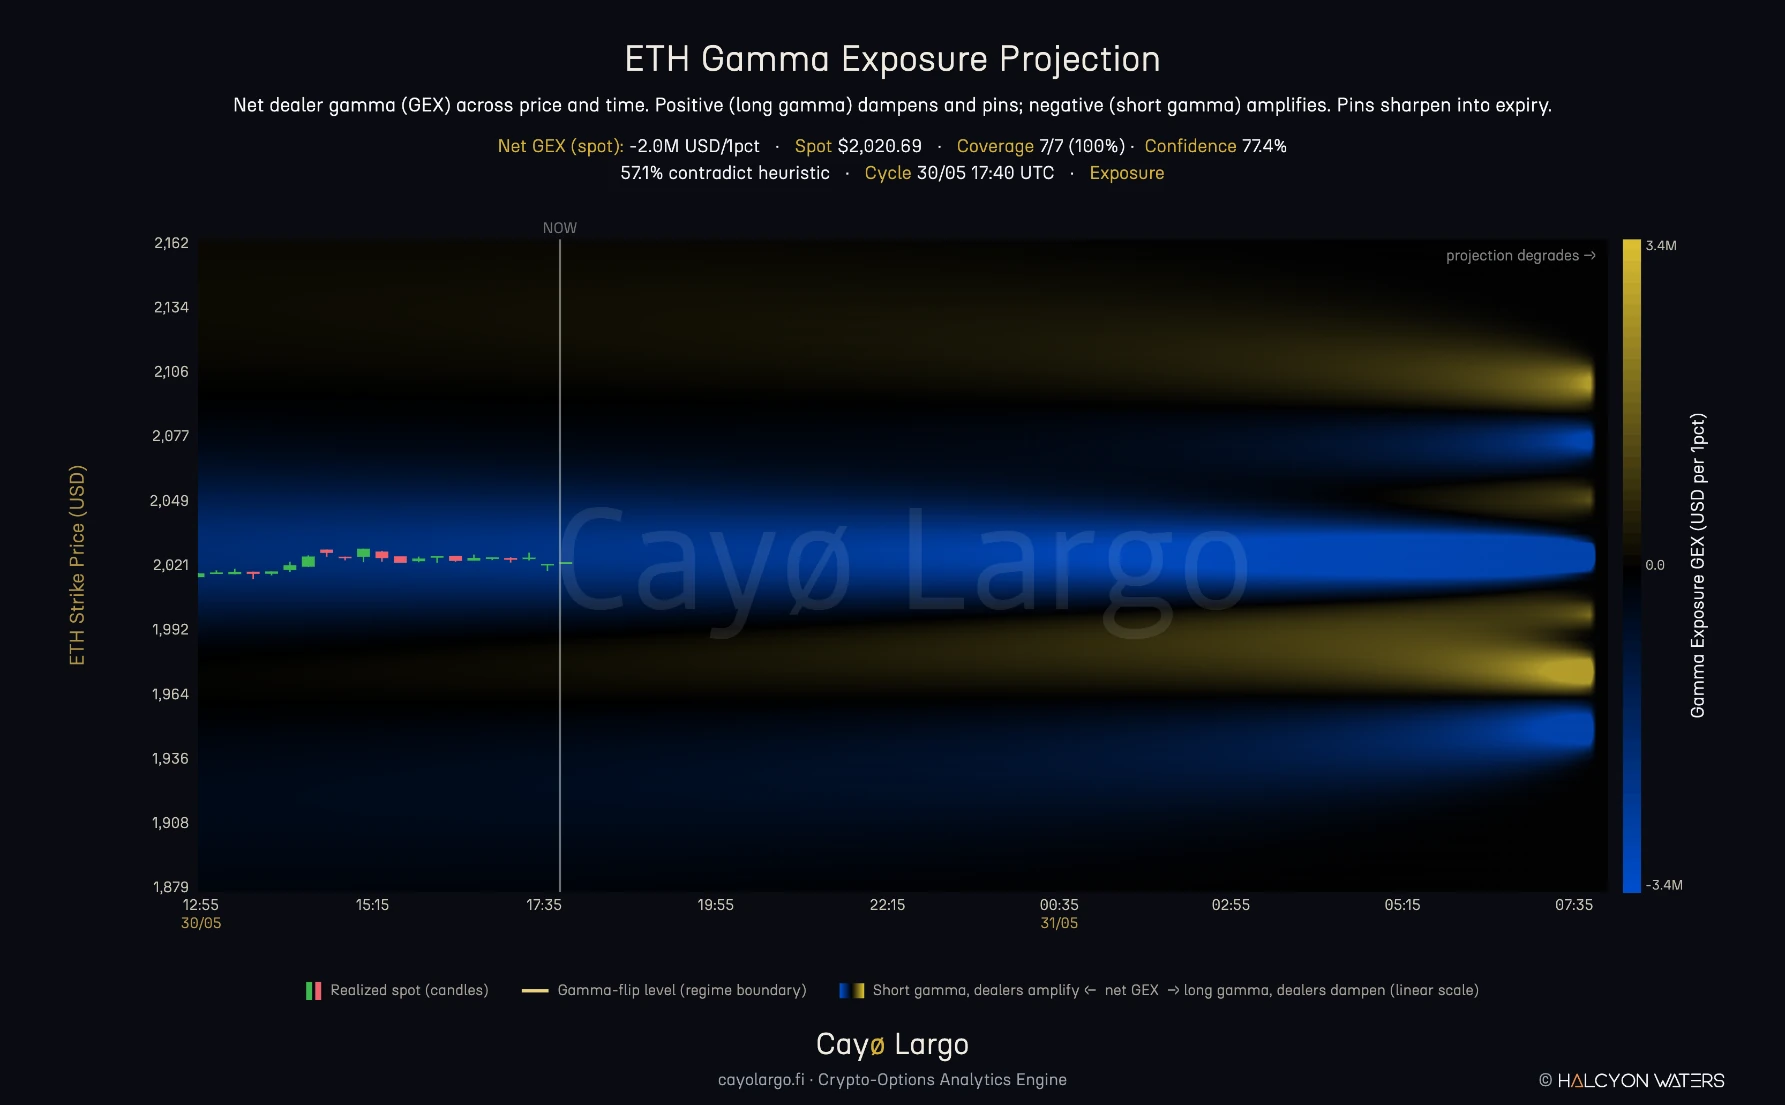
Figure 3: ETH Gamma exposure, a net short-Gamma snapshot. The blue band around spot is short Gamma, where dealer hedging feeds the move instead of fighting it. The gold pockets above and below are long Gamma, where dealers dampen and pin and they sharpen into per-strike lobes at the right edge, the same 1/τ effect. Net GEX at spot is negative here, so the centre amplifies rather than holds.
Gamma is the one Greek we can independently verify. The same , aggregated through this dollar formula, must reproduce the precomputed GEX our separate pipeline writes per strike. We reconciled the two and they agree to within a fraction of a percent, the residual explained by the implied-vol source. That separate pipeline is what draws the GEX Landscape, where the same per-strike numbers are plotted live for all six coins. A published validation is rare; we ran one, because the maths should check out before the picture is trusted.
Vanna: the Volatility Channel
Vanna is the rate of change of delta as implied vol moves, . It is the hidden hedging channel, the one that drives the rally or selloff after a volatility spike resolves.
The dollar delta-shift for a vol move of (in decimal) is first order in , like Charm:
The two delta symbols pair up. The lowercase marks a change, so the line reads plainly, a move in implied vol produces a matching shift in the dealer's dollar delta at strike . The uppercase delta term is that dollar delta itself, with the superscript dollar sign marking the units and the strike.
Vanna forces a design decision that most vendors' heatmaps skip. The field is exactly linear in the vol move: . So draw Vanna for a fixed shock, auto-scale the colours and a five-point move and a ten-point move render identically. A percentile-normalised diverging colormap cannot show a uniform scaling. The spatial pattern is shift-invariant; only the magnitude scales.
Our resolution is to split the intrinsic Greek from the scenario you ask of it. The readout reports Vanna per one vol point, , the shift-free quantity that does not depend on how large a move you imagine. There is no zero button, because zero vol move is a flat map, the trivial centre of a linear family, with nothing to look at. The heatmap then shows the delta change for the move you actually select, namely Vanna per vol point times the number of points. The colour scale is pinned to the largest shift on offer. So the map still breathes. A bigger move fills the frame, an opposite move inverts the colours and through all of it the headline number stays the clean per-vol-point Greek.
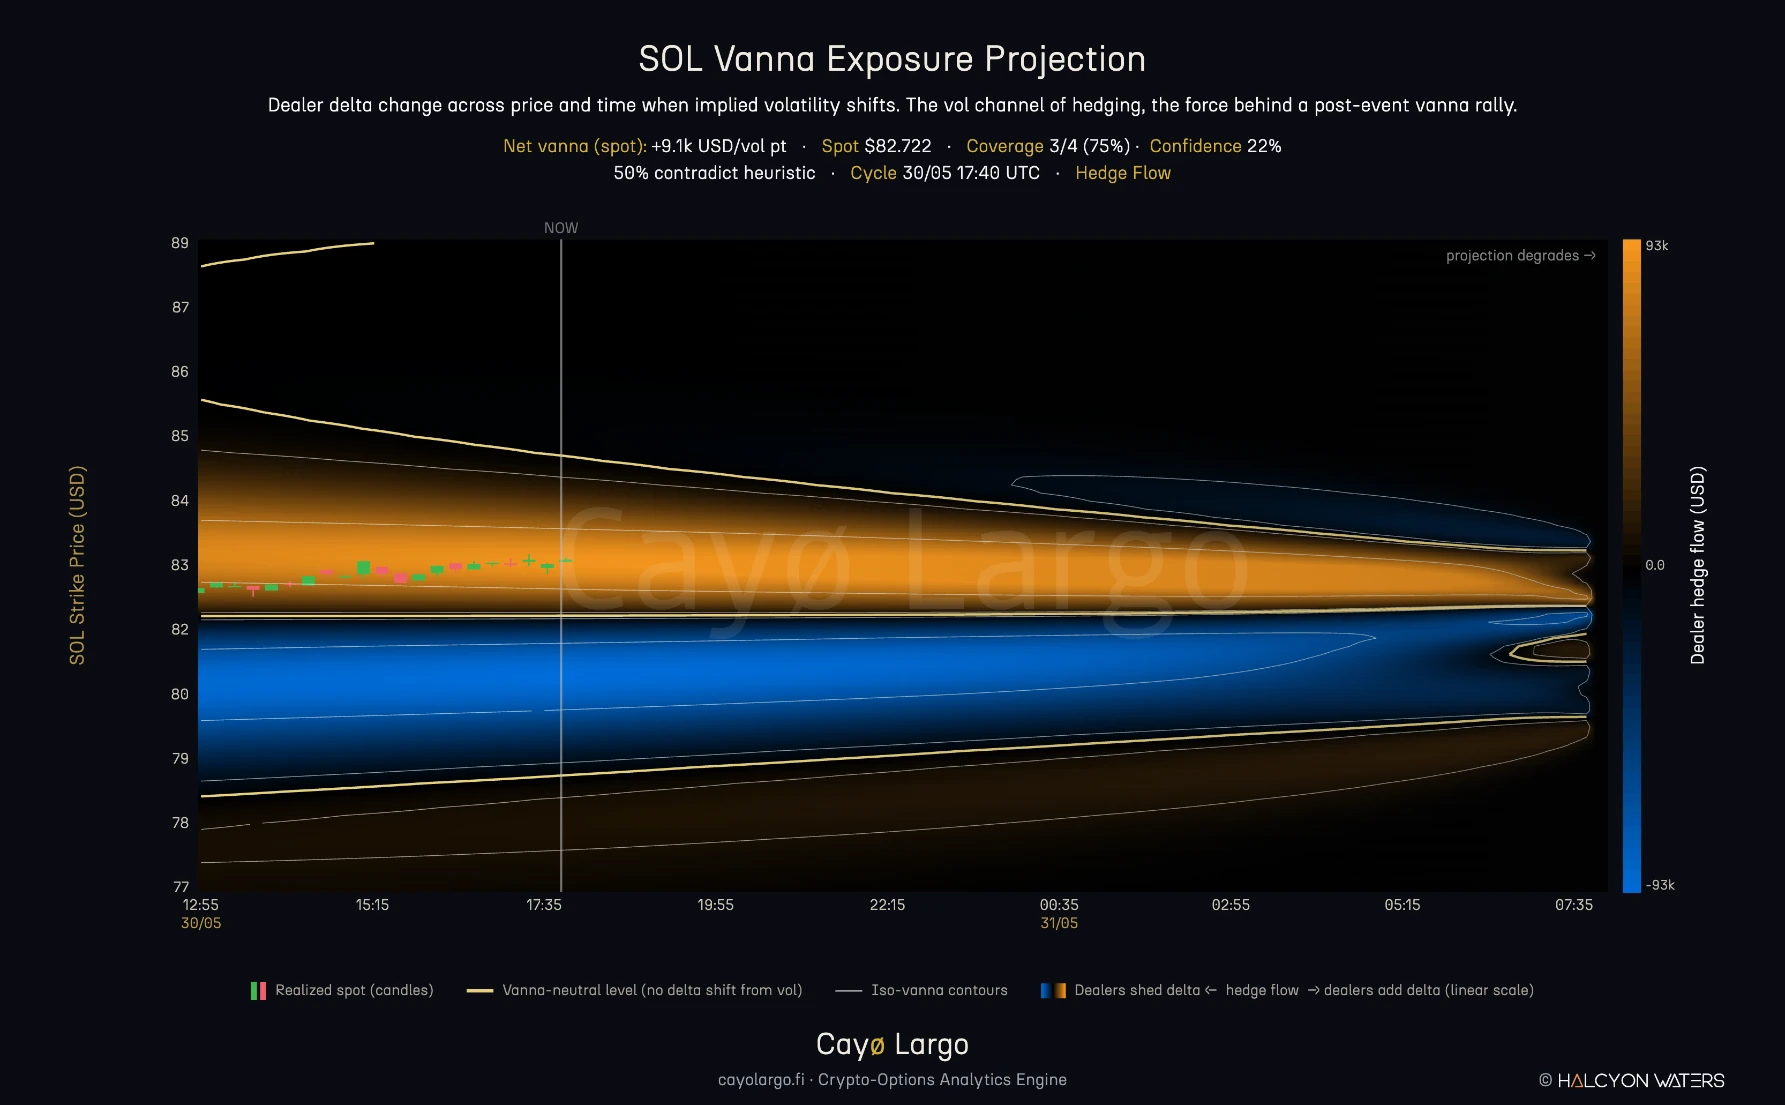
Figure 4: SOL Vanna exposure. Orange marks where the dealer book adds delta when implied vol rises by the selected amount, blue where it reduces delta. The gold Vanna-neutral level threading between them is where a vol move shifts no delta at all and the faint contours are lines of equal Vanna. This is the vol channel of hedging, the force behind a post-event Vanna rally when an IV crush on a book of downside puts pushes dealers to re-hedge in one direction.
Why This Trio and Not Speed, Color or Zomma
This is the question that separates a methodology from a Greek zoo. The answer is a single differential.
The quantity a dealer must hedge is their delta, . As the world moves, delta changes and its total differential decomposes exactly into three terms:
Charm, Gamma and Vanna are the three partial derivatives of delta, against time, price and vol. They are not a selection from a menu; they are the complete first-order hedging vector. Any change in dealer delta, the thing the heatmap exists to show, is one of these three channels.
Speed, Color and Zomma are a different order entirely. They are derivatives of Gamma:
That is, the second derivatives of delta. They describe how Gamma itself moves, which is a refinement of the price channel, not an independent channel. A desk hedging delta watches Charm, Gamma and Vanna. The higher-order trio matters for managing the Gamma hedge, the convexity of the convexity, not for the primary delta map. Putting Speed on a dealer-exposure heatmap would be drawing a correction to one axis as if it were a fourth axis. We treat those Greeks where they belong, in the higher-order ratio work and keep the projection panel to the three that close the differential.
Crypto Adaptations
The textbook Greek formulas are written for equity-index options and the crypto departures have mostly surfaced already. No dividend makes call Charm equal put Charm. The Deribit forward carries a non-zero funding rate, which we keep rather than drop. The map projects into the 08:00 UTC expiry and Gamma carries an extra power of spot. The one detail not yet spelled out is where that rate sits. We keep it in the drift, using the forward-carry instead of dropping it and that single choice tightens the Gamma reconciliation from a few percent to under one.
The Projection and Its Honest Limits
A method is only as trustworthy as the limits it admits and the projection has real ones. Every column to the right of NOW rests on assumptions that fail in known ways. Name them plainly, or the picture implies more than it knows.
The book is frozen. The map assumes the positioning at time is the positioning right now. On a fast tape that is stale within the hour. The vol surface is frozen with it. Charm and Gamma are computed holding fixed, even though implied vol moves with spot and that feedback is exactly the channel the Vanna map exists to show. Each cell also teleports rather than travels. It assumes spot is instantly at and ignores the route price took to get there and the route is what determines what actually got re-hedged. Above all of these, the sign can be wrong. If a strike falls back to the heuristic tier, a whole cluster can come out the wrong colour. That single failure does more damage than the rest combined. It is why we sign positions-up and flag the coverage. And no single Greek tells the whole story. Charm read alone, cut off from Gamma and Vanna acting in the same instant, mis-states the true hedging vector. The selector exists to read the three together, never one in place of another.
The panel wears two of these limits on its face. A gentle projection-degrades fade darkens the field from the NOW line out to the right edge, the frozen book visibly weakening as it reaches toward expiry. And the colours carry a direction-versus-magnitude caveat. The magnitude comes from implied vol and open interest and it is real. The direction comes from the per-strike sign and it is only as good as the flow behind it. Where the map is right, it shows the hedging pressure that would exist at each price into expiry. Where it is wrong, it has quietly become a price forecast, which it never was.
What This Build Adds
Most polished versions of this chart cover one index and stop at a single Greek. What is documented here goes further on purpose. It runs all three first-order channels off one engine, so you read the complete hedging vector instead of a single slice of it. It signs the book per strike from real flow, in a market where most dashboards cannot sign it at all. It handles Vanna honestly. The intrinsic per-vol-point surface is held apart from the scenario you size on top of it, rather than letting a linear quantity vanish inside an auto-scaled colormap. It checks itself, reconciling Gamma against a separate GEX pipeline to under a percent, a validation almost nobody publishes. The maths stays crypto-native throughout, from zero-carry Charm and the forward-carry to the 08:00 ladder, the projection run into expiry and the scaling, all of it written down here. And it keeps its uncertainty in the open, through the projection fade, the direction-versus-magnitude split and the live coverage and confidence. The map reads as a model, never as an oracle.
The heatmap was never the hard part. The hard part is the sign. Then the maths behind each Greek and the honesty about where the picture breaks. That is what this note set out to open and what the next one, on the positions-up detail behind the colours, will open further.
Frequently Asked Questions
What is a dealer Greek exposure projection heatmap?
It is a two-dimensional scan of one aggregated dealer Greek over a grid of hypothetical spot prices (the y-axis) and forward time (the x-axis). Each cell answers a what-if: if spot sat at price S at future time t, this is the net dealer hedging pressure the option book would carry. The left of the NOW line is the realized spot path; the right is a projection from the current book to the nearest expiry. It is a field, scanned, not a forecast of price.
How is Charm exposure calculated for crypto options?
Charm is the time derivative of delta. With no dividend on crypto, call Charm equals put Charm, so option type drops out. The per-contract Charm is n(d1) times the quantity d2 over 2 tau minus r over sigma root tau, where r is a single flat funding rate implied by the Deribit forward, in the 3 to 7 percent range rather than zero. Each contract is multiplied by the dealer sign, open interest, contract size and spot to express it in dollar-delta-decay per day, then summed across the chain and divided by 365. The result is the net delta the dealer book adds or reduces per day purely from time passing.
What is the difference between Charm, Gamma and Vanna maps?
They are the three first-order channels of dealer delta change. Charm is the time channel (delta change per unit time), Gamma is the price channel (delta change per unit spot move) and Vanna is the volatility channel (delta change per unit implied-vol move). Together they form the complete differential of dealer delta. The same projection engine produces all three; only the per-contract Greek and its dollar scaling differ.
Why use Charm, Gamma and Vanna but not Speed, Color or Zomma?
Charm, Gamma and Vanna are the three partial derivatives of delta, so they fully decompose the change in dealer delta that must be hedged. Speed, Color and Zomma are derivatives of Gamma, the second derivatives of delta. They describe how Gamma itself moves, a correction to the price channel, not an independent hedging channel. A desk hedging delta watches the first three; the higher-order trio matters for managing the Gamma hedge, not for the primary delta map.
Why is Vanna shown per vol point rather than for a fixed shock?
Vanna is linear in the implied-vol move, so a fixed shock only scales every value by the same factor and the spatial pattern is invariant. Showing Vanna per one vol point makes the map the intrinsic, shift-free quantity and a separate scenario sizes a what-if move in the readout. On the heatmap the selected move is drawn against a fixed colour scale, so a larger move fills the frame and an opposite move inverts the colours, while the headline stays the per-vol-point Greek.
Where do dealer-positioning heatmaps go wrong?
Five places. Frozen open interest, the map assumes today's positioning survives to expiry. A static vol surface, Charm is computed holding implied vol fixed. Teleport not path, each cell assumes spot is instantly at S. Sign guesswork, if the dealer sign is a heuristic the whole colour field can invert for a strike cluster, the single biggest error source. And single-Greek isolation, Charm read without Gamma and Vanna mis-states the true hedging vector. We surface these in the panel rather than hide them.
What is positions-up dealer signing in options flow?
Positions-up signing builds the dealer sign from the bottom up, from real order flow, rather than assuming it from a rule of thumb. Each trade is labelled by the side that crossed the bid-ask spread, the aggressor. That taker flow is accumulated per strike to tell whether dealers are net long or net short there. It matters because the sign decides the colour of a Greek exposure map and getting it wrong inverts an entire strike cluster. Most crypto dashboards cannot sign the book at all, which is why this step is the edge.
Related Articles
Why BTC Delta Decays Fastest at Expiry: The Charm Ridge
Charm, the delta-decay Greek, blows up at the money as expiry nears. On Deribit it prints a bright ridge that sweeps onto every BTC 08:00 settlement.
Why Hedging Gamma and Vega Separately Overhedges Your Book
Speed/Gamma and Veta/Vega trace a parabola under Black-Scholes. Gamma curvature and vega decay are coupled. Hedging them independently means over-hedging.
Gammega at +3.5σ: When Spot and IV Pull Apart
BTC Gammega hit +3.5σ over 30 hours as spot rallied and IV fell. Fourth-order stress invisible to standard dashboards. Gamma exploded 30 hours later.
Why Knowing Your Greeks Won't Save You on Deribit
You learned Delta, Gamma, Theta. You can explain Black-Scholes over coffee. Then you open Deribit's options page and none of it helps. Here's why options theory breaks down on a live screen.