Why BTC Delta Decays Fastest at Expiry: The Charm Ridge
Charm, the delta-decay Greek, blows up at the money as expiry nears. On Deribit it prints a bright ridge that sweeps onto every BTC 08:00 settlement.
This is an observation note from Cayo Lab, not a tutorial. It assumes Black-Scholes delta, the idea of a Greek as a sensitivity and that charm is the time derivative of delta. The pattern it describes is known to options desks. What is uncommon is seeing it, as a repeating structure, in volume-filtered traded charm on crypto's daily expiry schedule.
The Pattern and the Claim
Bitcoin leaks a bright diagonal into every settlement. Not a wall on the expiry line, a ridge that leans forward of it, brightest near spot and sweeps downward as the clock runs out.
Take every option that traded, keep the strikes and timestamps where real volume changed hands and colour each cell by traded volume times the average charm, namely the rate at which delta drifts with time. Strike climbs the page, calendar time runs across it. Do this for BTC on Deribit and a structure repeats once a day. In the last hours before each 08:00 UTC settlement a narrow band lights up around the money. It then arcs downward onto the expiry line, tracing spot as it falls. The two blue arrows in the figure mark the front contract's ridge collapsing onto the 6 July fix.
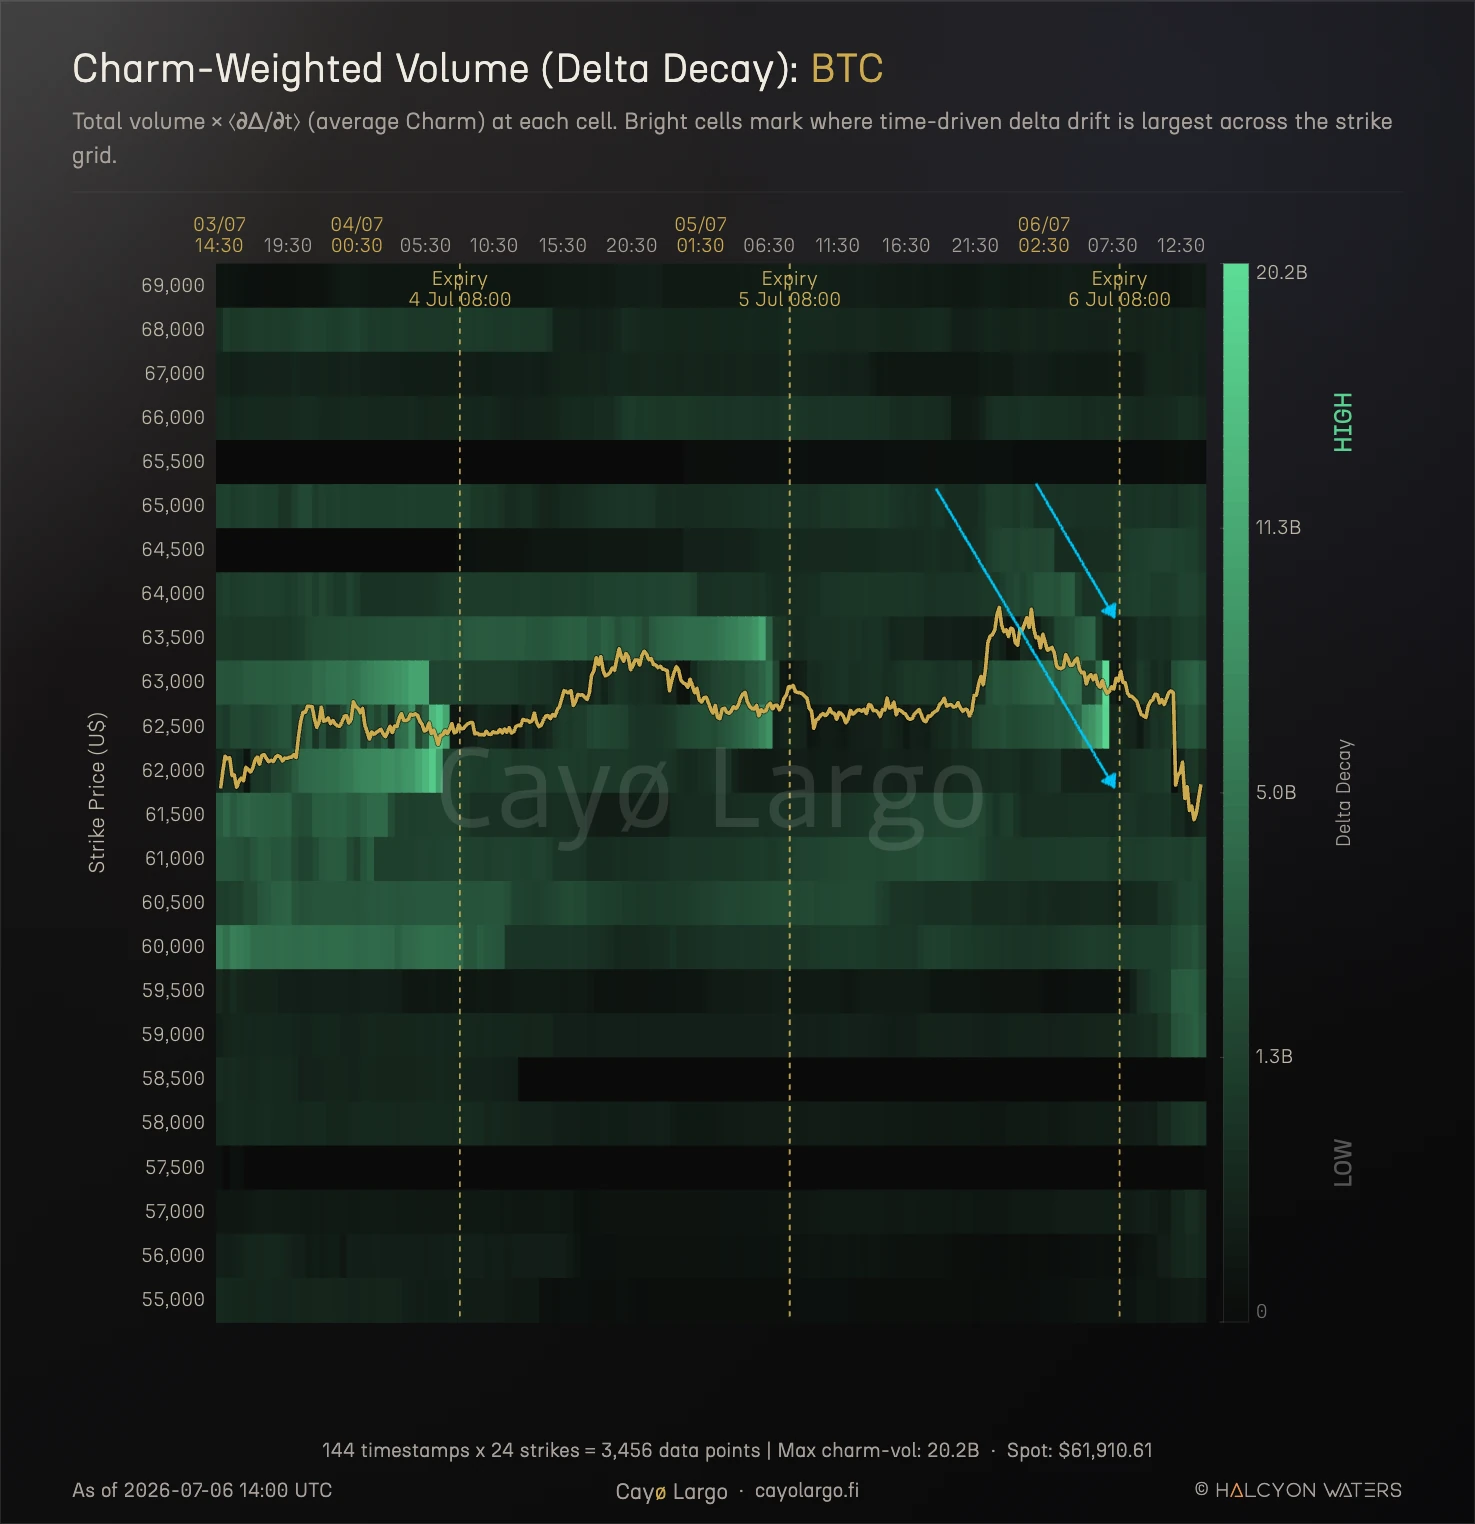
Figure 1: BTC charm-weighted volume. Traded volume times average charm, only where volume changed hands, strike up the page and time across it. Ahead of each dashed expiry line a narrow ridge fires near the money and curves down onto the 08:00 settlement. The yellow track is spot and the ridge follows it. Max charm-vol 20.2B at the terminal cell. Read it as a field, not a forecast.
The claim is narrow. The mechanism is not new and this note says so twice. The observation is narrower: a known piece of options theory, the way charm behaves as time to expiry collapses, leaves a clean periodic signature once you stop smoothing and plot only what traded. Below we show the ridge, derive why it has to be there, then prove it belongs to the front contract rather than to our own aggregation. Everything below drives a live tool, our thermography panel in its charm mode and the figures are screenshots of it.
What the Panel Measures
Most Greek tools show a single-instant profile, one Greek against strike for one maturity, or a fitted dealer-exposure surface interpolated across the chain. Both hide the thing in Figure 1. The profile is one slice in time. The fitted surface averages the traded prints into a smooth sheet and that averaging is exactly what erases the terminal ridge.
Anyone who has hunted a periodic signal in a noisy lightcurve knows the temptation. Smooth it and the noise goes. So does the thing you came for.
The panel does neither. Each cell is total volume-filtered volume times the average magnitude of charm at that strike and time. A cell is dark unless options there actually traded and where they did the colour carries how hard delta was drifting for the clock alone. No fitting, no interpolation, no fill. That matters because the ridge lives in a thin band that a smoothing step would blur into the calm grid around it. By refusing to smooth, the panel lets the terminal band speak.
Why Charm Explodes at the Money
The cause is mechanical. Ignoring rates, which is fine for a crypto forward, the near-money charm term is
For a strike a fixed distance from spot, as remaining life , so the density dies exponentially and deep away-from-money charm goes to zero. But for strikes hugging spot, , and the factor takes over,
So the last hours before 08:00 build a tall, narrow charm spike pinned to the money and near-zero charm everywhere else on that expiry's strikes. A book that is delta-flat now is off-hedge in an hour purely because the clock moved. The closer to settlement, the faster that drift. That is the engine of the ridge.
Why the Ridge Descends
A wall would be a vertical band of hot color sitting on the expiry line. Figure 1 shows a ridge that leans ahead of the line and slopes down onto it. The slope comes from where the peak sits and where spot went.
| • | The peak tracks spot. Charm crests a shrinking fraction of $\sigma\sqrt{\tau}$ off exact at-the-money, at the zero of $d_2$ and that offset closes onto spot as $\tau \to 0$. The ridge converges onto the price line right at expiry, so wherever spot is, that is where the band burns brightest. |
| • | Spot fell into the fix. BTC rolled from roughly 63.5k down to 62k across the final hours before the 6 July settlement. Because the ridge rides spot, it falls with it, which turns a would-be vertical band into a bright diagonal sweeping downward, the leaf shape the arrows trace. |
| • | The front contract owns it. Terminal charm is a $1/\sqrt{\tau}$ effect, so the nearest expiry dominates the ridge by a wide margin while longer-dated strikes stay calm. The descending band should be almost entirely the 6 July contract, which is the first thing to confirm by decomposition before reading anything into it. |
Stack those and the bright contour is no longer vertical. It leads with the clock, rides spot and closes onto the line, the same shape every day because the same clock drives it.
Confirming the Front Contract Owns It
A ridge is only worth a second look once you know it is the near expiry. Longer-dated strikes pooled onto one strike axis would draw the same picture for the wrong reason. We split the cell metric by expiry, straight from the trade tape joined to the Greeks table, across the six hours into the 6 July fix. In the near-money band, within two percent of spot, the front contract carries 96.7% of the charm-weighted volume. Everything dated later carries 3.3%. The ridge is the front contract, with room to spare.
Widen from the money to all strikes and track it by the hour and the same picture builds. Front-expiry charm-vol climbs from the low thousands six hours out to the high tens of thousands in the last hour. The back book stays flat near the floor and its share settles above 97% through the final three hours into the fix.
| Window into the 06 Jul 08:00 fix | Front charm-vol | Back charm-vol | Front share |
|---|---|---|---|
| 6h out, 02:00 | 5,768 | 1,158 | 83% |
| 03:00 | 6,014 | 2,162 | 74% |
| 04:00 | 11,532 | 1,680 | 87% |
| 05:00 | 33,244 | 787 | 98% |
| 06:00 | 14,553 | 507 | 97% |
| into fix, 07:00 | 66,740 | 2,196 | 97% |
| All strikes, full 6h | 137,851 | 8,490 | 94% |
Table 1: Per-hour charm-weighted volume into the 6 July fix, front expiry against everything dated later, from deribit_options_trades joined to the 37-Greeks table. Numbers are raw contract volume times absolute charm, a different normalization than the panel's display scale, so read the shares and the ramp, not the absolute against Figure 1. The front bucket is any expiry within a day of the cycle. The lumpiness, the 05:00 and 07:00 bursts, is trade flow printing in clumps every ten minutes, not structure.
That closes the attribution honestly. The descending band is the 6 July contract decaying into its own settlement, not an aggregation artifact.
Nothing here is precomputed or smoothed. The query behind Table 1 runs straight against the live tables, join the trade tape to the Greeks, weight each print by charm, split by expiry, bucket by hour. Expand it to see exactly how the numbers come off the data.
-- Table 1: charm-weighted volume into the 06 Jul 08:00 fix, front vs later expiry.
-- deribit_options_trades joined to the 37-Greeks table. BTC, terminal 6 hours.

WITH bounds AS (
    SELECT 'BTC'::TEXT                          AS coin,
           TIMESTAMPTZ '2026-07-06 08:00:00+00' AS front_fix,
           TIMESTAMPTZ '2026-07-06 02:00:00+00' AS win_start,   -- front_fix - 6h
           TIMESTAMPTZ '2026-07-06 08:00:00+00' AS win_end
),

-- Contracts that actually printed, per instrument per 10-min cycle.
trade_vol AS (
    SELECT t._timestamp, t.instrument_name, SUM(t.amount) AS volume
    FROM deribit_options_trades t, bounds b
    WHERE t.coin = b.coin
      AND t._timestamp >= b.win_start
      AND t._timestamp <  b.win_end
    GROUP BY t._timestamp, t.instrument_name
),

-- Attach per-instrument charm, parse the expiry date out of the name.
cells AS (
    SELECT tv._timestamp,
           to_date(split_part(tv.instrument_name, '-', 2), 'DDMONYY') AS expiry,
           tv.volume * ABS(g.charm) AS charm_vol
    FROM trade_vol tv
    JOIN bounds b ON TRUE
    JOIN deribit_options_blackscholes_greeks g
      ON g.instrument_name = tv.instrument_name
     AND g._timestamp      = tv._timestamp
     AND g.coin            = b.coin
     AND g._timestamp     >= b.win_start
     AND g._timestamp     <  b.win_end
    WHERE g.charm IS NOT NULL
)

SELECT date_trunc('hour', c._timestamp)                     AS hour_utc,
       CASE WHEN c.expiry <= (c._timestamp::DATE + 1)
            THEN 'front' ELSE 'back' END                    AS bucket,
       ROUND(SUM(c.charm_vol)::NUMERIC, 0)                  AS charm_vol
FROM cells c
GROUP BY hour_utc, bucket
ORDER BY hour_utc, bucket;What Magnitude Keeps and What It Drops
The panel plots volume times the magnitude of charm, so the map answers one question cleanly, where is delta drifting hardest and that is the right default. Charm flips sign across the money, so had the panel averaged signed charm at a strike, call and put contributions could partly cancel and smear the peak. Taking the magnitude keeps the ridge sharp. The cost is that the map cannot say which way delta is drifting, only how much, so it is a stress map and not a direction.
Two things travel with the picture so it is not oversold. The ridge is traded, not modeled, so a thin terminal band carries the conviction of the size that printed there, not deep liquidity. And the flare is decay plus flow. Part of it is pure terminal charm, part of it expiring-strike volume piling onto the money into the fix: closing trades, delta hedging, pin-related activity. The two multiply rather than average, which is why the terminal cell dwarfs the calm inter-expiry stretches.
Crypto Adaptations
The physics is general. Crypto sharpens the cadence. Deribit settles daily at 08:00 UTC, so the ridge is not a monthly event but a daily train you see one of before every fix. The market never closes either. No overnight gap breaks the ridge into disconnected sessions, so it runs in continuous time and lands on the same clock each morning. The same terminal-time delta decay equities reveal once a month, on a chart cut by overnight gaps, crypto reveals every day and unbroken.
Known Mechanism, Rare View
None of this is news to a desk. Charm blows up at the money into expiry, the effect is a asymptotic written down long ago and any short-dated book lives with it. The honest framing is that the mechanism is expected and the view is rare. A fitted exposure surface would show a milder version of the same ridge, which is the point. The contribution here is the lens. Plot volume-filtered traded charm across strike and calendar time and a textbook asymptotic turns into a picture you can point at, a periodic ridge sweeping down onto every settlement.
The ridge was always in the data. Our work was refusing to average it away, riding spot instead of the strike axis and saying plainly that the map shows how hard delta drifts rather than where it is headed. That is what this note set out to show and what the live thermography panel keeps showing, one expiry at a time.
Frequently Asked Questions
What is charm in options?
Charm is the rate at which an option's delta changes as time passes, the derivative of delta with respect to time. A desk that is delta-hedged today will be off-hedge tomorrow purely because the clock moved and charm measures how much. It is largest near the money and it grows without bound as expiry approaches, which is why the last hours before a settlement are where delta drifts hardest.
What is the difference between charm and theta?
Theta is how fast an option's price decays with time, the erosion of premium a holder pays for. Charm is how fast its delta drifts with time, the erosion of a hedge. Theta tells you what the position bleeds each day. Charm tells you how far off your delta will sit tomorrow if nothing else moves. Both are time derivatives and both concentrate near the money into expiry, which is why the terminal ridge shows up whichever one you weight the volume by. A short-dated book watches theta for carry and charm for the size of the next rehedge.
Why does charm blow up near expiry?
For a strike sitting near spot the standard-normal density stays close to its peak while the time factor in the denominator collapses toward zero. The near-at-the-money charm scales like one over the square root of remaining life, so it climbs toward infinity as the clock runs to settlement. Away from the money the density dies exponentially and charm goes the other way, toward zero, so the blow-up is a narrow spike pinned to the money, not a broad lift.
What is a charm-weighted volume heatmap?
It is a heatmap where each cell is total traded volume multiplied by the average magnitude of charm at that strike and time. Strike runs up the page, calendar time runs across it. Bright cells mark where time-driven delta drift is largest and where capital actually sat, so it reads as a map of where the book has to rehedge for the clock alone, not a fitted or smoothed surface.
Why does the charm ridge slope downward into the expiry line?
The peak of charm sits a shrinking fraction of a volatility-scaled step off exact at-the-money and that offset converges onto spot as remaining life goes to zero. So the ridge tracks spot. When spot falls into a settlement, as BTC did from roughly 63.5k to 62k ahead of the 6 July fix, the ridge falls with it and prints as a bright diagonal sweeping down onto the expiry line rather than a vertical wall.
Is the charm ridge a signal or expected structure?
It is expected structure and a validation that the pipeline resolves terminal-time behavior correctly. The blow-up is textbook to any desk that trades short-dated options. It becomes worth a second look only when the front-expiry contribution is confirmed by decomposition and read alongside the directional panels, since the magnitude map tells you how hard delta is drifting, not which way.
How is crypto charm different from equity charm near expiry?
The mechanism is identical, crypto just repeats it faster. Deribit settles daily at 08:00 UTC, so the ridge is a daily train rather than a monthly event and the 24/7 tape means there is no overnight gap to break the pattern into sessions. The same terminal-time delta decay equities show once a month, crypto shows every day and in continuous time.
Related Articles
Why Crypto IV Spikes Before Expiry: The Bow Shock
Why does crypto implied volatility spike before expiry? An IV Footprint heatmap shows a bow-shaped front flaring at the wings before each Deribit settlement.
Dealer Greek Exposure: GEX, Charm and Vanna, With the Maths
How dealer gamma exposure (GEX), charm and vanna are actually built, formula by formula and how the order-flow sign is set. Computed on live Deribit options data.
How to Read Gamma Exposure: Bitcoin GEX Live Case Study
BTC trades at $77,140 with $51 million in put open interest stacked at $76,000 and the gamma regime deep in negative territory. Expiry is 16 hours away. Here's how to read every chart on the GEX Landscape page and what each one tells you about what happens next.