Gammega at +3.5σ: When Spot and IV Pull Apart
BTC Gammega hit +3.5σ over 30 hours as spot rallied and IV fell. Fourth-order stress invisible to standard dashboards. Gamma exploded 30 hours later.
Price rallied. Volatility fell. Two forces moved in opposite directions at the same time. Neither alone would have bent the gamma surface this far.
Research Note RN-002 (May 24, 2026)
What We Observed
On May 23, 2026, we watched the 37-Greek heatmap on Cayo Largo's Greeks Tectonics panel turn up something unusual in the BTC ATM 8-30d cohort. Over the next 18 hours, a pattern emerged that no first-order dashboard would have flagged.
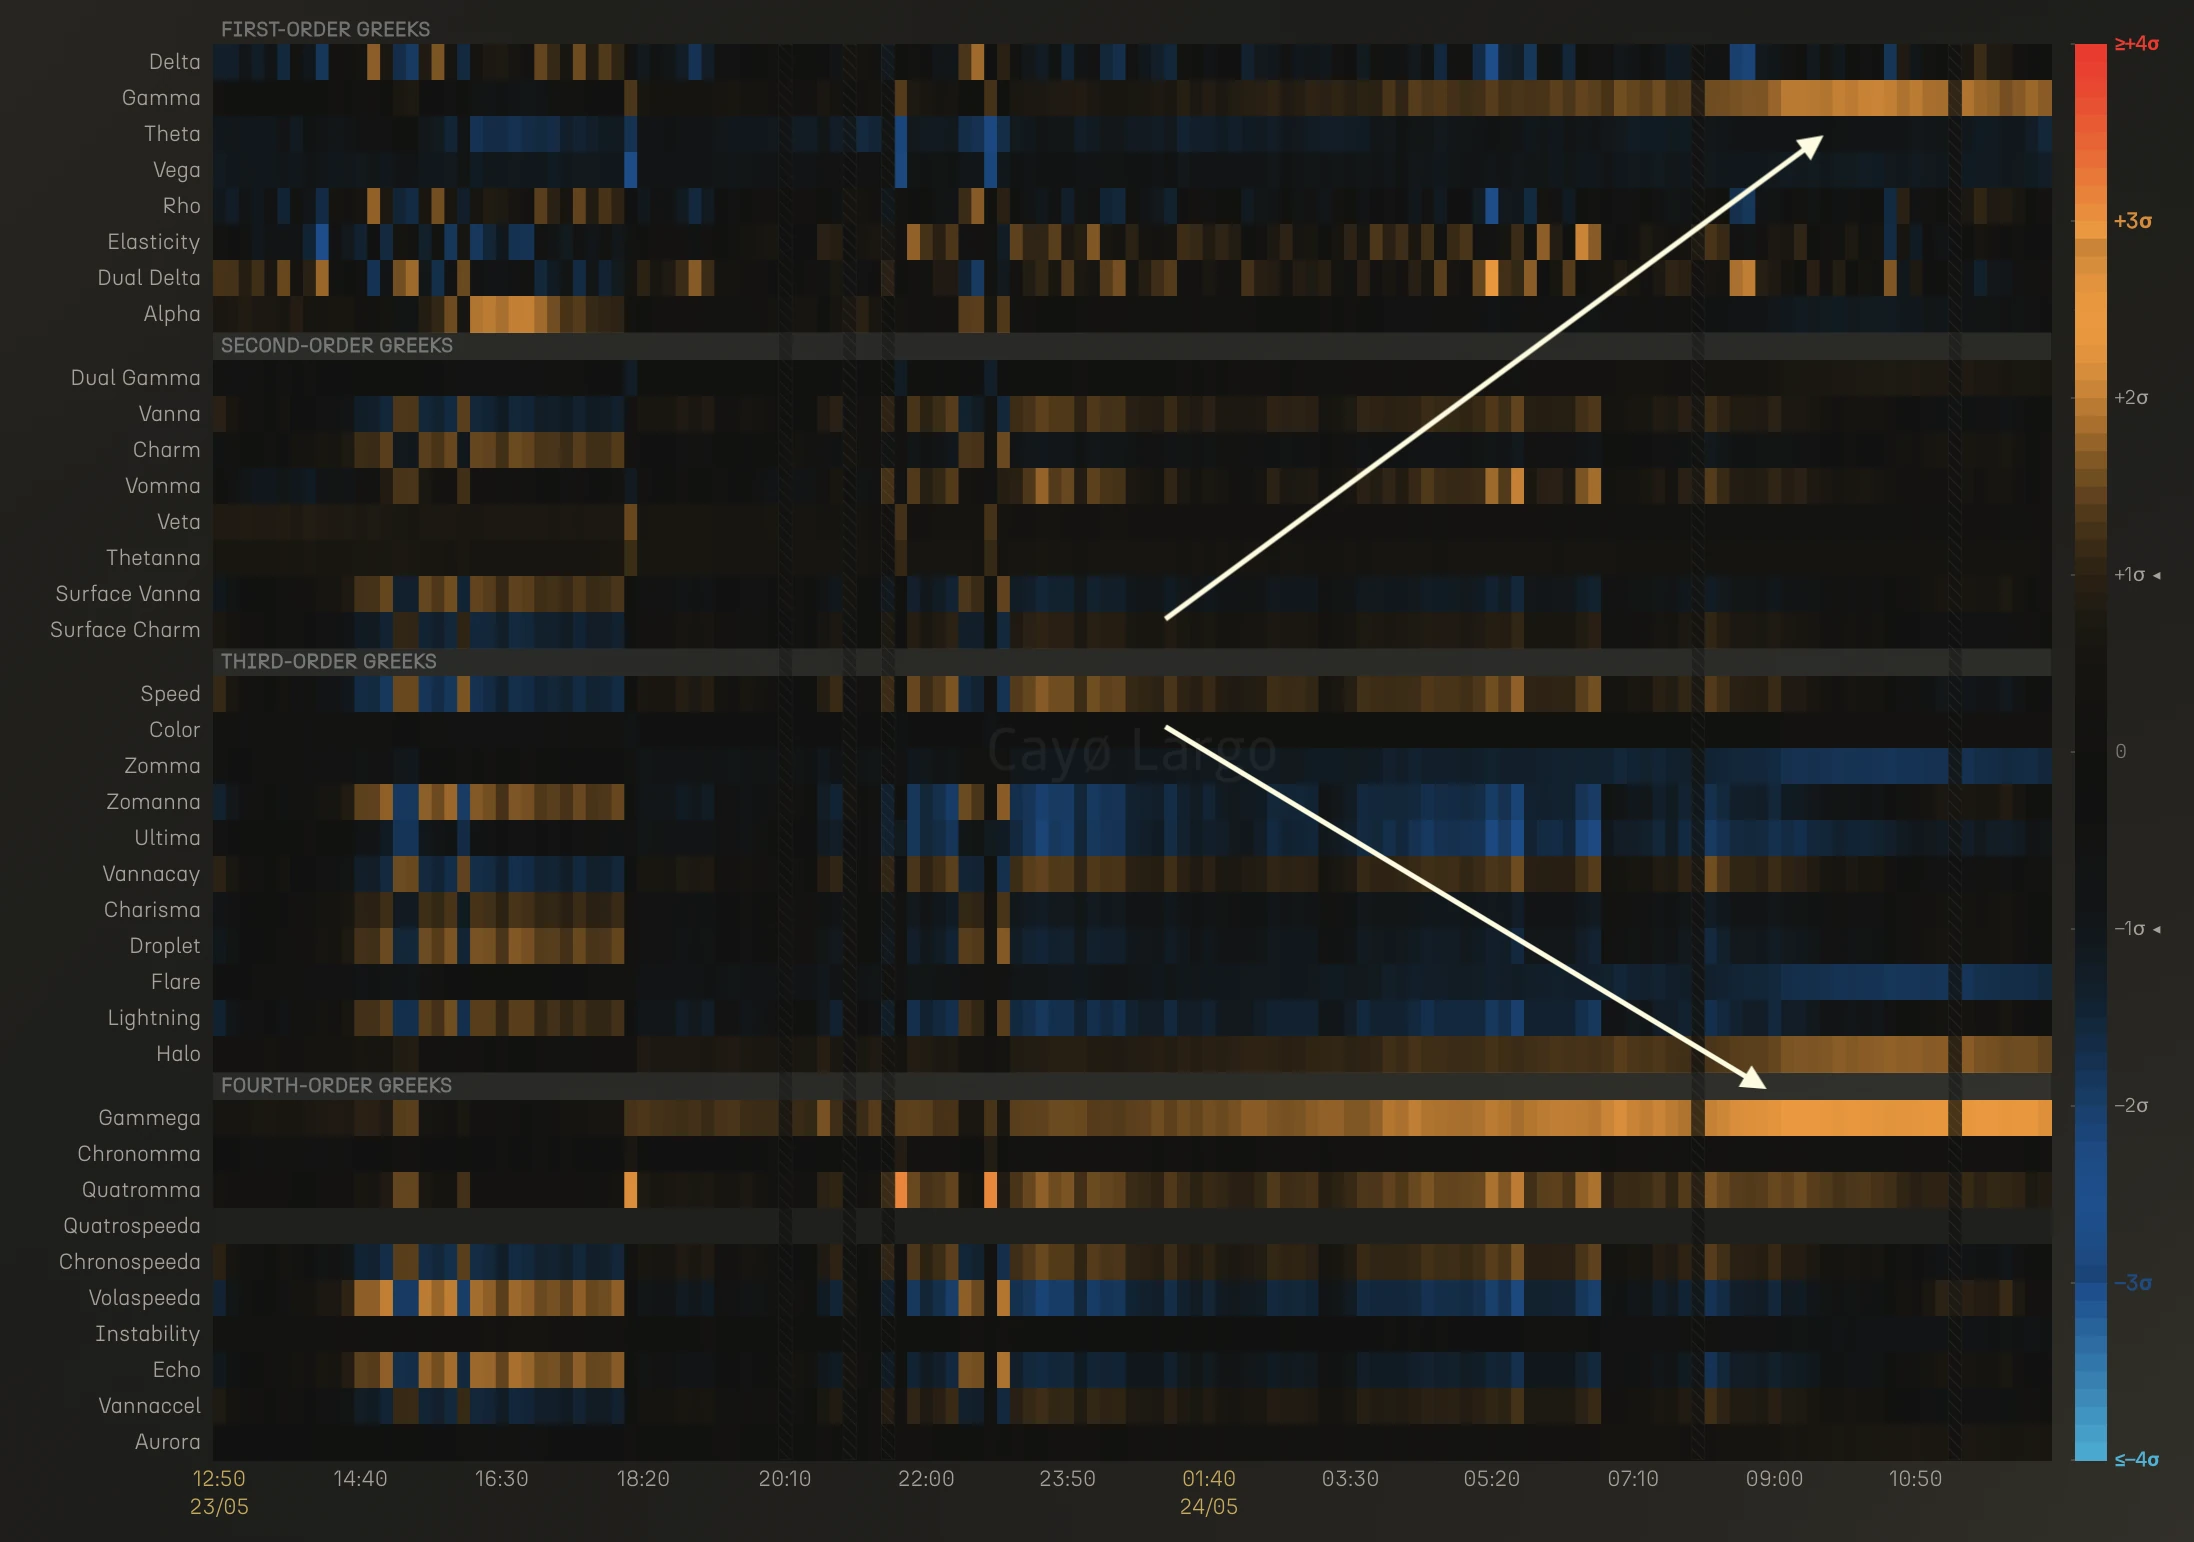
Figure 1: 37-Greek heatmap for BTC ATM 8-30d cohort, May 23 12:50 to May 24 11:00 UTC. Rows are Greeks ordered by derivative order (first through fourth). Colour encodes z-score intensity. Orange is positive, blue is negative. The white arrow traces the structural link between Gammega (fourth order, bottom) and Gamma (first order, top).
Gammega (), the fourth-order Greek in the bottom rows, began lighting up around 18:20 UTC on May 23. Five hours later, around 23:20 UTC, Gamma in the first-order rows started responding. Both intensified through the night, reaching peak activity around 09:00 UTC on May 24. The fourth order moved first and the first order followed.
That sequencing is the signal, because Gammega did not react to Gamma. Gammega led.
Seismologists live with the same ordering. The fast P-wave reaches the instrument before the slow wave that does the damage and the gap between them is the whole of an early-warning system. Structural stress in the fourth-order tier was building hours before it became visible in the first-order exposure that risk desks actually monitor.
The Gammega time-series chart below breaks this down into numbers.
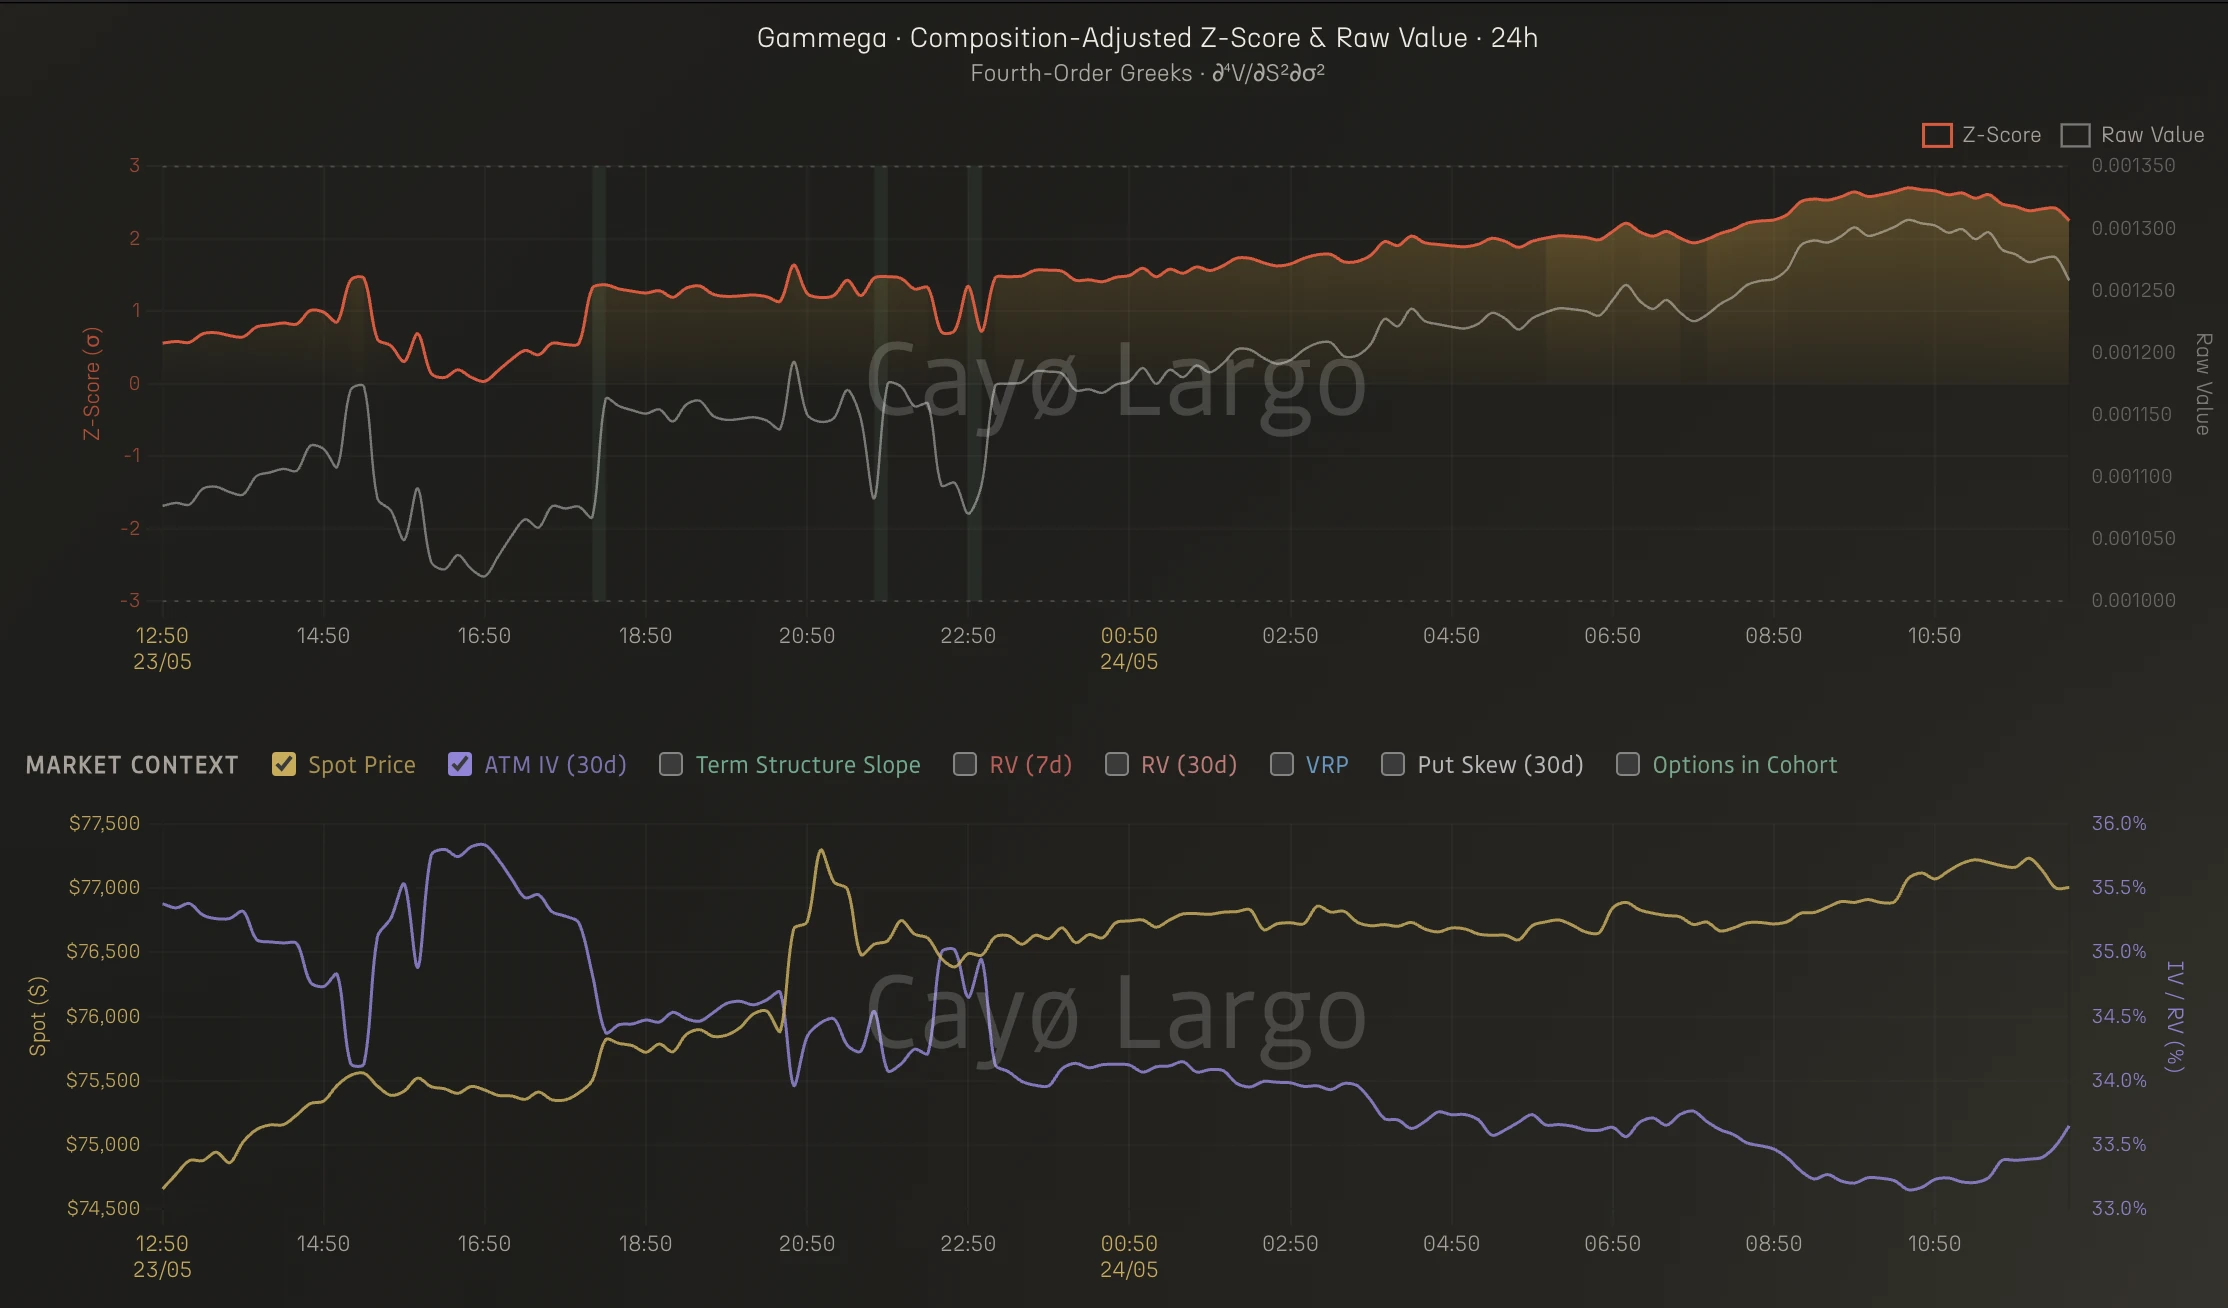
Figure 2: Top panel: Gammega composition-adjusted z-score (red, left axis) and raw value (white, right axis) for BTC ATM 8-30d cohort. Bottom panel: market context with spot price (purple, left axis) and ATM IV 30d (yellow, right axis). May 23 12:50 to May 24 11:00 UTC.
The bottom panel shows the market context. BTC spot (purple) rallied approximately $2,500 on Deribit, climbing steadily from $74,500 to $77,000. ATM IV 30d (yellow) was falling gently from a peak of 36% down to 33% levels. No vol shock, no skew dislocation and the surface was calm. The top panel shows what happened underneath, where Gammega's z-score (red) climbed from near-neutral to +2.5 over the same window.
Cayo Largo's z-scores for Greeks can be (above: they are) composition-adjusted, i.e. they remove the effect of changing numbers of options entering and leaving the cohort over time. For higher-order Greeks this correction is critical, because a shift in cohort membership can produce spurious z-score moves that have nothing to do with market structure. Over this 18-hour window the composition effect was negligible, meaning the Gammega signal was driven entirely by the market, not by options rolling in or out of the ATM 8-30d bucket.
The z-score's path matters. Crossing +1 around 18:50 UTC was the inflection, where cumulative gamma rebalancing and delta-hedging flow had become large enough to start bending gamma's vol-sensitivity. The plateau near +2 between 02:00 and 06:50 on May 24 was not a pause. The raw value kept climbing while the z-score caught its breath, so the structural deformation was still accumulating underneath it. The final push to +2.5 during the Asia-London crossover completed the propagation through the derivative chain.
A fourth-order Greek hitting +2.5 without a vol shock is rare enough that we went looking for a reason to distrust it. Under textbook conditions, Gammega activates when implied volatility moves fast. Here IV was drifting lower rather than spiking. But Gammega is , a cross-derivative living at the intersection of spot and vol. Spot was rallying $2,500 in one direction while IV fell 3 points in the other. Two forces pulled the gamma surface from opposite sides at the same time. The compound effect bent Gammega further than either force would have alone.
What Gammega Measures
Gammega is a fourth-order Black-Scholes Greek that sits at the intersection of two fundamental risk dimensions. Its formal definition:
Read that right to left. Start with gamma, the second derivative of option price with respect to spot, then differentiate twice with respect to implied volatility, which is DgammaDvol-squared in trader shorthand. Gammega tells you how stable gamma's vol-sensitivity is, not whether gamma moves but whether gamma's reaction to vol is itself predictable.
In practical terms, Gammega answers a specific question: if implied vol ticks up or down by one point, how much does my gamma's vol-sensitivity itself change?
Small Gammega means gamma behaves predictably across vol regimes and large Gammega means it does not: gamma's response to vol turns nonlinear and regime-dependent and your hedge ratios stop holding locally. This is gamma instability in the precise sense. Where the book sits relative to its flip level and whether dealers are damping or amplifying, is read off the GEX Landscape.
Gammega has teeth in the ATM 8-30d cohort, where the gamma peak is sharpest and gamma exposure is most concentrated. It fires hardest when spot and IV move in opposite directions, compounding through the cross-derivative. In crypto options markets, where BTC can rally 3% in 18 hours on a quiet week, this is not an edge case.
Why Gammega Fired and Its Neighbours Did Not
Let's have a closer look at Figure 1 again. Zomma went blue at the same moment Gamma went orange, around 23:20 UTC on May 23, settling around -1 to -2. Zomanna stayed mixed and calm, hovering near neutral. One order up, Gammega hit +2.5. Three Greeks in the same neighbourhood, three different responses. The formulae explain why:
Zomma is the first derivative of Gamma with respect to vol. Zomanna looks similar and measures something else, the first derivative of Vanna with respect to vol and the difference is against . Zomma tracks how the gamma surface bends with vol, Zomanna how the delta-vol coupling bends with it.
The rally bent the gamma surface (), which is why Zomma responded and the delta-vol surface () was never under the same stress, which is why Zomanna stayed flat.
Now recall that Gammega is one derivative above Zomma:
Zomma is the velocity of Gamma's vol-sensitivity and Gammega is the acceleration. Zomma displaced at a normal pace but the falling IV was accelerating that displacement per vol tick and Gammega is what captured it.
When spot and IV pull apart at a moderate pace for hours, first-order dashboards show two calm lines. The compound stress accumulates in the higher-order Greeks, four derivatives deep, where only Gammega can see it.
Aftermath
The structural stress from May 23 persisted.
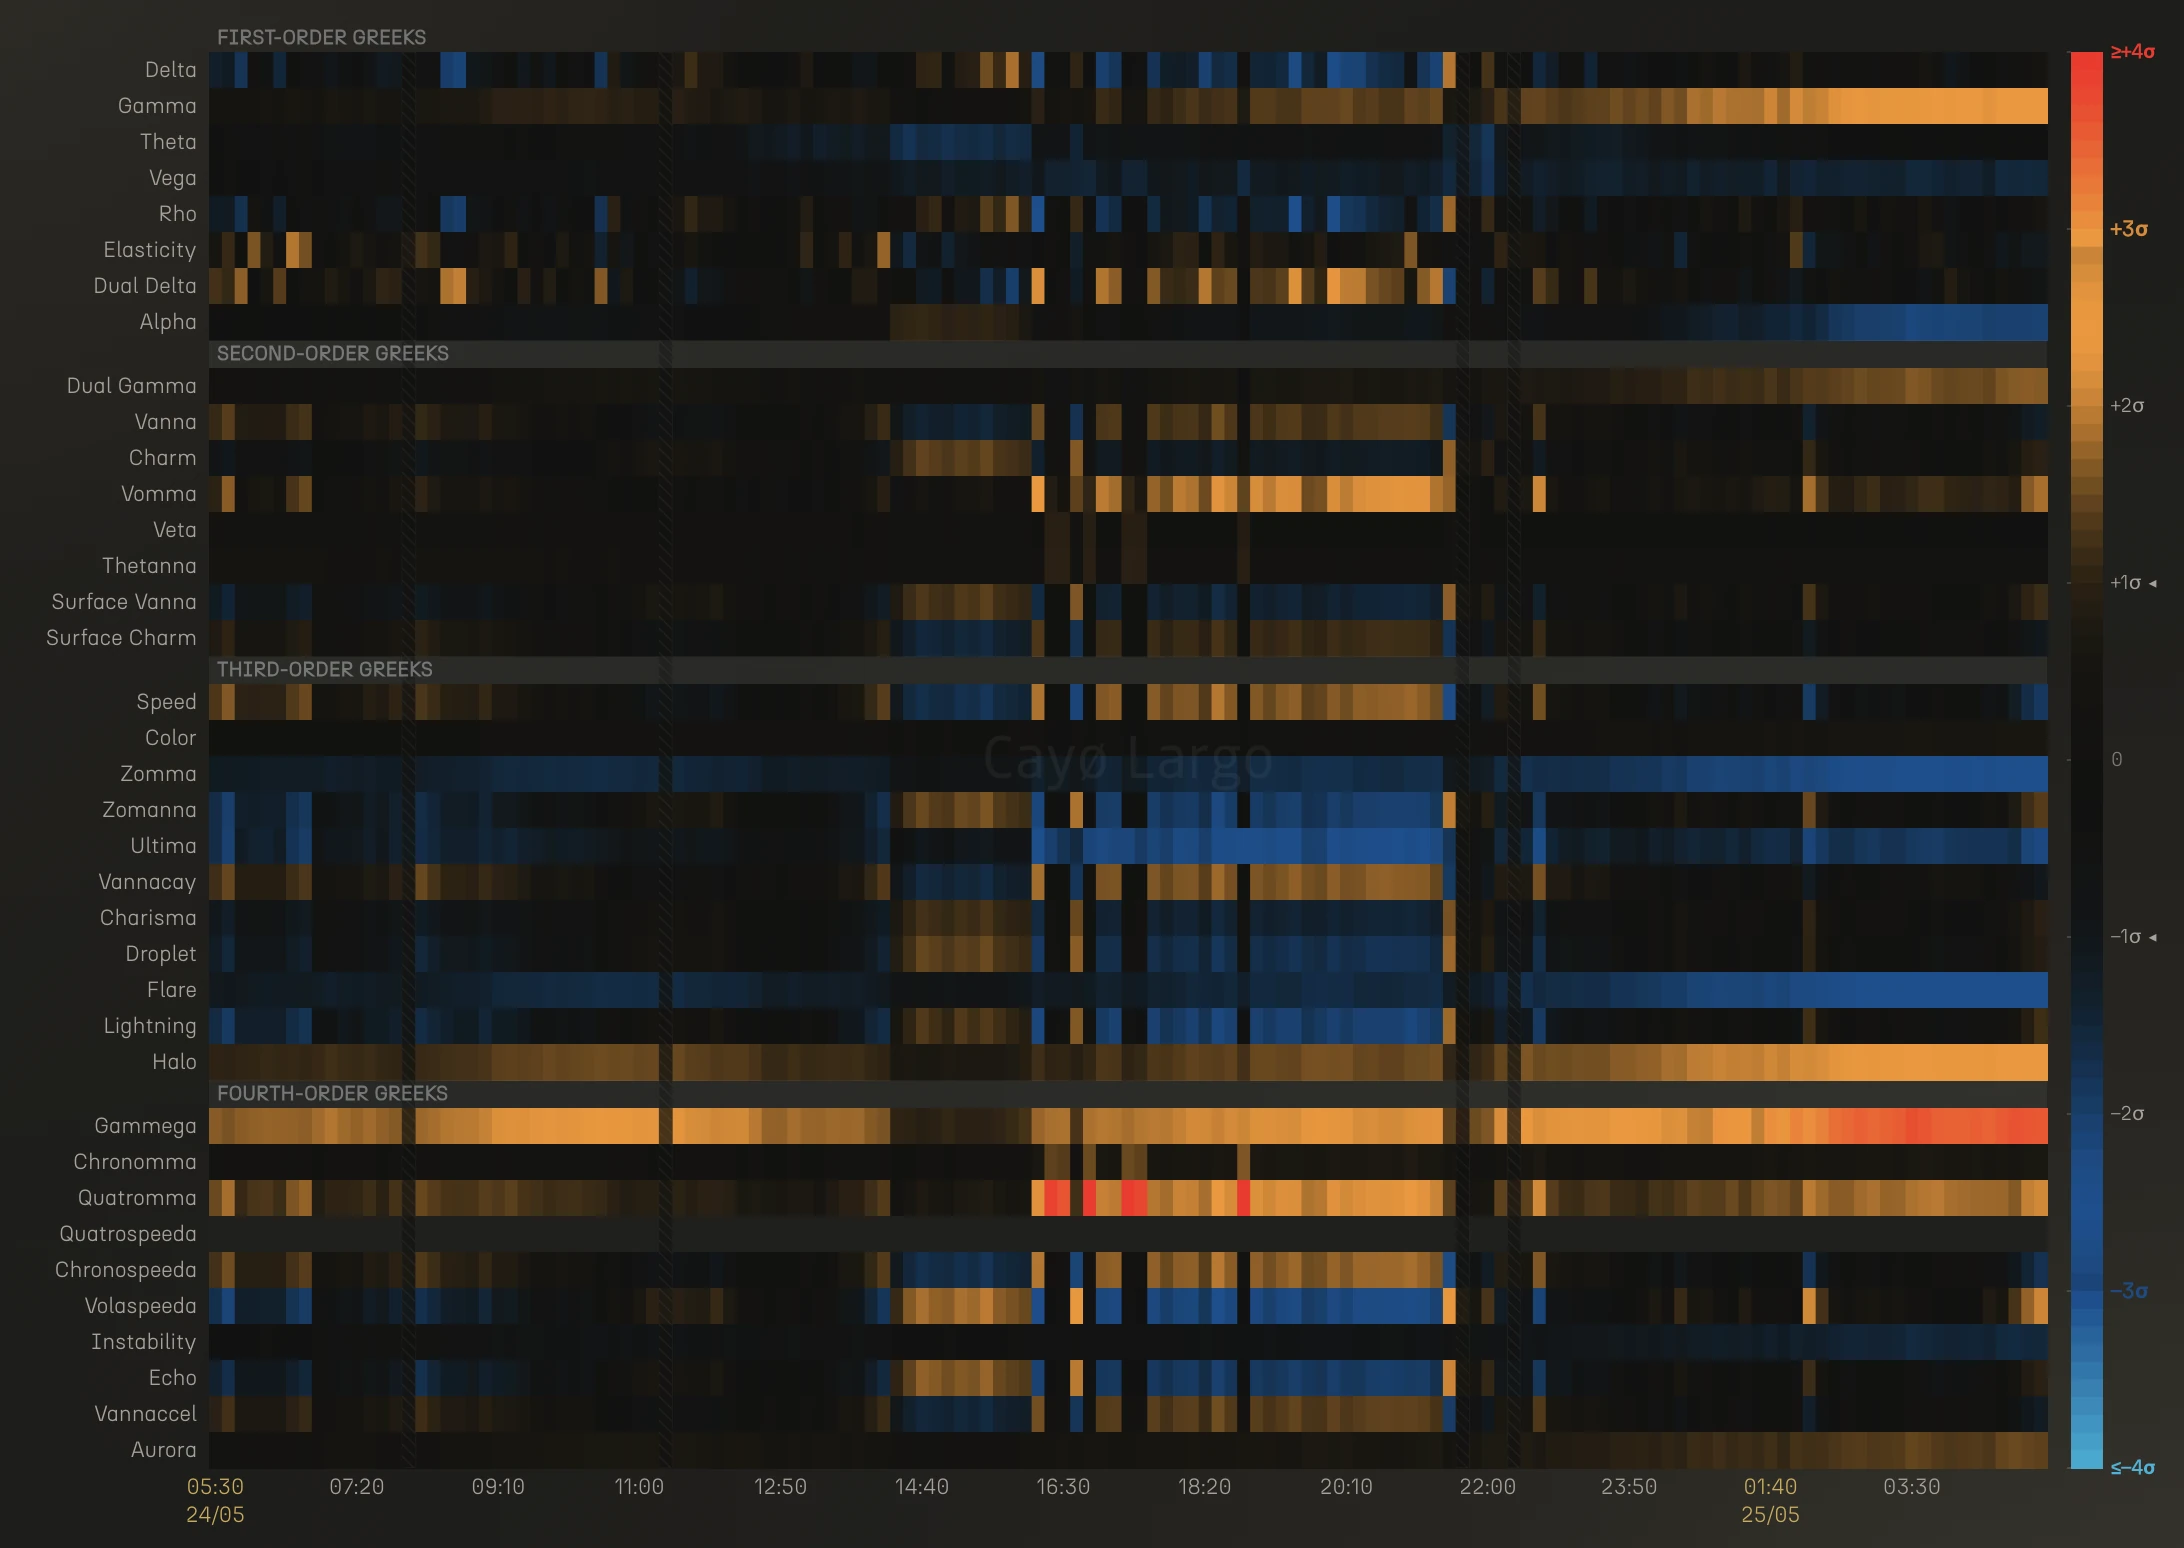
Figure 3: 37-Greek heatmap, BTC ATM 8-30d, May 24 05:30 to May 25 04:00 UTC.
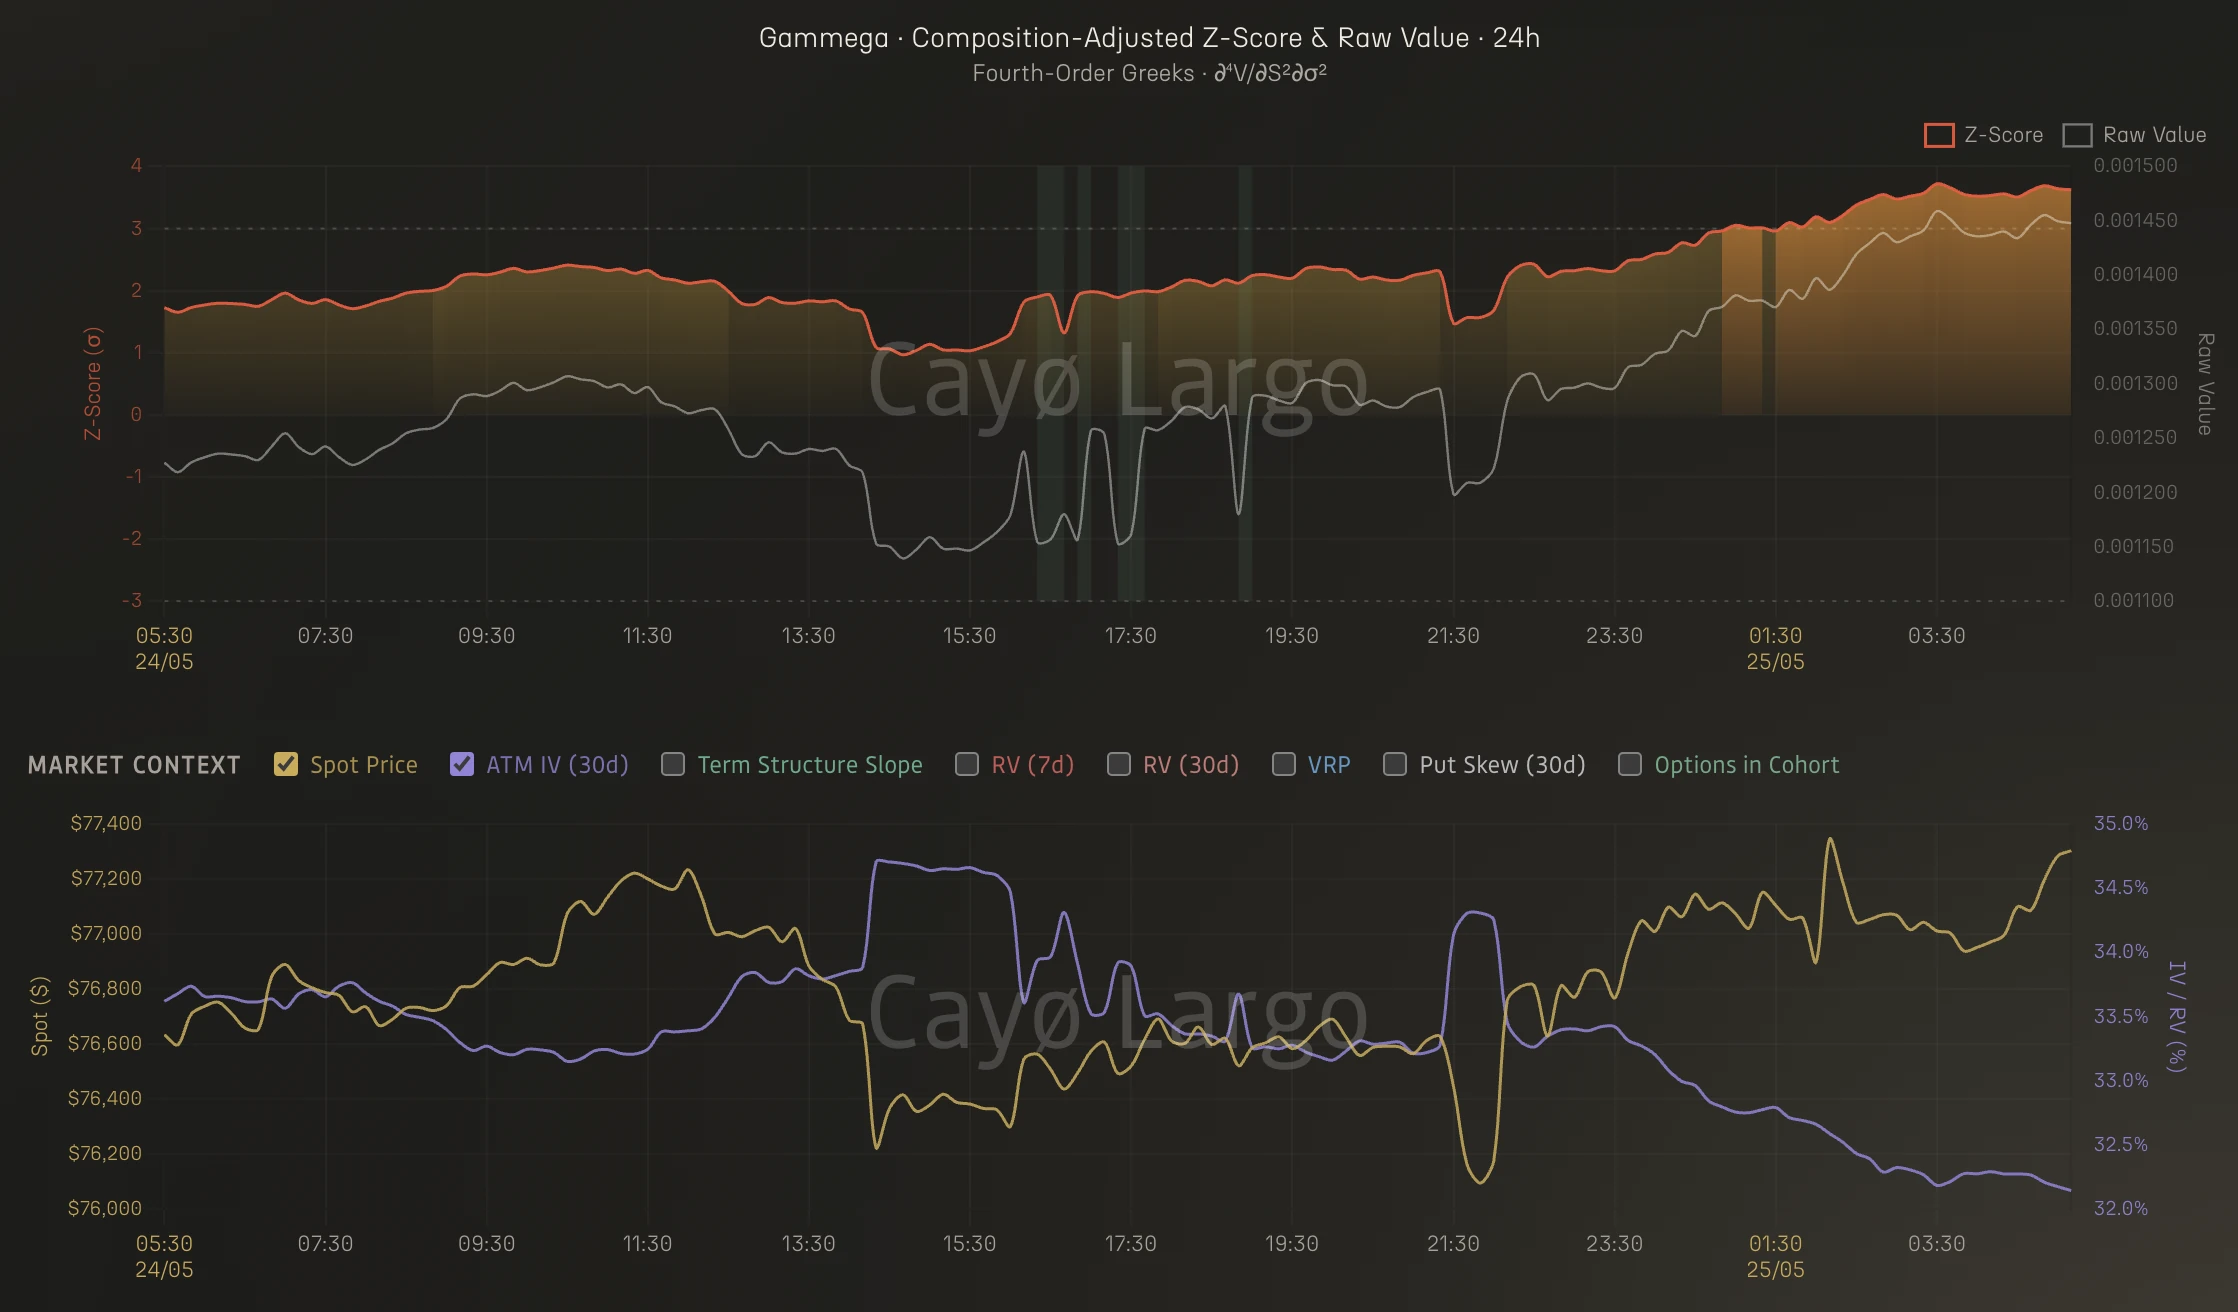
Figure 4: Gammega z-score and raw value (top), spot and ATM IV (bottom). BTC ATM 8-30d, May 24 05:30 to May 25 04:00 UTC.
Gammega held +1.5 to +2.5 through May 24. Two spot pullbacks, to $76,150 around 15:30 UTC and again at 22:00 UTC, briefly relieved the z-score. Both times spot recovered and Gammega reasserted itself. By early May 25 it had climbed past +3.5.
The same trio stayed connected. Compare Figure 3 to Figure 1. Zomma's blue band is deeper on May 25 than on May 24, the strongest reading of the entire episode, while Gamma kept climbing to nearly 3 by 03:30 UTC on May 25 and Gammega approached +4. The derivative chain held. Acceleration (Gammega) leading velocity (Zomma) leading exposure (Gamma), the same structure as May 23, only louder.
Gammega's early warning on May 23 was not a false alarm on this occasion. It was 30 hours early.
What This Episode Does Not Establish
One episode is not a base rate and we would rather say so here than let the sequence above carry more weight than it earned. What we have shown is that on 23 May the fourth-order tier moved first and the first-order tier followed, with the composition adjustment ruling out cohort churn as the cause. What we have not shown is how often Gammega rises to +2.5 and nothing follows it. That count needs a screen across many months and every coin, run against outcomes rather than read off one chart and it is not in this note.
Nor does the sequence prove causation. Gammega leading Gamma through a derivative chain is what the algebra of the chain would produce anyway when spot and vol pull apart, so the ordering is consistent with the mechanism rather than evidence for it.
This observation was made using the 37-Greek heatmap and Gammega time-series chart in Cayo Largo's Greeks Tectonics panel. The heatmap displays z-score normalised values for all 37 Greeks across time, updated every 10 minutes per ORIA cohort.
Frequently Asked Questions
What is Gammega in options trading?
Gammega is the fourth-order partial derivative of option price, computed as the second derivative of Gamma with respect to implied volatility (vol-squared). Its formal notation is d4V/dS2dsigma2. It measures how stable an option's gamma exposure remains across different volatility regimes. A rising Gammega means gamma is becoming increasingly reactive to small changes in implied vol.
Why does Gammega matter for crypto options?
Crypto options trade in a 24/7 market with volatile spot and IV. Gammega detects structural stress in the gamma surface that first-order Greeks miss entirely. When spot and IV move in opposite directions for hours, the compound stress on the cross-derivative accumulates silently. First-order dashboards show two calm lines. The fourth order shows the surface bending.
What does a Gammega spike with falling IV and rising spot mean?
It means spot and implied volatility are pulling the gamma surface from opposite directions. The spot rally pushes options through moneyness space while falling IV narrows and sharpens the gamma peak. The compound effect produces structural stress that a vol shock normally produces but without the visible vol shock. The surface looks calm. The plumbing underneath is under stress.
How does Cayo Largo compute Gammega?
Cayo Largo computes 37 Black-Scholes Greeks per option every 10 minutes across BTC, ETH, SOL, XRP, AVAX and TRX on Deribit. These raw values are then normalised into z-scores across rolling time windows and displayed as a heatmap in the Greeks Tectonics panel. Gammega is Greek number 28 of 37, sitting in the fourth-order tier.
Can first-order Greeks detect the kind of stress Gammega reveals?
No. In the May 23-24 2026 observation, Delta and Gamma showed moderate activity but nothing that would flag structural risk. IV fell gently from 36% to 33%, which standard dashboards register as orderly. The stress was invisible until the fourth-order tier, where Gammega climbed to +2.5 sigma. The signal lived between the first-order dashboard and actual portfolio risk.
What is Zomma and how does it relate to Gammega?
Zomma is the third-order Greek measuring how Gamma changes with implied volatility (d3V/dS2dsigma). Gammega is one derivative above: the rate of change of Zomma with respect to vol (d4V/dS2dsigma2). Think of Zomma as the velocity of Gamma's vol-sensitivity and Gammega as the acceleration. When Zomma displaces moderately but Gammega spikes, the rate of change is accelerating faster than the displacement itself. This is the signature of compound structural stress from spot and IV moving in opposite directions.
What is a 37-Greek heatmap?
It is a visualisation in Cayo Largo's Greeks Tectonics panel that displays all 37 Black-Scholes Greeks as rows, time as columns and z-score intensity as colour (orange for positive sigma, blue for negative sigma). It shows how Greek activity propagates across derivative orders over time, making it possible to spot structural patterns that individual Greek charts cannot reveal.
Related Articles
Dealer Greek Exposure: GEX, Charm and Vanna, With the Maths
How dealer gamma exposure (GEX), charm and vanna are actually built, formula by formula and how the order-flow sign is set. Computed on live Deribit options data.
Where the ETH Gamma Wall Cracks: Finding the Breakout Strike
You open the Dual Gamma heatmap for ETH and see a thick wall at $2,100. Impenetrable. Switch to Lightning and the wall shows where it cracks.
Why Hedging Gamma and Vega Separately Overhedges Your Book
Speed/Gamma and Veta/Vega trace a parabola under Black-Scholes. Gamma curvature and vega decay are coupled. Hedging them independently means over-hedging.
The 37-Greek Compression: Options Surface in Three Lines
37 Greeks compressed into three lines. White shows non-linearity. Gold flags pre-event tension. Red fires during structural stress. The ratios, the maths behind them and how to read the surface off a single panel.