Why Knowing Your Greeks Won't Save You on Deribit
You learned Delta, Gamma, Theta. You can explain Black-Scholes over coffee. Then you open Deribit's options page and none of it helps. Here's why options theory breaks down on a live screen.
"Because knowing what a Delta is doesn't prepare you for this mess."
I still remember the first time I opened Deribit's options page. Three weeks of YouTube had me feeling bulletproof. Black-Scholes? Got it. Greeks? Delta, Gamma, Theta, rattled off like a grocery list. Put-call parity? Basic arithmetic.
Then I clicked the "Options" tab and my confidence left the room.
What I found wasn't the clean, tidy examples from tutorials. It was a wall of numbers. Hundreds of them. Here's what a typical session looks like:
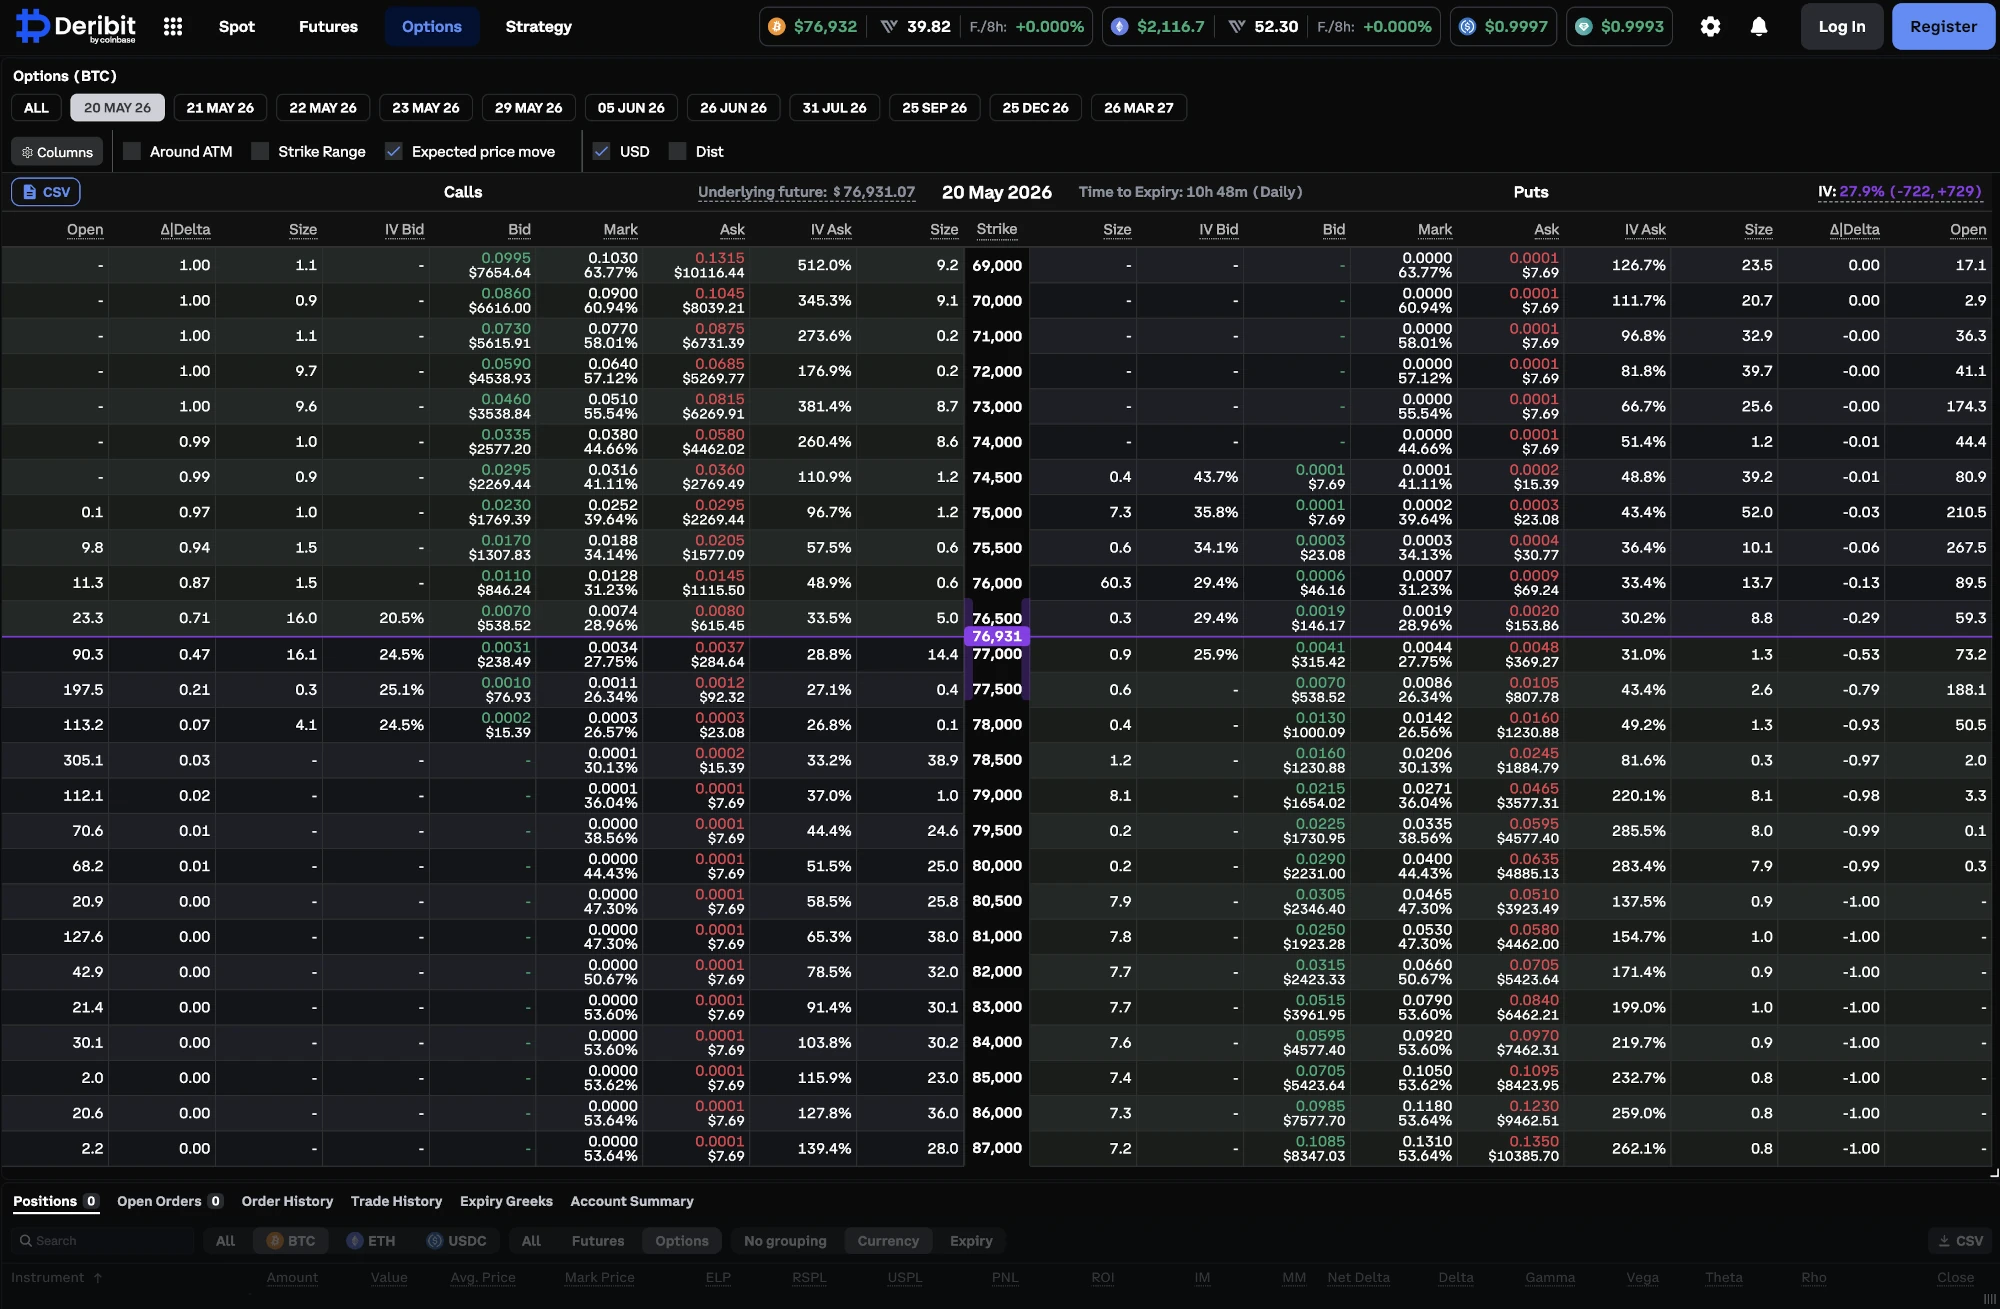
Figure 1: Deribit's Dashboard for Options Trading
That confident smirk? Gone. Faster than BTC during a China ban headline.
The Smart Trader's Paradox
Here's what nobody tells you: the more you know about options, the worse this dashboard hits you. A total beginner might just pick something and click. But you? You did your homework. You know there's a right answer buried in this mess. You just can't find it.
The underlying sits at $76,931. Strike prices run from 69,000 to 87,000. Some have decent volume, some show nothing. Implied volatility jumps around from strike to strike. Bid-ask spreads range from tight to laughable. And with expiration hours away, every minute spent thinking is money draining from potential trades.
When Theory Crashes Into Reality
YouTube makes it sound easy. "Think the price goes up? Buy a call. Think volatility is high? Sell premium." Clean. Logical.
Real trading is nothing like that. It's like learning to drive in a parking lot, then getting dropped onto a highway with no lane markings.
Take implied volatility. You learned that high IV means expensive options. Fine. But what counts as "high" in crypto? Traditional stocks hit 30% IV during earnings and people panic. Crypto can sit above 100% on a wild week, then drop to 28% when things calm down. That 27.9% IV you see on the screenshot, is that cheap? Is it time to load up on options? Or is the market just dead?
And the Greeks. You memorized that Delta tells you price sensitivity. But staring at a 0.47 Delta in a live market feels different than reading about it in a textbook. Good number? Bad? Nobody covered the part where abstract Greek letters turn into real money you could lose.
The Volume Puzzle That Breaks Brains
Volume in crypto options is its own beast. With traditional stocks like Apple or Tesla, liquidity follows patterns. You can spot where the action is. Crypto? No such luck.
Look at that dashboard. Some strikes have trades, others sit empty. What counts as "liquid" here? Is 30 contracts solid or paper-thin? How do you read open interest in a market that barely existed five years ago?
There are no textbook answers because the market is still figuring itself out.
I spent my first weeks stuck in this loop. Every strike that looked good on paper had garbage volume. Every strike with decent volume had ugly Greeks. It felt rigged against anyone trying to think it through.
The Analysis Paralysis Death Spiral
This is where smart traders get trapped. You try to be methodical. Check implied volatility against historical levels. Scan Greeks across multiple strikes. Compare volume. Run profit scenarios. Two hours later, you're still staring at a position that expires in six.
The cruel part? The market keeps moving while you think. That setup you spotted an hour ago? The price shifted, IV changed, and your analysis is already old news.
But you can't skip the analysis either. Blind trades in options cost real money. The bid-ask spreads alone will eat your account if you pick bad entries.
Why Smart People Feel Stupid
This isn't about you being slow. It's a design problem. These dashboards were built by engineers showing every available data point. Nobody stopped to ask whether a trader could actually use all of it at once.
Think of it this way. If someone handed you a month of raw weather data (temperature every 5 minutes, humidity, wind speed, barometric pressure) could you tell me if it'll rain today? Probably not. You'd want a simple forecast: "30% chance of rain this afternoon."
That's what's happening with options dashboards. You're drowning in raw data when you need a forecast. Deribit shows every number it can, but gives you zero context for making a decision.
How We Solve the Dashboard Dilemma
Our starting point is simple: every number on that dashboard should help you make a decision, or it shouldn't be on screen.
Instead of telling you IV is 27.9%, we show you where that sits historically. Is it in the 90th percentile? The 20th? That single piece of context turns a random number into something useful.
We built scoring systems that automatically flag untradeable strikes. Bad spreads, zero volume, those get filtered before you waste time on them. Good liquidity and tight spreads get marked clearly.
Our systems track how implied volatility shifts across strikes and time frames. When institutional money starts building positions in specific areas, we catch those patterns and bring them to your attention.
The Greeks get the same treatment. Instead of raw Delta and Gamma, you see how current levels compare to historical norms and what that means for different market moves.
Building Confidence Through Clarity
We're not here to trade for you. We give you the context to trade with confidence.
When our analysis highlights a specific strike, you see not just the opportunity but why it exists and what risks come with it. Our quality metrics keep you out of thin markets that could trap you on entry or exit. And our alerts help you act before the analysis paralysis sets in.
Frequently Asked Questions
Why don't options Greeks help on Deribit?
Knowing the textbook definition of Delta or Gamma is different from reading those numbers in a live crypto market. Deribit shows raw Greeks across hundreds of strikes without context on which values are normal, which are extreme, or which strikes are even liquid enough to trade.
What makes crypto options Greeks different from traditional markets?
Crypto implied volatility regularly sits above 100 pct, compared to 20-30 pct for most equities. This makes standard Greeks benchmarks unreliable. Volume is thinner, spreads are wider, and there is less historical data to compare against.
How do beginners avoid analysis paralysis on Deribit?
Use tools that add context to raw data: IV percentile rankings, liquidity quality scores, and automated filtering of untradeable strikes. Focus on a few clear decision criteria rather than trying to analyze every number on screen.
What should I look for instead of raw Greeks on Deribit?
Look for IV percentile rankings (is current volatility high or low historically), liquidity quality indicators, and risk-adjusted comparisons across strikes. Raw Greeks alone tell you the math, not whether the trade makes sense.
Can you trade Deribit options as a beginner?
Yes, but the interface is built for data completeness, not decision-making. Beginners benefit from analytics platforms that translate raw Deribit data into context: which strikes are tradeable, which are overpriced, and which carry hidden risks in thin liquidity.
Related Articles
Why Crypto IV Spikes Before Expiry: The Bow Shock
Why does crypto implied volatility spike before expiry? An IV Footprint heatmap shows a bow-shaped front flaring at the wings before each Deribit settlement.
Dealer Exposure Heatmaps for Crypto: Charm, Gamma and Vanna
Dealer Greek exposure heatmaps look simple and aren't. The full build for crypto options on Deribit: the charm, gamma and vanna maths and the order-flow sign.
Variance Risk Premium: Are Options Overpriced or Cheap?
How to read IV vs RV charts and the variance risk premium to figure out whether crypto options are overpriced, underpriced, or fairly valued. Live AVAX example from Deribit.
How to Read Gamma Exposure: Bitcoin GEX Live Case Study
BTC trades at $77,140 with $51 million in put open interest stacked at $76,000 and the gamma regime deep in negative territory. Expiry is 16 hours away. Here's how to read every chart on the GEX Landscape page and what each one tells you about what happens next.
Gammega at +3.5σ: When Spot and IV Pull Apart
BTC Gammega hit +3.5σ over 30 hours as spot rallied and IV fell. Fourth-order stress invisible to standard dashboards. Gamma exploded 30 hours later.
The 37-Greek Compression: Options Surface in Three Lines
37 Greeks compressed into three lines. White shows non-linearity. Gold flags pre-event tension. Red fires during structural stress. A beginner's guide.