The Parabola in Crypto-Greeks: Speed/Gamma vs Veta/Vega
Speed/Gamma and Veta/Vega trace a parabola under Black-Scholes. Gamma curvature and vega decay are coupled. Hedging them independently means over-hedging.
This is a research note, not a tutorial. It assumes familiarity with Black-Scholes Greeks through third order.
Research Note RN-001 (May 23, 2026)
What We Observed
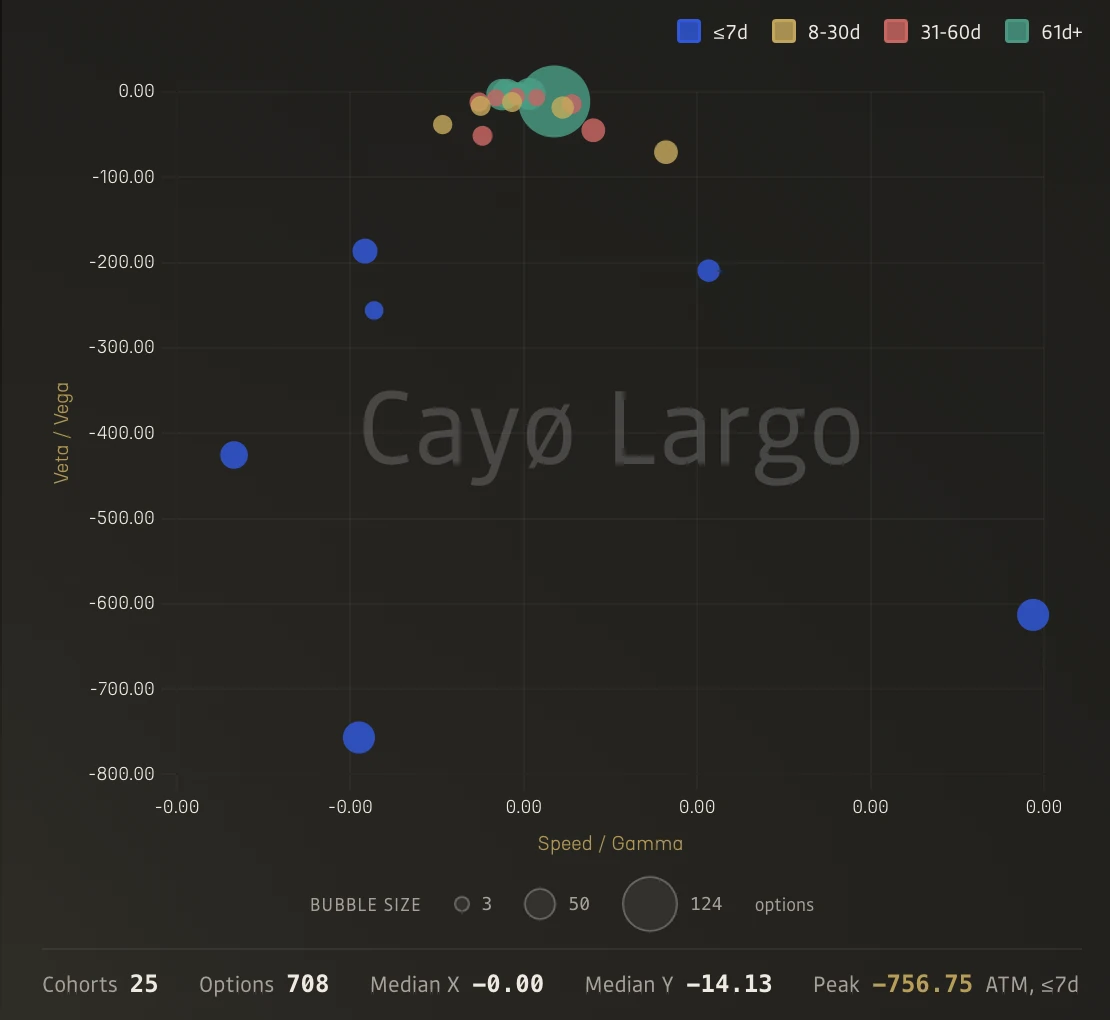
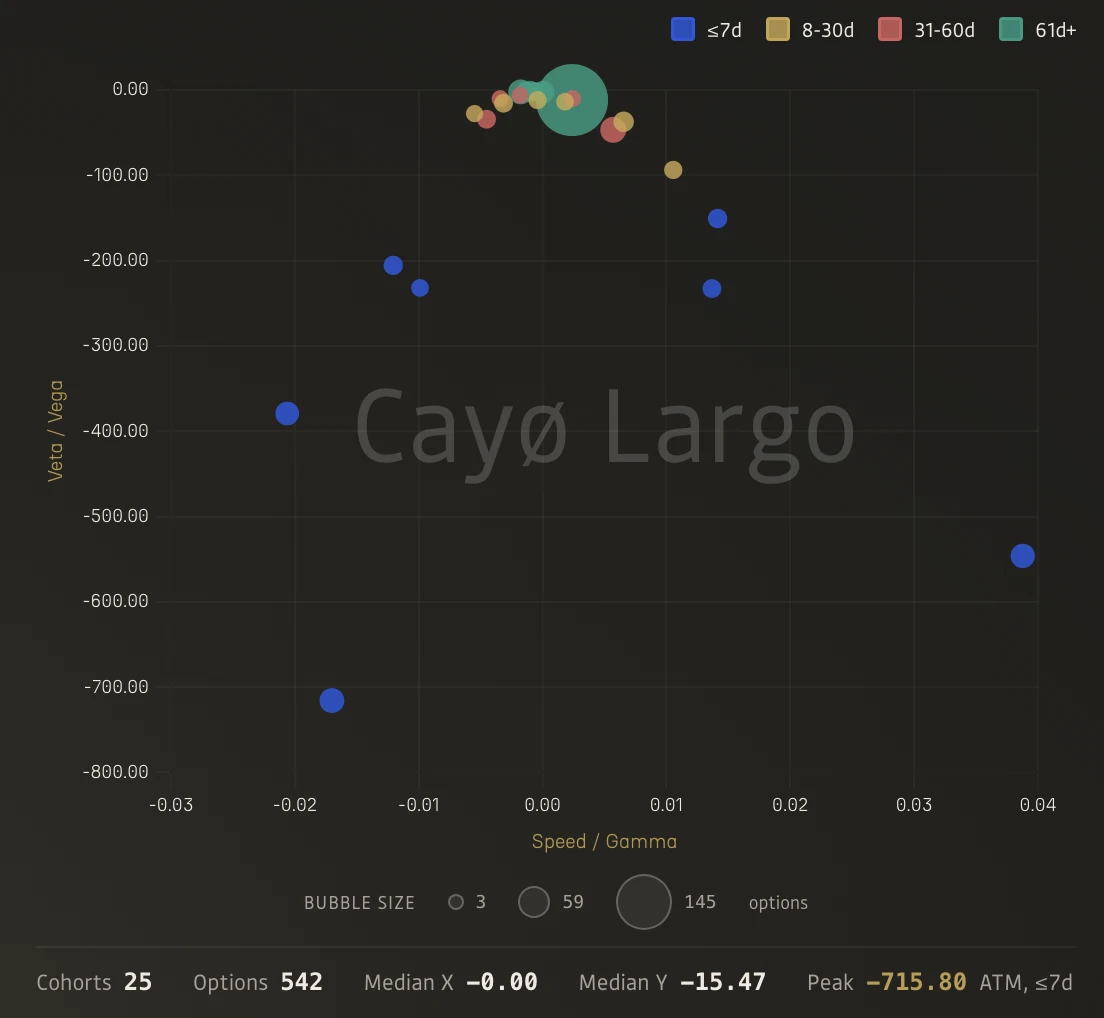
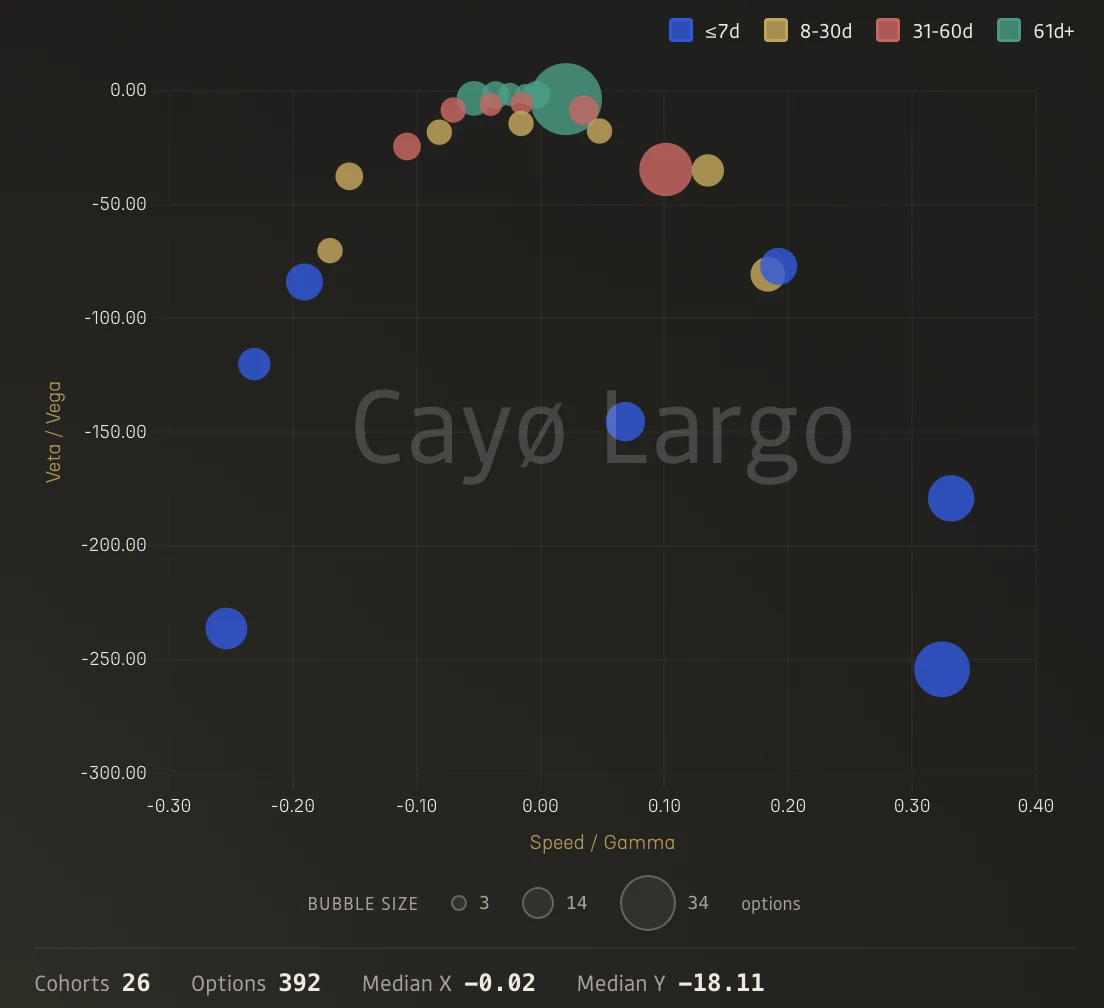
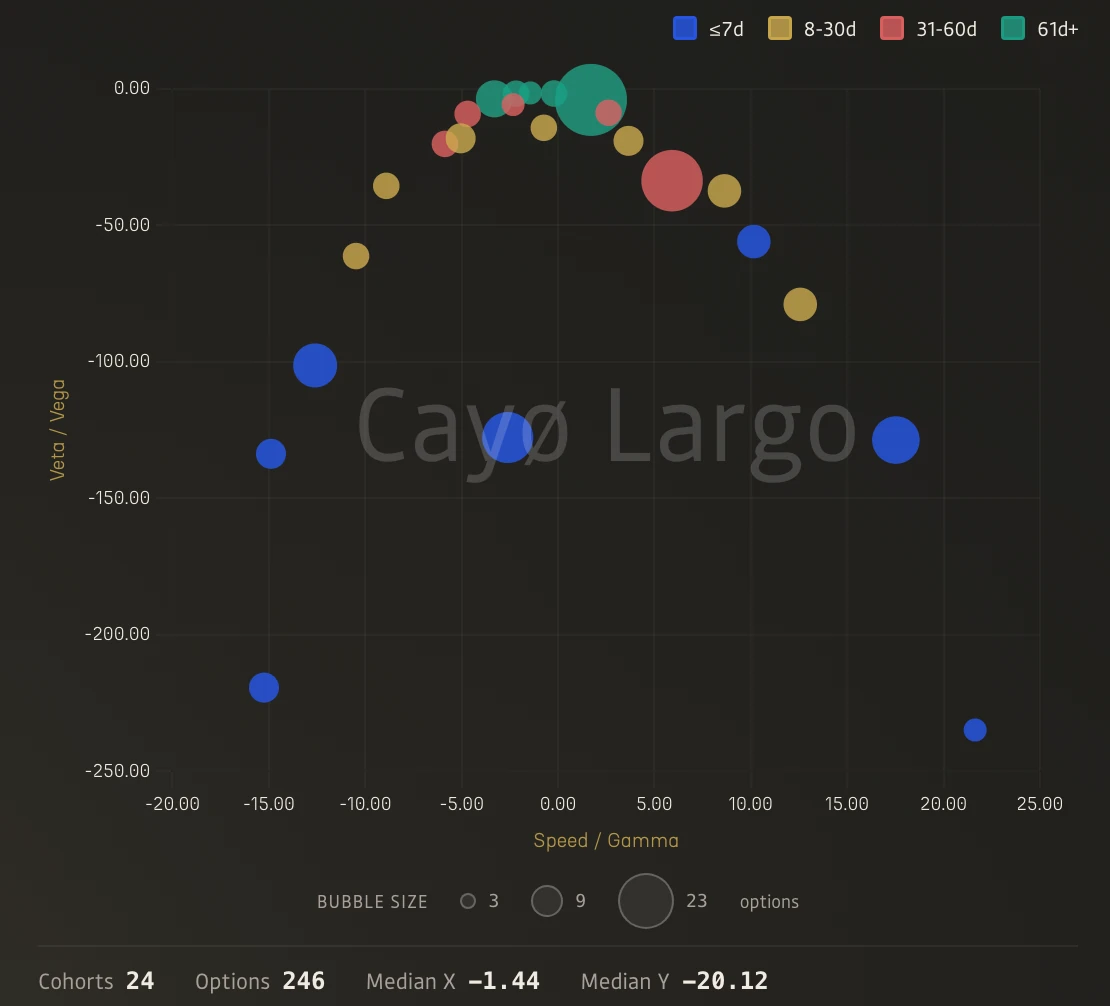
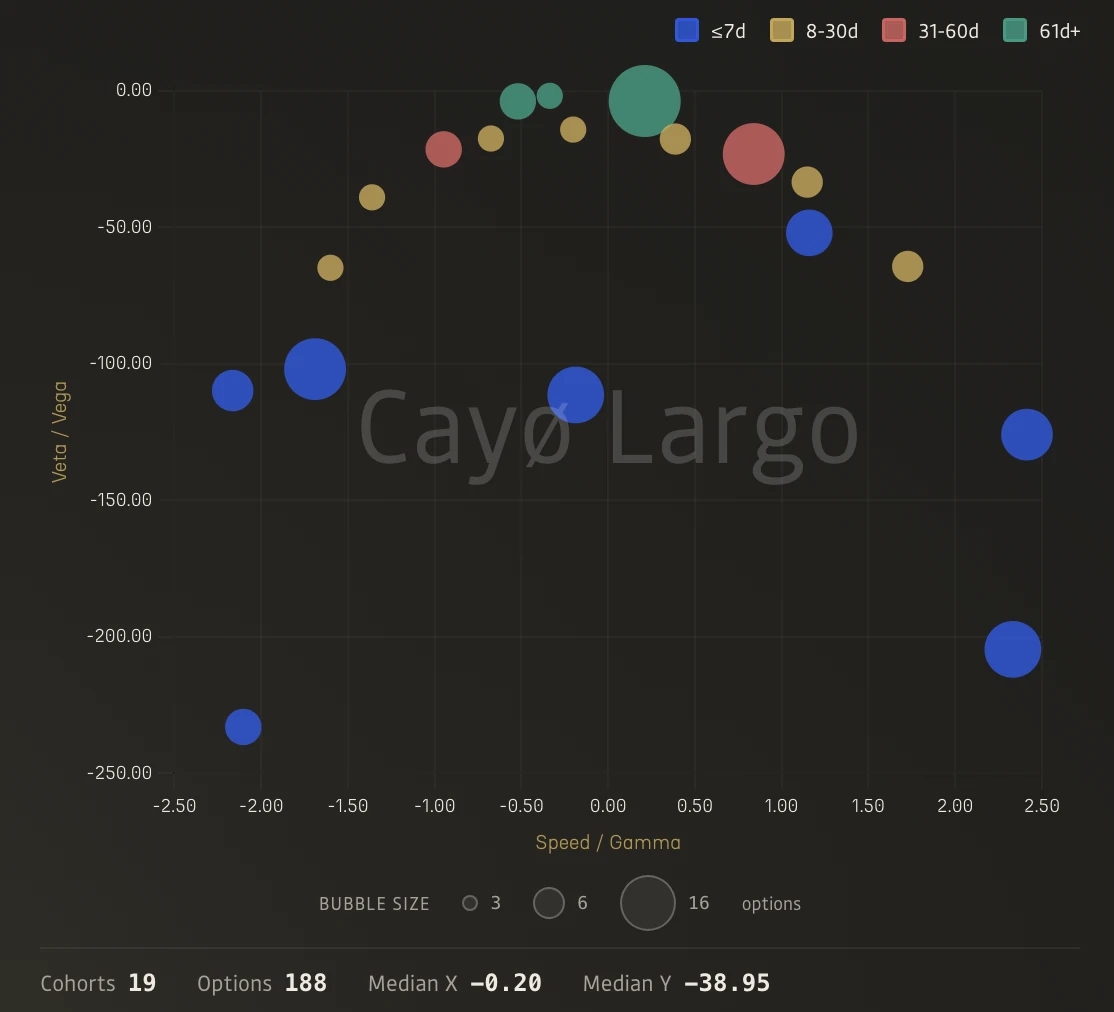
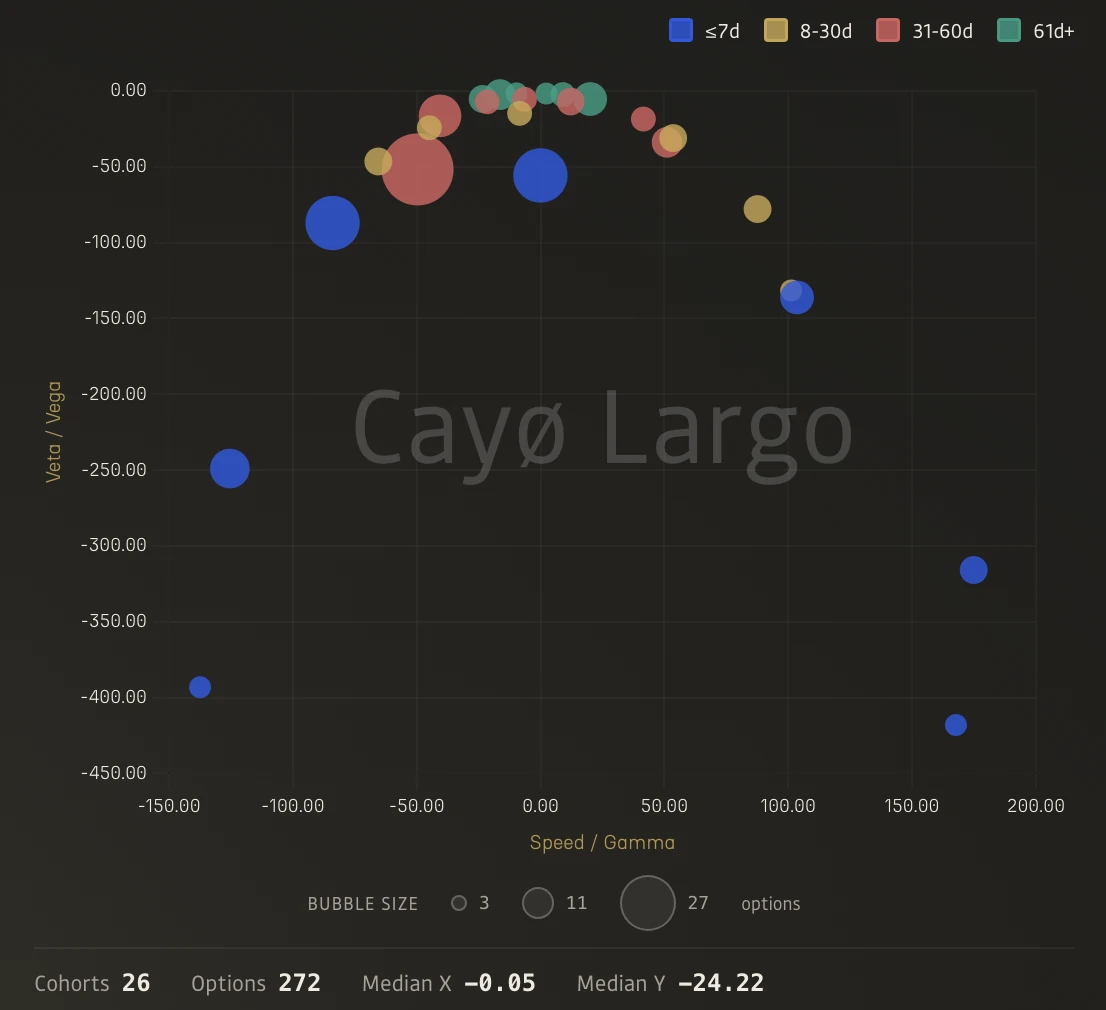
On May 7, 2026, we pulled the Ratio Scatter panel on Cayø Largo's Greeks Tectonics page for all six coins tracked on Deribit, i.e. BTC, ETH, SOL, XRP, AVAX, and TRX. Each panel plots Speed/Gamma (x) against Veta/Vega (y) across the ORIA cohort grid. Every bubble is one cohort, i.e. one moneyness bucket crossed with one expiry bucket, and its coordinates are the median ratio values for all options in that cohort. Colour encodes the expiry bucket. Blue is options expiring within 7 days, yellow 8-30 days, pink 31-60 days, green 61 days and beyond. Bubble size scales with the number of options in each cohort.
BTC
ETH
SOL
XRP
AVAX
TRX
Figure 1: Speed/Gamma vs Veta/Vega across all six Deribit coins, 7 May 2026 19:10 UTC. Same axes, same colour coding. The parabola appears in every coin. What changes is the x-axis scale, the arm depth, and the noise level.
The same downward arc appears in all six coins. Every scatter shows the same layout, i.e. long-dated cohorts clustered near the origin, short-dated ones pulling away toward deeply negative Veta/Vega. The parabolic shape is actually easiest to see in XRP and TRX, where the wider Speed/Gamma range gives the arc enough horizontal room to show its curvature. BTC and ETH have the deepest arms (below -700) but their x-axes are a bit irregular at the first glance. SOL and AVAX sit in between.
May 7 was simply when we first noticed the pattern. The parabola is not a one-off snapshot. It reappears every 10 minutes, across all six coins, in every update of the Ratio Scatter panel. The question is whether this is a coincidence of the vol surface, or something structural.
The Two Ratios
Cayø Largo computes 37 Black-Scholes Greeks per option every 10 minutes, then derives 22 cross-Greek ratios across five analytical tiers (see Crypto-Greek Atlas). Each ratio divides a higher-order Greek by a lower-order one, converting raw sensitivity values into proportional rates of change. Two of those ratios are the subject of this note:
Speed / Gamma. Speed is the third derivative of option price with respect to spot, . It measures how fast gamma itself is changing as the underlying moves. Dividing by gamma normalises the result into a proportional rate. By the chain rule, , so Speed/Gamma . A Speed/Gamma of -0.003 means gamma is declining at 0.3% per dollar of spot movement.
Veta / Vega. Veta is , the rate at which volatility exposure erodes as calendar time passes. Dividing by vega, the option's sensitivity to implied volatility, gives the same log-derivative form, Veta/Vega . It answers the question, what fraction of my current vega am I losing per unit of time?
Both ratios strip out the absolute size of the Greek and expose the rate of change. That is what makes them comparable across strikes, expiries, and coins with very different notional scales.
The Derivation
We want to show algebraically that the parabola in Figure 1 is not a coincidence but an exact relationship under Black-Scholes. Set for clarity (the risk-free rate adds a small correction but does not change the structure). All Greeks below are for a European option on an underlying with spot price , strike , annualised volatility , and time to expiry (in years).
Starting point: and its sensitivities
In Black-Scholes, every Greek is a function of , the normalised log-moneyness adjusted for drift. We start here because both Speed/Gamma and Veta/Vega reduce to expressions in , and eliminating it between them is what produces the parabola.
Two partial derivatives of appear repeatedly. We need both before touching any Greek.
Sensitivity to spot. Differentiating with respect to :
Sensitivity to time. Differentiate each piece of with respect to separately.
First piece:
Second piece:
Sum the two pieces.
Rewrite the second term with denominator by multiplying top and bottom by , giving . Rewrite the first term by multiplying top and bottom by , giving . Combine.
This is the raw form (verifiable in Wolfram Alpha). For the steps below it is more convenient to express it in terms of . Start from the unsimplified sum.
From the definition of , we have . Substitute into the first term:
split the fraction,
add back the second piece from the original sum:
Therefore,
We will also need the derivative of the standard normal PDF with respect to its argument. The PDF is
Differentiating with respect to ,
so
This appears in Step 2 when differentiating Gamma, because contains and the chain rule pulls out .
Step 1: Gamma
Gamma is the second derivative of option price (the same for calls and puts) with respect to spot at :
Step 2: Speed
Speed is . Write as a product of two functions of :
Differentiating with the product rule, the first factor depends on through and the second depends on directly.
The second derivative is , so
Substituting and .
the same for calls and puts.
Step 3: Speed / Gamma
The ratio takes form:
Expanding and cancelling ,
Call this . We will use it as the x-axis variable.
Step 4: Vega
Vega is the sensitivity of option price to volatility:
Step 5: Veta
Veta is (negative sign so that the passage of time gives negative Veta for a decaying position). Let's differentiate with respect to :
Substituting highlighted terms, we get:
Factor out ,
Expanding the bracket:
Therefore,
Step 6: Veta / Vega
The ratio takes form:
The cancels,
This is the y-axis variable, expressed in terms of , , and .
Step 7: eliminating
From Step 3, , so .
Substitute into the Veta/Vega expression. First the quadratic term.
Then the linear term.
Plug both into Step 6.
Simplify each piece:
Grouping by powers of ,
reduces to:
where .
This is
an inverted quadratic function form, a downward-opening parabola in Speed/Gamma, exact under BSM with no approximations.
So What Does This Actually Give Us
The identity is exact under BSM. Every option on every coin, at every strike and expiry, must land on this parabola if the model holds. That is a strong constraint, and it has a few consequences worth thinking through.
The first is diagnostic. If we compute Speed/Gamma and Veta/Vega from live data and a cohort falls off the curve, something is inconsistent in the pricing. It could be a data issue, a stale quote, or a Greek computation bug. The parabola becomes a free sanity check that runs across all 24 cohorts simultaneously, without needing a reference value for any individual Greek.
The second is structural. The relationship tells us that gamma curvature and vega decay are not independent risk dimensions. They are algebraically coupled through spot, vol, and time. A desk monitoring both ratios is, in a BSM world, monitoring one thing expressed two ways. That does not mean one is redundant in practice (skew and jumps break the coupling), but it changes how you think about hedging both at once.
The third, and we think most interesting, is what happens when the parabola breaks. BSM assumes flat vol, no jumps, continuous hedging. Deribit options violate all three. Skew should bend the arms asymmetrically. Jump risk should scatter short-dated cohorts off the curve. A clean parabola on a given day probably means the volatility surface is well-behaved and internally consistent. A fragmented one might be an early sign that the market is pricing something BSM cannot capture.
We have not built a signal from this yet. The next step would be to measure the residual, i.e. the distance of each cohort from the theoretical curve, and track it over time. If the residual spikes before large moves, there is something tradeable here. If it stays noisy, the identity remains a useful diagnostic but not a signal. We plan to test this.
This observation was made using the Ratio Scatter panel in Cayø Largo's Greeks Tectonics page. The panel plots any two Greek ratios against each other across the 24-cohort ORIA grid (4 moneyness buckets, 6 expiry buckets) and updates every 10 minutes for all six coins. The parabola is visible in every cycle, not just the May 7 snapshot shown here. The derivation applies to any underlying, not just BTC. For assets with lower spot prices, expect visible asymmetry from the linear term.
Frequently Asked Questions
What is Speed in options and how does it relate to Gamma?
Speed is the third derivative of option price with respect to spot, also called DgammaDspot. It measures how fast gamma changes per dollar move in the underlying. Dividing Speed by Gamma normalises this into a proportional rate, equivalent to the log-derivative of gamma with respect to spot. A Speed/Gamma of -0.003 means gamma is declining at 0.3 pct per dollar of spot movement.
What is Veta and how does it relate to Vega?
Veta is the derivative of vega with respect to time, also called DvegaDtime. It measures how fast an option's volatility exposure erodes as calendar time passes. Dividing Veta by Vega gives a proportional decay rate, answering the question: what fraction of my current vega am I losing per unit of time? Short-dated options have much larger negative Veta/Vega values than long-dated ones.
Why do Speed/Gamma and Veta/Vega form a parabola?
Both ratios reduce to expressions in d1, the normalised log-moneyness from Black-Scholes. Speed/Gamma is linear in d1, while Veta/Vega contains a d1-squared term. Eliminating d1 between the two expressions yields an exact downward-opening quadratic. The relationship is structural, not statistical, and holds for any underlying priced under Black-Scholes.
Do higher-order Greeks matter in crypto options trading?
Yes. Crypto options have higher volatility, shorter average DTE, and wider moneyness ranges than equity options. This amplifies third-order effects like Speed (gamma curvature) and Veta (vega decay). On Deribit, short-dated altcoin options can have Speed/Gamma values 100x larger than long-dated BTC options. Ignoring higher-order Greeks in crypto means missing the fastest-moving risk dimensions.
What does a clean parabola tell you about the volatility surface?
A clean parabolic shape means the market is pricing close to Black-Scholes assumptions, with no significant skew distortions, jump risk, or term-structure kinks. A well-formed parabola is a sign of an orderly vol regime. When cohorts scatter off the theoretical curve, it signals that the market is pricing something Black-Scholes cannot capture, such as tail risk or event premiums.
Can Greek ratios predict options behavior better than raw Greeks?
Greek ratios strip out the absolute size of a Greek and expose the proportional rate of change. This makes them comparable across strikes, expiries, and coins with very different notional scales. A raw gamma of 0.001 means nothing without context, but a Speed/Gamma of -0.01 tells you gamma is declining at 1 pct per dollar regardless of the asset. Ratios also reveal hidden algebraic relationships, like the parabola between Speed/Gamma and Veta/Vega, that raw Greeks obscure.
Related Articles
Dealer Exposure Heatmaps for Crypto: Charm, Gamma and Vanna
Dealer Greek exposure heatmaps look simple and aren't. The full build for crypto options on Deribit: the charm, gamma and vanna maths and the order-flow sign.
Inside the Gamma Wall: How Lightning Greek Finds the Cracks
You open the Dual Gamma heatmap for ETH and see a thick wall at $2,100. Impenetrable. Switch to Lightning, and the wall shows where it cracks.
Gammega at +3.5σ: When Spot and IV Pull Apart
BTC Gammega hit +3.5σ over 30 hours as spot rallied and IV fell. Fourth-order stress invisible to standard dashboards. Gamma exploded 30 hours later.
The 37-Greek Compression: Options Surface in Three Lines
37 Greeks compressed into three lines. White shows non-linearity. Gold flags pre-event tension. Red fires during structural stress. A beginner's guide.