The 37-Greek Compression: Options Surface in Three Lines
37 Greeks compressed into three lines. White shows non-linearity. Gold flags pre-event tension. Red fires during structural stress. The ratios, the maths behind them and how to read the surface off a single panel.
Three lines. 37 Greeks. One glance tells you whether the market is simple or about to get complicated.
What the Chart Shows
Most options dashboards show you individual Greeks: Delta, Gamma, Theta, Vega and if you are lucky a few second-order ones like Vanna or Charm. You stare at a grid of numbers that changes every few minutes and try to build a picture in your head.
Black-Scholes produces far more than four Greeks. Second-order Greeks measure how first-order sensitivities shift when several variables move at once, third-order Greeks measure how those shifts accelerate and fourth-order Greeks measure the acceleration of that acceleration.
Cayo Largo computes 37 of them, every 10 minutes, across six coins.
Nobody can track 37 lines at once. The Cross-Order Ratios chart asks a different question instead, namely how much total activity is happening at each layer of complexity and it compresses all 37 into three lines, each comparing one layer against the layer below it.
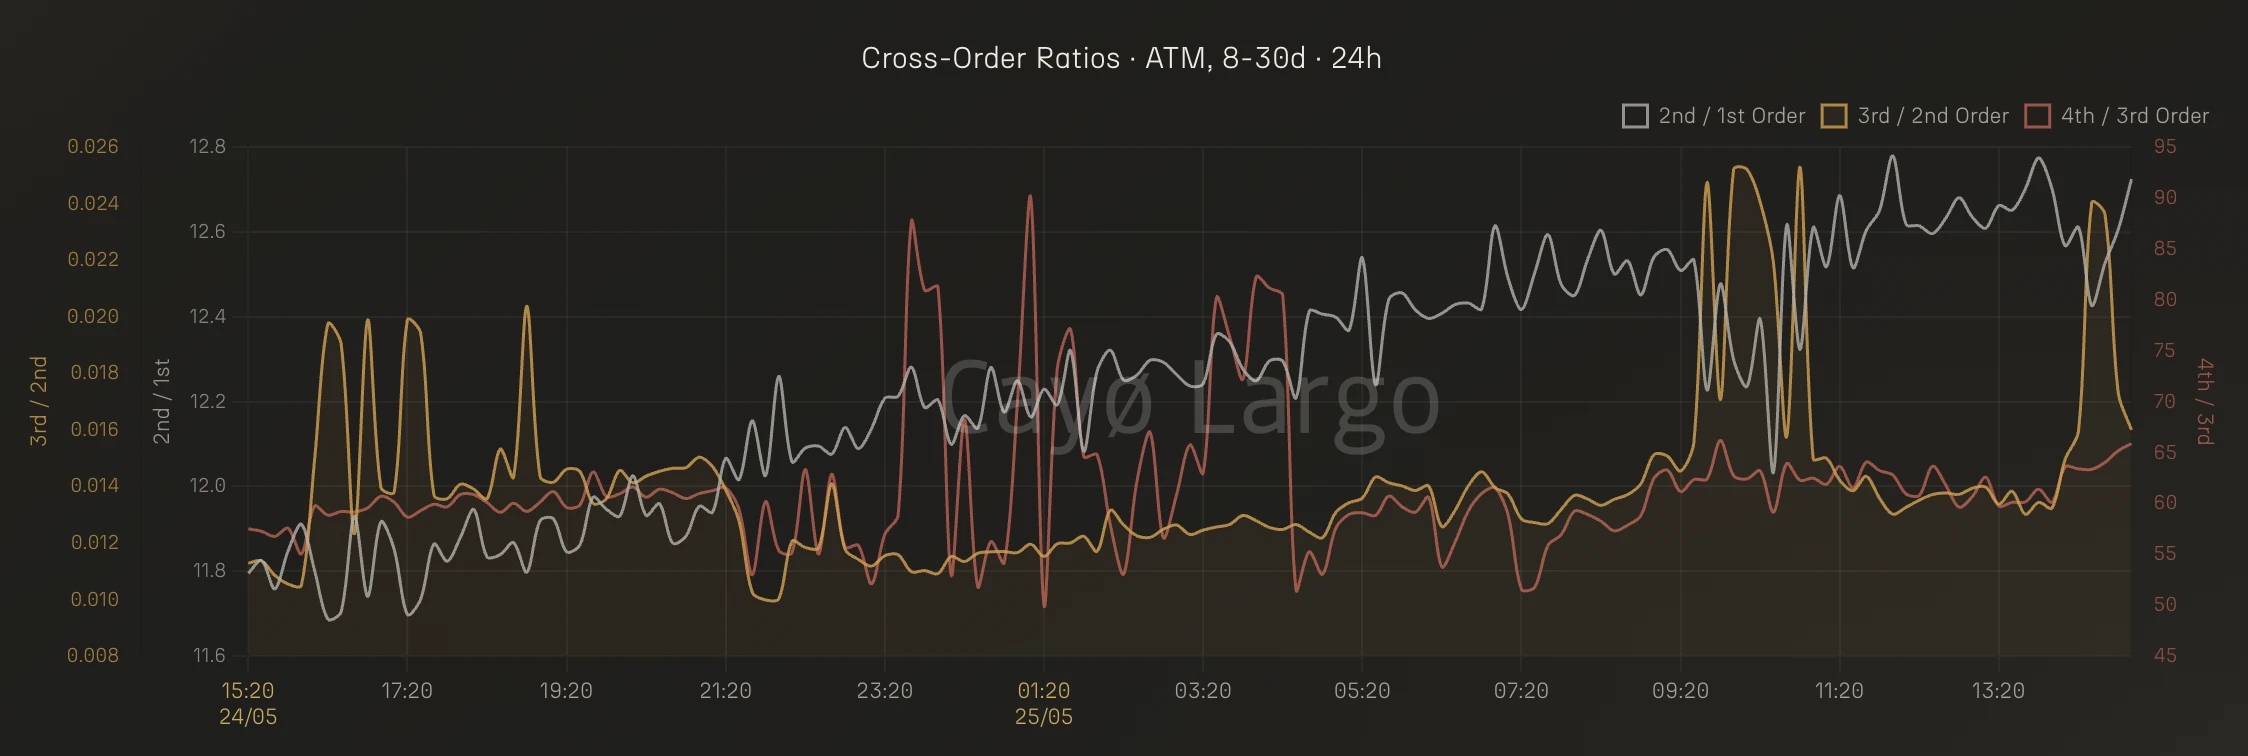
Figure 1: Cross-Order Ratios, BTC ATM 8-30d, 24h window ending May 25 2026.
Think of it as a depth gauge. The first line tells you what is happening at the surface, the second what is shifting underneath and the third what is moving in the deep structure. When the surface is calm but the deep layers are active, the market is not as quiet as it looks.
Where the Numbers Come From
For each order of Greeks, sum their absolute values and divide by the sum of absolute values in the order below.
Where is the -th Greek of order . We take absolute values because Greeks can be positive or negative and what we want here is magnitude rather than direction.
This is computed per option, then aggregated across the cohort using liquidity weights, so options with tighter bid-ask spreads and better depth contribute more and an illiquid strike with wild Greeks cannot distort the signal.
The chart label "ATM, 8-30d" tells you the filter, namely at-the-money options expiring in 8 to 30 calendar days, which is the most liquid and most actively traded slice of the surface.
Reading the Three Lines
Below we isolate each line, say what it measures and show what it looked like across one 24-hour window.
2nd/1st Order (white line). The surface layer. First-order Greeks (8 total) include Delta, Gamma, Theta, Vega, the ones most traders already watch. Second-order Greeks (8 total) include Vanna, Charm, Vomma, Veta, the ones that measure how those sensitivities shift when multiple variables move at once.
The white line answers one question: how non-linear is the market right now?
When it is low and flat, the market is behaving simply and your basic Greeks describe most of the risk. When it climbs, cross-sensitivities are growing: Delta is moving with implied volatility (Vanna) and with time (Charm) at rates that reach your P&L and single-variable thinking stops working.
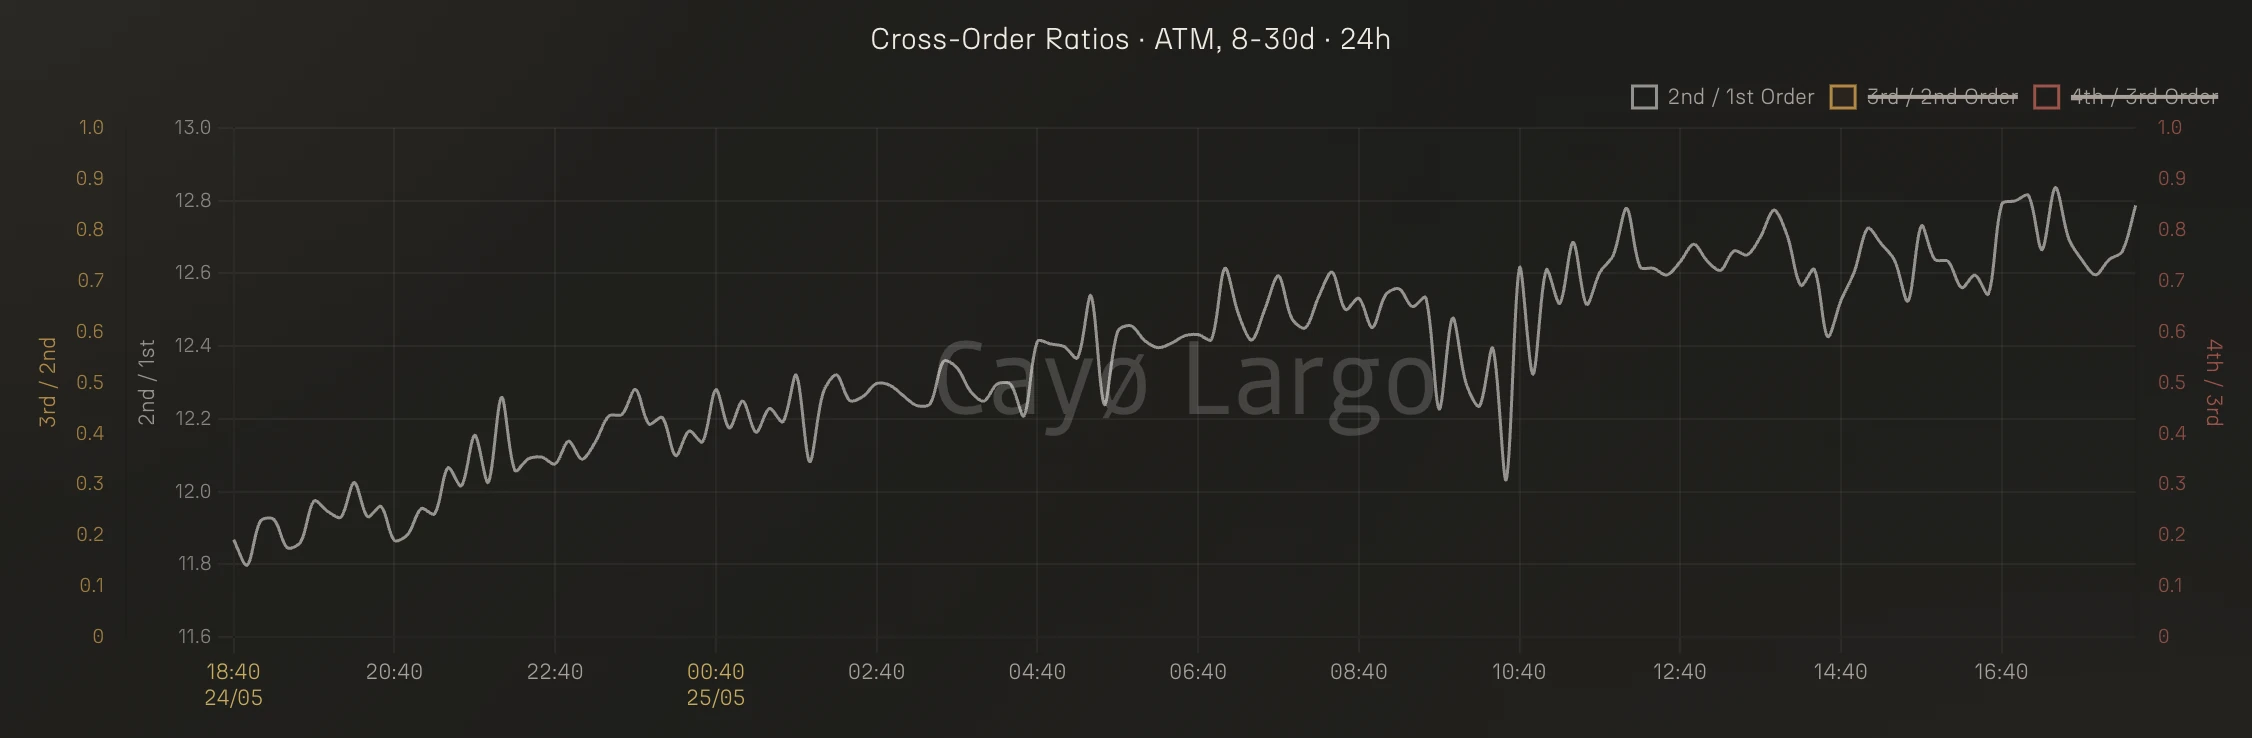
Figure 2: The white line in isolation. The 2nd/1st ratio drifts from 11.8 to 12.8 over 24 hours. A gentle upward trend, not a spike. The sensitivity layer is growing slowly. On its own, this is orderly behaviour.
3rd/2nd Order (gold line). The layer to watch. Third-order Greeks (11 total) include Speed, Color, Zomma and Ultima. These are not sensitivities, they are accelerations. Speed measures how fast Gamma is changing, Color how Gamma decays with time, Zomma how Gamma responds to vol shifts.
When the gold line rises, the second-order Greeks are themselves speeding up. This is the early warning layer, because accelerations build before a large move arrives. The market has not moved yet but the rate at which it could move is increasing. This pattern typically appears 2 to 12 hours before a significant event.
The gold line is where you start every reading. Flat: move on. Climbing: stay.
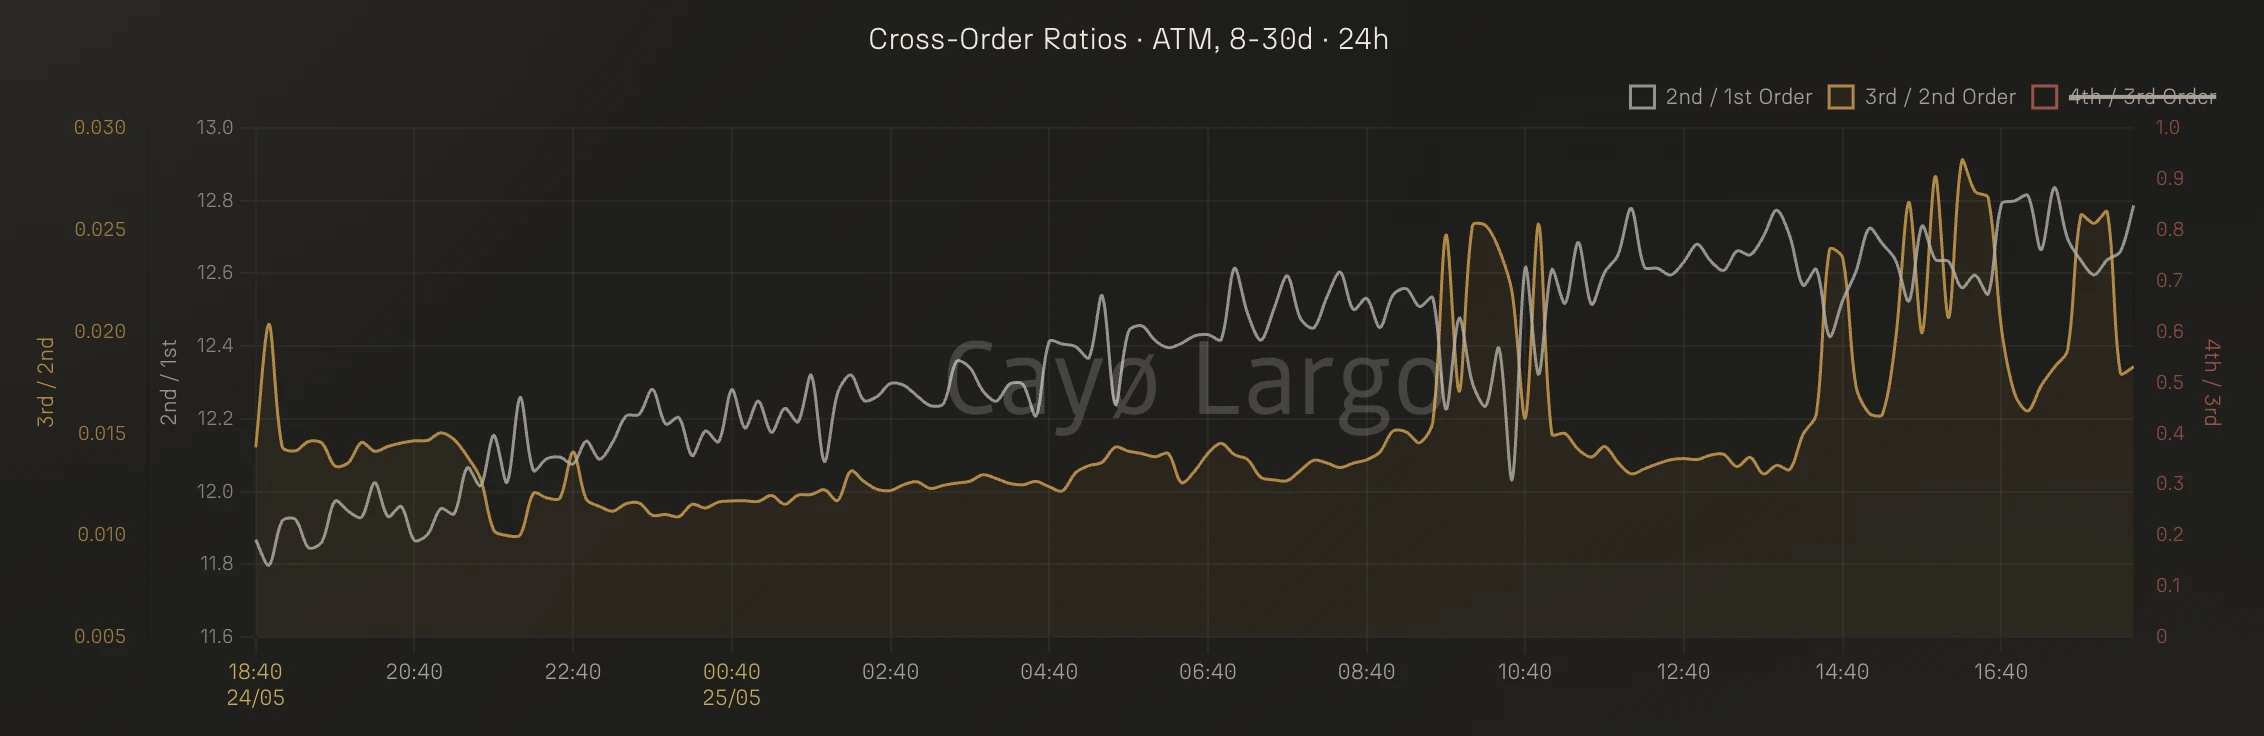
Figure 3: Add the gold line. The 3rd/2nd ratio stays flat through the overnight session, then activates sharply around 08:40 UTC. The acceleration layer is building while the white line continues its gentle drift. This divergence between layers is the pre-event tension pattern.
4th/3rd Order (red line). The deep structure. Fourth-order Greeks (10 total) include Gammega, Chronomma and Quatromma. These live at the boundary of what Black-Scholes can express, the rate of change of the rate of change of the rate of change of an option price.
This line is quiet most of the time and days can pass with barely a flicker. When it moves, the mathematical structure of the volatility surface is reorganising: flash crashes, major liquidation cascades, systemic cross-asset contagion. When the red line spikes alongside a rising gold line, the surface is restructuring at every level. Risk models built on first-order hedging are underestimating their exposure by a margin they cannot see.
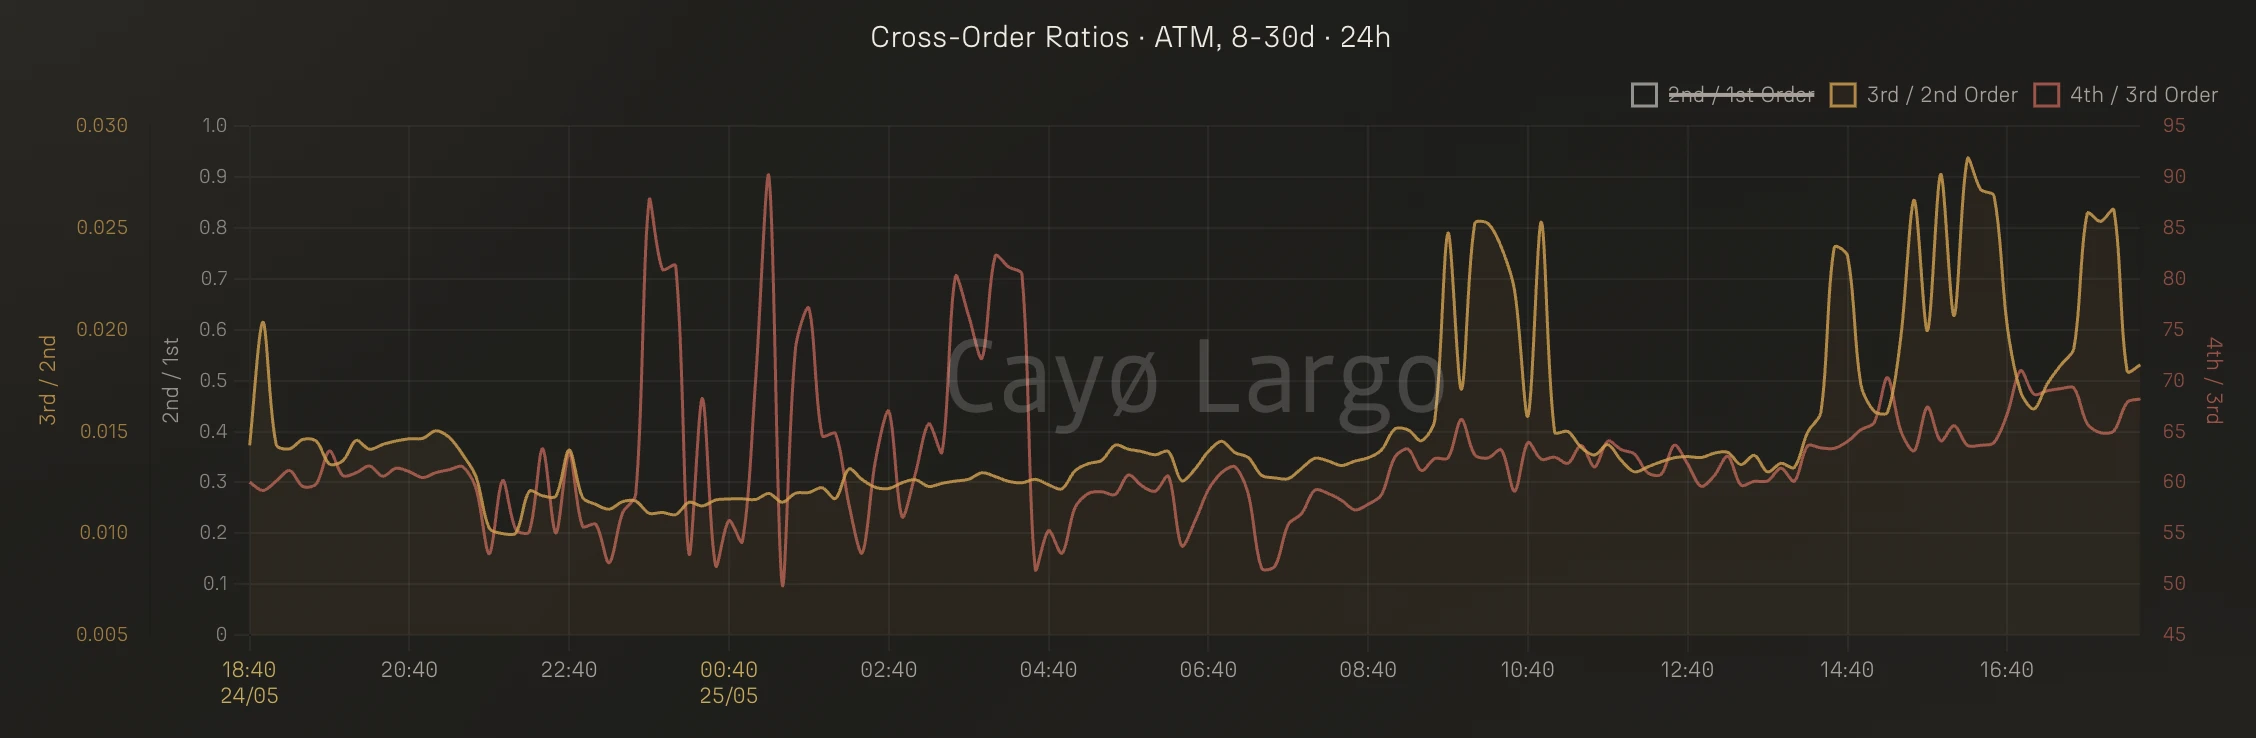
Figure 4: Add the red line. The 4th/3rd ratio fires first around 23:40 UTC on May 24, then sustains elevated levels from 08:40 UTC onward, coinciding with the gold line activation. When both acceleration and complexity layers spike together, the surface is restructuring at depth.
One more pattern: divergence. The white line drops while the gold rises, so first-order sensitivities shrink, with options becoming less responsive to single-variable moves, while accelerations grow. The market then appears calmer than it is, which is the false-quiet pattern. No chart for this one in the current window. When you see it, treat it as a warning.
Now look at Figure 1 again. Between 07:20 and 11:20 UTC on May 25, the red line surged from ~55 to ~95 while the white line held steady near 12.0. Fourth-order complexity tripled against a stable first-order baseline. The surface looked normal while the deep structure reorganised underneath it. That is what this chart is built to show you.
What Cross-Order Ratios Cannot Tell You
Direction. A rising 3rd/2nd ratio does not tell you whether the move will be up or down, only that the surface is loading energy rather than where it will release it.
Root cause. If the gold line spikes and you want to know why, you need the 37-Greek heatmap to identify which accelerations are firing. Cross-Order Ratios are the smoke detector and the heatmap is the thermal camera.
The full surface. These ratios are cohort-specific and ATM 8-30d options behave differently from deep OTM or long-dated contracts, so a flat ratio on one cohort does not mean the entire surface is calm.
Model truth. These are computed under Black-Scholes, which assumes continuous hedging, no jumps and log-normal returns and none of those hold in crypto. The ratios remain useful because they compare relative magnitudes across layers. Even if the absolute values inherit model assumptions, the ratios between orders are stable.
The lead time. We describe the acceleration layer as building 2 to 12 hours ahead of a significant move. That is what we have watched it do and it is not yet a counted base rate: we have not measured how often the gold line climbs and nothing follows. Treat the window as an observation about shape, not as a hit rate.
What to Do With This Chart
Add it to your pre-session scan, where it costs you ten seconds.
Gold line flat? The acceleration layer is quiet. Move on to other panels.
Gold line climbing? Something is building, so check the 37-Greek heatmap to find which accelerations are driving it, then tighten your hedges or reduce your exposure.
Red line firing? That is rare and when it happens the deep structure of the surface is shifting, which means your first-order Greeks are not telling you the full story.
Check it every few hours during active trading and again before and after major events, expiries and funding rate resets. The chart updates every 600 seconds but the patterns that matter develop over hours rather than minutes, so you are looking for trends and not ticks.
Three lines. One chart. A structural reading of the options surface that would take hours to reconstruct from raw Greeks.
Frequently Asked Questions
What are Cross-Order Ratios in options trading?
Cross-Order Ratios compare the total magnitude of Greeks at one derivative order against the order below it. For example, the 2nd/1st ratio divides the sum of all second-order Greek absolute values by the sum of all first-order Greeks. A rising ratio means higher-order, non-linear effects are growing relative to simpler sensitivities.
What do the three lines on the Cross-Order Ratios chart represent?
The white line (2nd/1st) shows how non-linear the market is. The gold line (3rd/2nd) shows whether accelerations are building. The red line (4th/3rd) is an ecosystem stress indicator that moves meaningfully only during major dislocations.
Why are Cross-Order Ratios useful for crypto options traders?
Standard dashboards show individual Greeks. Cross-Order Ratios compress 37 Greeks into three lines that tell you whether the market is behaving simply or whether hidden complexity is building. You do not need to understand every Greek to read the chart.
What does a rising 3rd/2nd ratio mean?
It means the acceleration layer of Greeks is growing faster than the sensitivity layer. Third-order Greeks measure how fast second-order Greeks are changing. A rising ratio flags pre-event tension because accelerations build before the move itself arrives.
How often are Cross-Order Ratios updated on Cayo Largo?
Every 10 minutes. Cayo Largo computes 37 Black-Scholes Greeks per option, aggregates them by cohort using liquidity weights and calculates the cross-order ratios for each cycle.
How many Greeks are there in options trading?
Black-Scholes produces at least 37 measurable Greeks across four derivative orders. Most platforms show 4 or 5. Cayo Largo computes all 37 for BTC, ETH, SOL, XRP, AVAX and TRX options on Deribit, updated every 10 minutes.
What is the difference between second-order and third-order Greeks?
Second-order Greeks (Vanna, Charm, Vomma, Veta) measure how first-order sensitivities shift when two variables move together. Third-order Greeks (Speed, Color, Zomma, Ultima) measure how fast those second-order shifts are accelerating. A rising 3rd/2nd ratio means accelerations are outpacing sensitivities.
Related Articles
Where the ETH Gamma Wall Cracks: Finding the Breakout Strike
You open the Dual Gamma heatmap for ETH and see a thick wall at $2,100. Impenetrable. Switch to Lightning and the wall shows where it cracks.
Gammega at +3.5σ: When Spot and IV Pull Apart
BTC Gammega hit +3.5σ over 30 hours as spot rallied and IV fell. Fourth-order stress invisible to standard dashboards. Gamma exploded 30 hours later.
Why Hedging Gamma and Vega Separately Overhedges Your Book
Speed/Gamma and Veta/Vega trace a parabola under Black-Scholes. Gamma curvature and vega decay are coupled. Hedging them independently means over-hedging.