Where the ETH Gamma Wall Cracks: Finding the Breakout Strike
You open the Dual Gamma heatmap for ETH and see a thick wall at $2,100. Impenetrable. Switch to Lightning and the wall shows where it cracks.
Lightning turns a pinning zone into a directional read. Not just "pinned here" but "pinned here, with a solid floor and a fragile ceiling."
The Strike Derivative Ladder
Most Greeks differentiate option value with respect to spot price, time, or implied volatility. Dual Gamma and Lightning differentiate with respect to strike price only. No reference to spot, no reference to vol. They form consecutive rungs of a single ladder:
Dual Delta measures how option value shifts when strike moves. Dual Gamma measures how that response bends. Lightning measures how that bending accelerates.
Under Black-Scholes, Dual Gamma has a closed form:
where is the standard normal density, is implied volatility, is time to expiry, is the risk-free rate and is:
The shape is a bell curve centred near the at-the-money strike and one option in isolation tells you very little. The Greek Exposure Surface panel aggregates it across the book. For each strike at each 10-minute snapshot, it sums Dual Gamma across every live option, weighted by open interest and signed by side:
The sum runs across all expiries. The result is the pinning field, a signed surface showing where strike-level curvature accumulates. Dense clusters mark strikes where dealers face the steepest gradient and must re-hedge most aggressively.
Lightning is one rung higher and we derive it from the Dual Gamma closed form by differentiating with respect to . Write Dual Gamma as a product of two terms that both depend on :
Apply the product rule to :
The first term requires two ingredients. The derivative of the standard normal density is and depends on strike through , giving:
Chain them together:
Substitute back into the product rule:
Multiply by the constant prefactor and Lightning falls out:
The entire character of Lightning lives in that parenthetical factor. When , Lightning is positive, meaning the Dual Gamma field is still rising as you move to higher strikes. When , Lightning flips negative, meaning the field is falling. The zero crossing, where , marks the exact strike where the pinning field peaks. Everything before the peak is a rising slope and everything after it is a falling slope. Lightning tells you which side you are on.
Lightning exposure is aggregated the same way:
Two Greeks, two heatmaps. One shows the pinning field, the other its slope.
The Pinning Field
A pinning zone forms when dealers hold large offsetting gamma positions at a strike, so any move away from it forces them to hedge in the opposite direction, buying dips and selling rallies, which pushes price back toward the strike. The stronger the aggregate Dual Gamma at a level, the stronger the magnet. The GEX Landscape ranks those magnets per expiry and marks the zone they form.
Both heatmaps below come from the Greek Exposure Surface panel, with strike price on the vertical axis and time on the horizontal. The light pink line is ETH spot rate. Blue encodes negative exposure, red positive, black near zero. A 6-hour forward projection (past the dashed "NOW" line) extrapolates time decay.
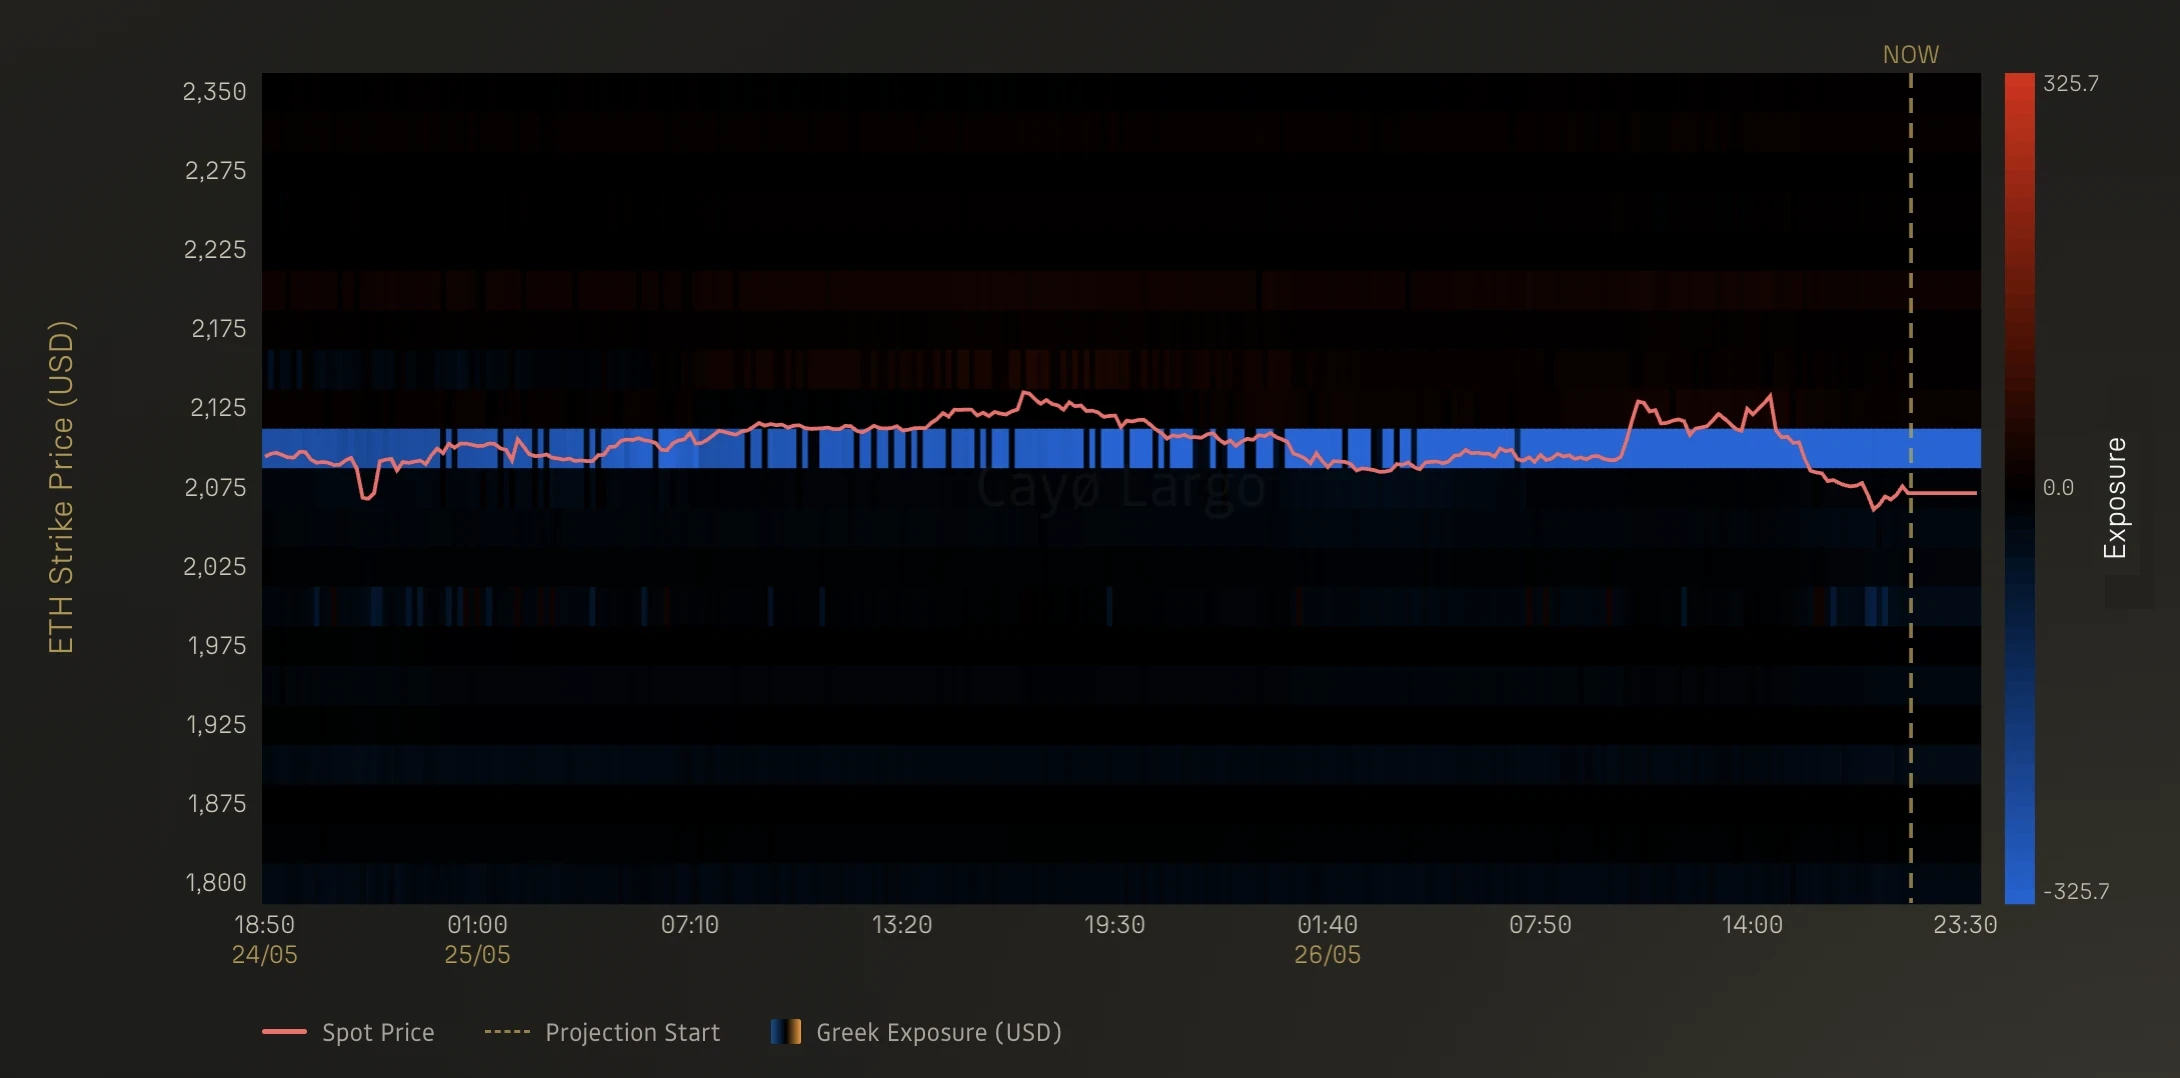
Figure 1: Dual Gamma x OI, ETH, 24H window ending May 26 2026. Net exposure across all strikes. The dense blue band around 2,100 is the pinning field. Spot (pink) oscillates inside it.
If we select Dual Gamma x OI and look at ETH over 24 hours, a dense band of blue sits at $2,100, directly around spot. This is the pinning field and every put whose open interest crosses these strikes adds curvature to the aggregate. The put side dominates (blue), which means the steepest gradient comes from put OI. Dealers holding these positions face a wall of re-hedging pressure. When price drifts toward the edge, the aggregate flow pushes it back. ETH spent most of the 24-hour window oscillating around this wall. The Dual Gamma field explains why.
The second thing to notice is temporal stability. The band barely changes over 24 hours, same location and same intensity, because open interest shifts gradually and the pinning field moves with it.
The third thing to notice is what the field hides. The blue zone spans roughly from $2,050 to $2,150. You can see black gaps inside it where call and put OI roughly cancel but those are just zero-crossing artefacts, not structural features. The real question is different: where inside this band does the pinning gradient reverse direction? Where does the field go from strengthening to weakening? Dual Gamma cannot answer that. It tells you the wall is thick and says nothing about where the wall changes character.
The Fracture Map
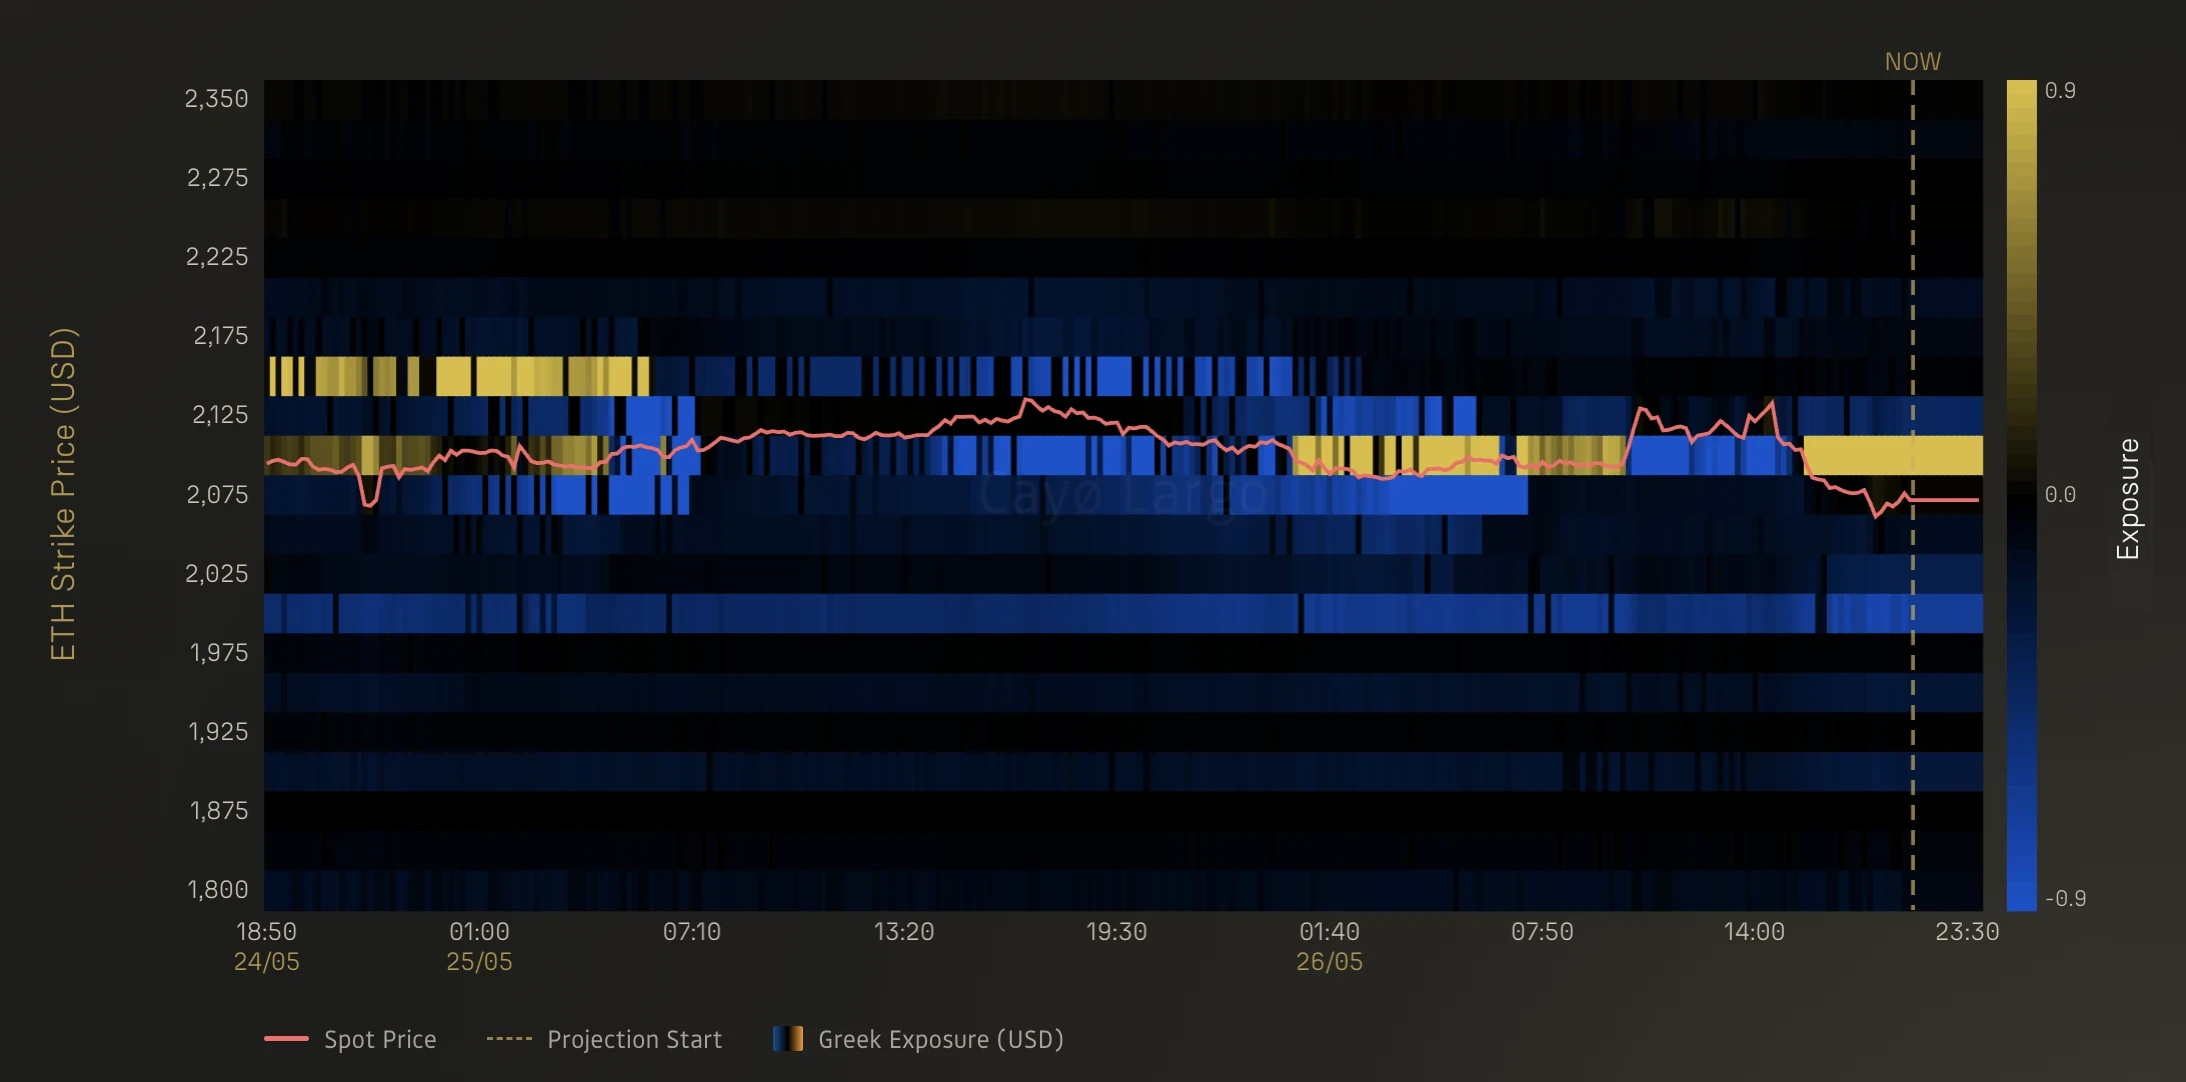
Figure 2: Lightning x OI, ETH, 24H window ending May 26 2026. Same asset, same time span. The uniform Dual Gamma band dissolves into alternating sign clusters. Each sign change is a fracture point in the pinning field.
Switch to Lightning x OI, same asset and same 24-hour window on the same OI weighting and the exposure scale drops from ±325 to ±0.9. Before anyone dismisses that as noise, note that the two numbers are not in the same units. Dual Gamma × OI carries units of contracts/USD (second derivative of price with respect to strike, times open interest). Lightning × OI carries units of contracts/USD² (one more strike differentiation). They differ by a factor of . Comparing ±325 to ±0.9 across the two views is like comparing metres per second to metres per second squared. The magnitudes are not comparable, so read Lightning for its sign pattern, not its absolute size.
The uniform blue band from Figure 1 dissolves. Three features emerge in its place.
| • | Alternating sign bands at $2,100 to $2,150. Where Dual Gamma showed a single solid block, Lightning shows rapid transitions between positive (yellow) and negative (blue). Each sign change marks a strike where the Dual Gamma gradient reverses direction. These are the fracture points. The pinning field is not a smooth dome around $2,100. It is a jagged ridge with notches. Lightning resolves the notches. |
| • | Isolated negative clusters below $2,050. Blue signals appear near $2,000 that were invisible in the Dual Gamma view. These mark strikes where the Dual Gamma field drops off sharply. If spot were to fall below the main pinning zone, Lightning shows how fast the floor disappears. |
| • | Greater temporal variation. The Dual Gamma field was near-static over 24 hours. Lightning's pattern shifts block by block. Fracture points appear, hold for a few hours, migrate to adjacent strikes. The pinning field is slow bedrock. Lightning captures the fault lines that evolve across it. |
These features show where the gradient changes and Lightning's sign tells you what the gradient means. The rule works as a gradient test. If price moves toward a region where the Dual Gamma field strengthens, pinning intensifies and the move stalls and if it moves toward a region where the field weakens, pinning fades and the move accelerates instead.
Positive Lightning () above spot () means Dual Gamma increases as you move higher. Spot rising toward that level encounters a strengthening field, so the move slows. That is a gamma wall. Negative Lightning below spot means Dual Gamma increases as you move lower (the derivative is negative, so the function rises as decreases). Spot falling toward that level encounters a strengthening field, which is another wall. Flip the signs and the field weakens in the direction of travel, which is a breakout trigger.
Apply this to Figure 2 and the blue clusters below $2,050 are negative Lightning below spot, so they are walls, protecting the downside with a steepening pinning gradient. The alternating bands at $2,100 to $2,150 contain both walls and triggers stacked within a $50 range, which is the fracture zone: the downside defended, the upside contested.
Two heatmaps, one prediction. ETH should stay pinned near $2,100, with a firm floor at $2,050 and a contested ceiling above $2,150.
The Cross-Check
So we opened a completely different panel. Options Thermography shows volume-weighted activity rather than OI-weighted exposure, a different weighting on a different pipeline answering a different question: where are traders actually placing gamma-heavy bets?
Switch the heatmap to Gamma-weighted volume. Toggle the GEX overlay for the May 26 expiry. Four lines appear on top of the volume surface.
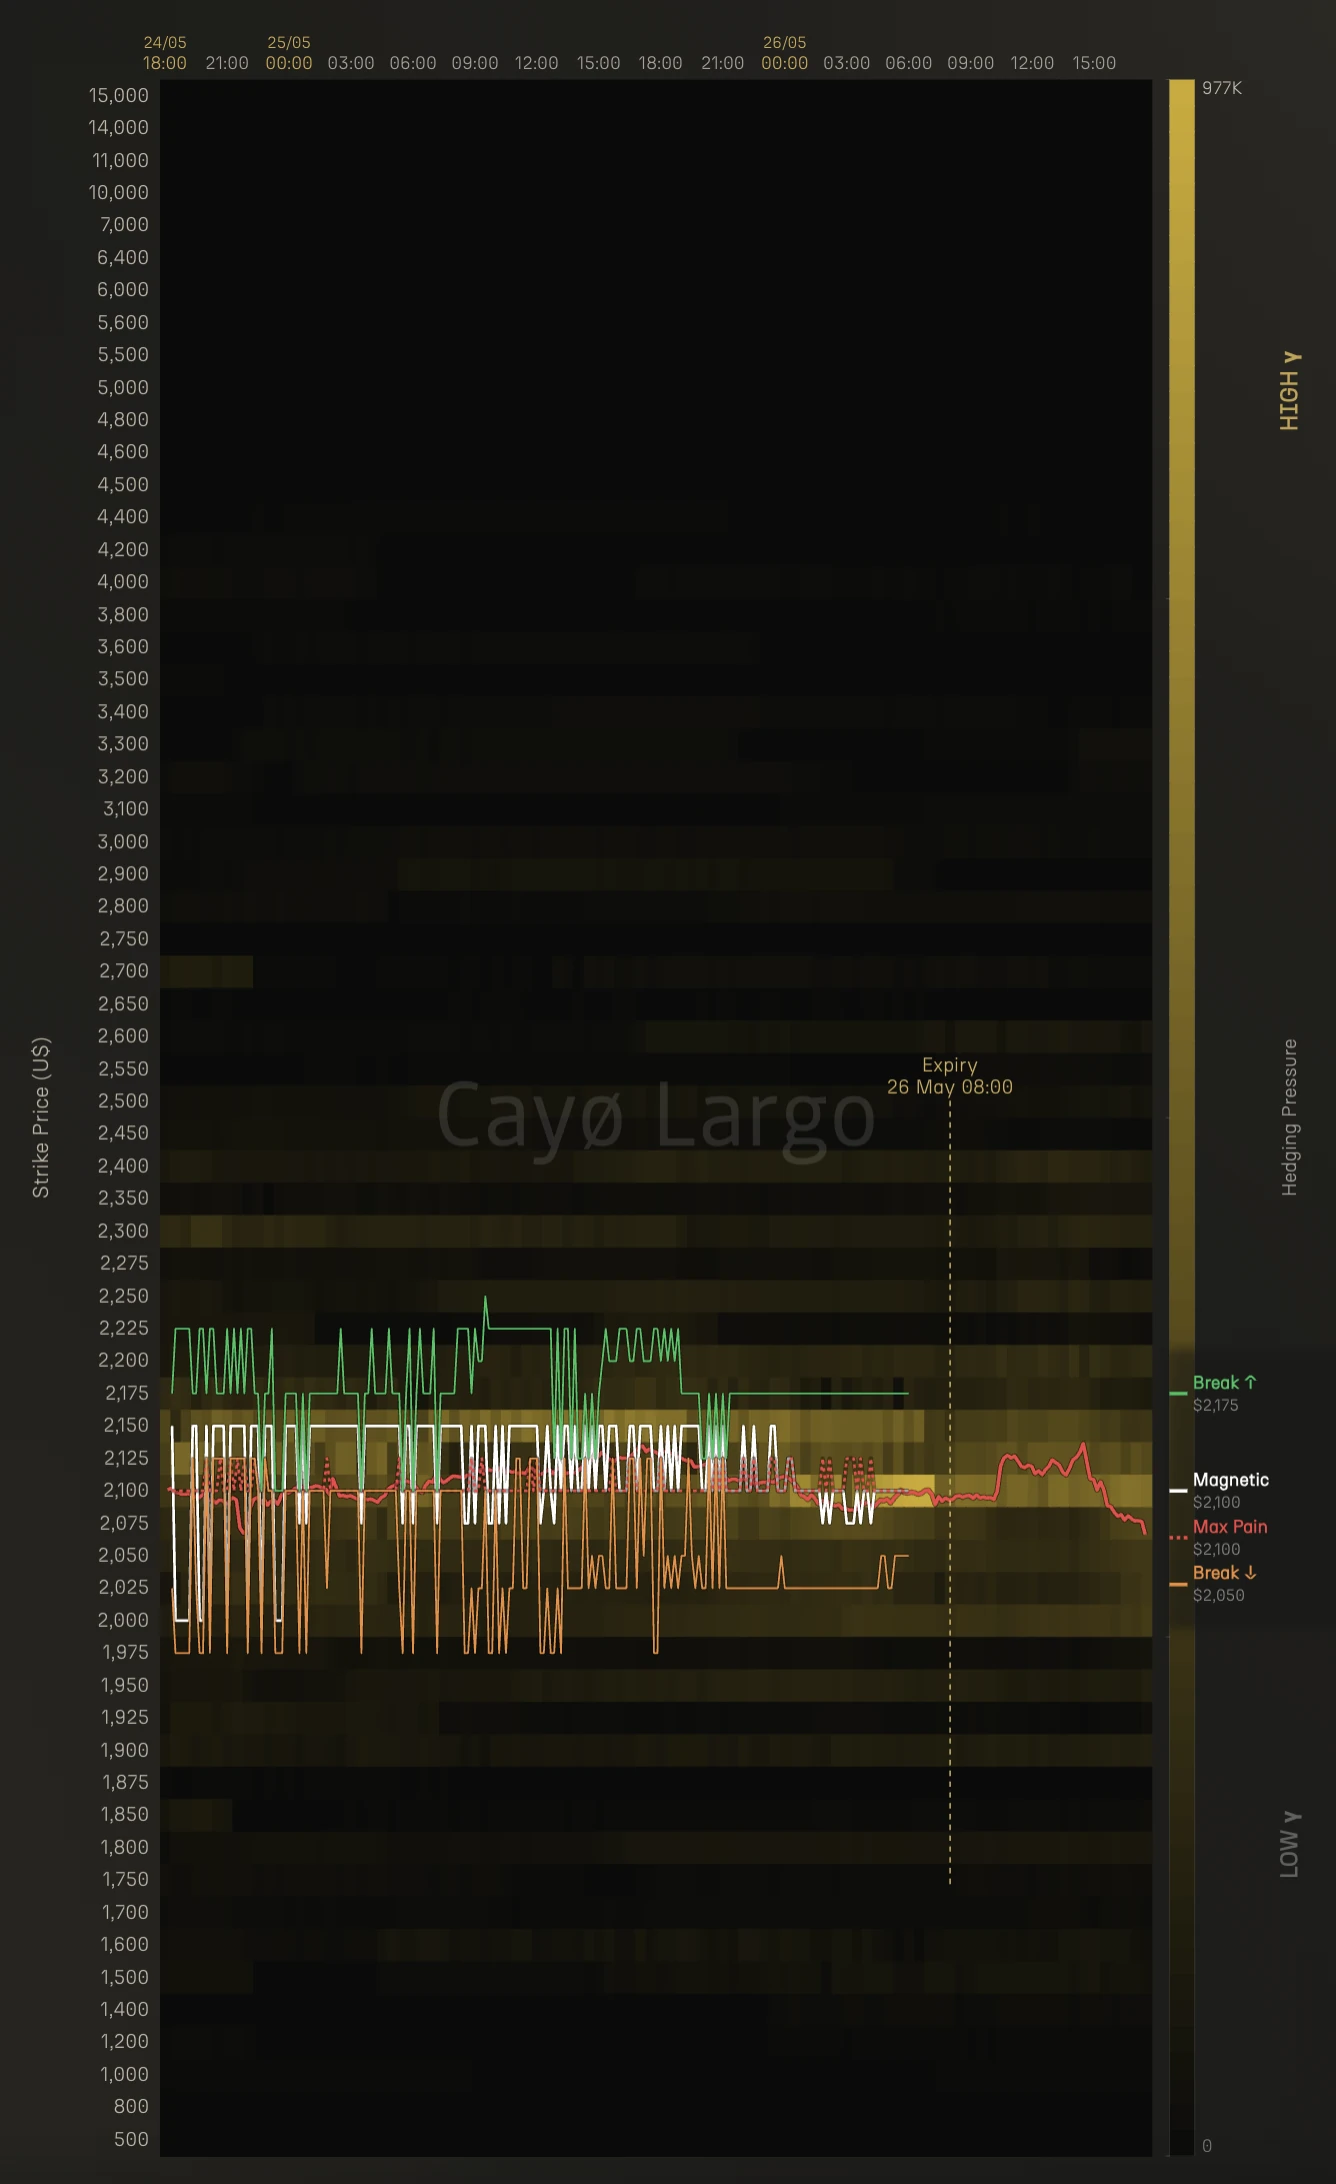
Figure 3: Options Thermography, ETH, 48H window. Gamma-weighted volume with GEX overlay for the May 26 expiry. Bright cells mark strikes where a spot move forces the largest hedging adjustments. Magnetic strike and max pain converge at $2,100. The breakout levels (green $2,175, orange $2,050) bracket where gamma heat fades.
Start at the centre. The magnetic strike (white line) and max pain (red dotted) both sit at $2,100. Two independent calculations, from different methodologies, point to the same level. That is the Dual Gamma peak from Figure 1, now echoed by volume-weighted gamma activity. Bright cells fill the $2,075 to $2,150 range, so traders are active in exactly the zone Dual Gamma marked as the pinning field.
Now look at the floor. The lower breakout (orange) oscillates between $1,975 and $2,125 but keeps returning to the $2,050 area. It is noisy, yet it never collapses far below that level and Lightning showed negative clusters below $2,050 in Figure 2, walls that strengthen against any downward move. The volume surface agrees, with gamma-weighted trading below $2,050 dropping off sharply. The floor bends but holds.
Now look at the ceiling, where the upper breakout (green) tells a different story, jumping between $2,100 and $2,225 throughout the window and settling 12 hours before expiry. Compare that to Figure 2, where Lightning showed rapid sign alternation at $2,100 to $2,150. The jittery breakout line is that fracture zone made visible as a single derived boundary. It cannot decide where to sit because Lightning keeps flipping between walls and triggers at adjacent strikes and every few hours the boundary shifts again as open interest redistributes.
The 26 May 08:00 expiry (dashed vertical line) adds a final layer. Before the expiry, gamma-weighted volume concentrates tightly around $2,100 to $2,150, with the magnetic and max pain lines threading through the hottest cells. After the expiry settles the field reorganises, bright cells shift and the GEX lines adjust. This is what happens when the pinning field loses a chunk of its open interest at once. The structure does not vanish, it restructures around the surviving positions.
Spot (pink line) stayed inside this envelope for the full 48-hour window, breaking neither $2,175 above nor $2,050 below.
Three panels, two weighting schemes and two kinds of Greek pointed at the same structure: a firm floor at $2,050, a contested ceiling above $2,150, a magnetic centre at $2,100. Lightning marked where the field would hold and where it would waver and price respected both.
One caveat travels with that and we would rather put it here than leave it for a reader to find. This is a single 48-hour window on a single coin, read after the fact. It shows that the three panels agree and that the agreement was informative on this occasion. It does not measure how often the fracture zone calls the break correctly, because we have not run that count yet. Read the episode as a worked example of the method, not as its track record.
What This Changes for You
Most traders who use gamma exposure see a binary picture. Pinning zone or no pinning zone. Range-bound or trending. That reading is correct but incomplete. It is like knowing a river has a dam without knowing which side of the dam is cracked.
Lightning turns a pinning zone into a directional read. In the ETH case above, Dual Gamma said "pinned at $2,100." Lightning said "pinned at $2,100, with a solid floor at $2,050 and a fragile ceiling above $2,150." That is not the same information. The first is a range. The second is a bias.
Three practical implications flow from this for crypto-options traders:
| • | Directional lean inside pinning regimes: Walls on one side, fracture zones on the other. The fragile side is where breakouts originate. Use that asymmetry to size positions, place spreads, or pick the direction to watch when the range compresses. |
| • | Fracture migration as an intraday signal: Dual Gamma barely moved over 24 hours. Lightning shifted block by block. A wall at $2,150 at 09:00 UTC can become a trigger by 15:00 UTC as open interest redistributes. Both heatmaps update every 10 minutes. Check Lightning every few hours during active trading to catch the migration. |
| • | Cross-panel confirmation: Lightning's fracture map and the thermography's GEX overlay use different data, different weighting and different Greeks. When both point to the same floor and the same contested ceiling, the structure is built into the market, not an artefact of one methodology. |
Frequently Asked Questions
What is Dual Gamma in options trading?
Dual Gamma is the second derivative of option price with respect to strike price (d2V/dK2). It measures how the option's sensitivity to strike changes as you move across adjacent strikes. High Dual Gamma at a strike means the gamma gradient is steep there, forcing dealers to re-hedge aggressively when price crosses that level. This creates pinning zones. It is not the same as standard Gamma (d2V/dS2), which differentiates with respect to spot price.
What is Lightning Greek in options?
Lightning is the third derivative of option price with respect to strike price (d3V/dK3). It is the rate of change of Dual Gamma across strikes, revealing where the pinning field strengthens, weakens, or changes direction. Lightning spikes mark the fracture points in the gamma surface where the hedging regime flips. Under Black-Scholes, Lightning has a closed form that depends on the standard normal density, strike, implied volatility and time to expiry.
What is the difference between Gamma and Dual Gamma?
Gamma (d2V/dS2) measures how Delta changes when the spot price moves. Dual Gamma (d2V/dK2) measures how the option's value curves across the strike axis. Gamma tells you about spot-price risk. Dual Gamma tells you about the pinning field that dealers face at each strike. They use the same second-derivative order but differentiate with respect to different variables, so they answer different questions.
What happens when a gamma wall breaks in crypto options?
A gamma wall breaks when the Dual Gamma pinning field weakens faster than new hedging flow can sustain it. Lightning Greek reveals where these fracture points form. Where Lightning changes sign, the pinning gradient reverses direction. Price can accelerate through a negative-Lightning zone because dealer hedging no longer pushes it back. Breakouts originate from the side of the pinning zone where Lightning shows fractures rather than solid walls.
How does gamma pinning work in crypto options?
When dealers hold large gamma positions at a strike, any price move away from that strike forces them to hedge in the opposite direction, buying dips and selling rallies. This creates a magnet effect that pins price to the strike. The stronger the aggregate Dual Gamma exposure at a level, the stronger the pinning. Cayo Largo computes Dual Gamma exposure across all live options on Deribit, weighted by open interest, updated every 10 minutes for BTC, ETH, SOL, XRP, AVAX and TRX.
How does Lightning supplement Dual Gamma?
Dual Gamma shows where the pinning field is concentrated but cannot resolve structure within that zone. Lightning, as the gradient of Dual Gamma, reveals where the field transitions from strong to weak. Where Lightning changes sign, you find the boundaries between pinning and release. This turns a binary pinning read (pinned or not) into a directional one (pinned with a solid floor and a fragile ceiling).
Where can I see Lightning and Dual Gamma on Cayo Largo?
Both Greeks appear in the Greek Exposure Surface panel, which displays OI-weighted Greek exposure across the strike grid over time. Select Dual Gamma x OI or Lightning x OI from the Greek dropdown. The panel includes a forward projection that extrapolates each expiry's time decay to show how the field shifts over the next few hours. Cayo Largo computes all 37 Black-Scholes Greeks for six coins on Deribit, updated every 10 minutes.
Related Articles
Gammega at +3.5σ: When Spot and IV Pull Apart
BTC Gammega hit +3.5σ over 30 hours as spot rallied and IV fell. Fourth-order stress invisible to standard dashboards. Gamma exploded 30 hours later.
The 37-Greek Compression: Options Surface in Three Lines
37 Greeks compressed into three lines. White shows non-linearity. Gold flags pre-event tension. Red fires during structural stress. The ratios, the maths behind them and how to read the surface off a single panel.
Why Hedging Gamma and Vega Separately Overhedges Your Book
Speed/Gamma and Veta/Vega trace a parabola under Black-Scholes. Gamma curvature and vega decay are coupled. Hedging them independently means over-hedging.