Does Volatility Rise After a Deribit Options Expiry?
Once an options expiry settles, the belief goes that the dealer hedging falls away and crypto starts moving more. We measured 1,224 Deribit settlements on its six coins over the last 7 months. Crypto moves more after the 08:00 UTC settlement; on Fridays, by the same amount however much of the book expires. The settlement hour explains why.
Friday 25 September, 08:00 UTC. The BTC quarterly settled with 14.2 billion USD of open interest, a third of everything outstanding on the coin at Deribit. By the afternoon Derive Insights was explaining on X what that means for the hedges: a block of dealer gamma had just expired, whatever damping or amplifying it was doing was gone and the market was "back in price discovery mode". Over the next 12 hours BTC's realized volatility ran at 45.9%, against 27.4% in the 12 hours before. It looks like the explanation proving itself in real time.
We wanted to know whether it does that on average or whether that afternoon would have been busy anyway. The belief is old and widely repeated. In 2023 an influential options trader wrote on Deribit Insights that a low-volatility regime could hold "at least until the options expiration on Friday", which is the same idea seen from the other side: the expiry as a lock that keeps the market quiet until it opens.
In this note we first define the three things the belief rests on, using the real data from that Friday: how a Deribit option settles, why a dealer's gamma can hold a price in place and how realized volatility is measured. Then we read every Deribit settlement on six coins from March to September 2026, 1,224 of them. The question is simple: are the hours after a big expiry busier than the hours after a small one? We finish with where an expiry's footprint is more likely to be found and with the limits of what we measured.
What happens at 08:00 UTC on Deribit?
Let's start where the options end. Every Deribit option settles in cash. Nothing is delivered. At expiry, an in-the-money option pays its holder the difference between the strike and a single reference price called the delivery price. An out-of-the-money option pays nothing. The delivery prices Deribit publishes through its API are exactly those reference prices, one per index per day.
The delivery price is not the price at 08:00. It is an average of the Deribit index over the half hour before it:
where is the delivery price for expiry , is the index at sampling time and is the number of samples in the window. Averaging makes the settlement expensive to push around. Moving the result means moving the index for 30 minutes, not for a second.
We can check this against our own archive. On 25 September our 30 one-minute BTC index prints between 07:30 and 08:00 average 83,932.29 USD. Deribit's published delivery price is 83,930.84 USD, a difference of 1.45 USD. ETH matches to eight cents: 2,671.49 USD against 2,671.41 USD. The index at 08:00 itself was 84,037.05 USD. That is more than 100 USD away from both, which is why the averaging window matters.
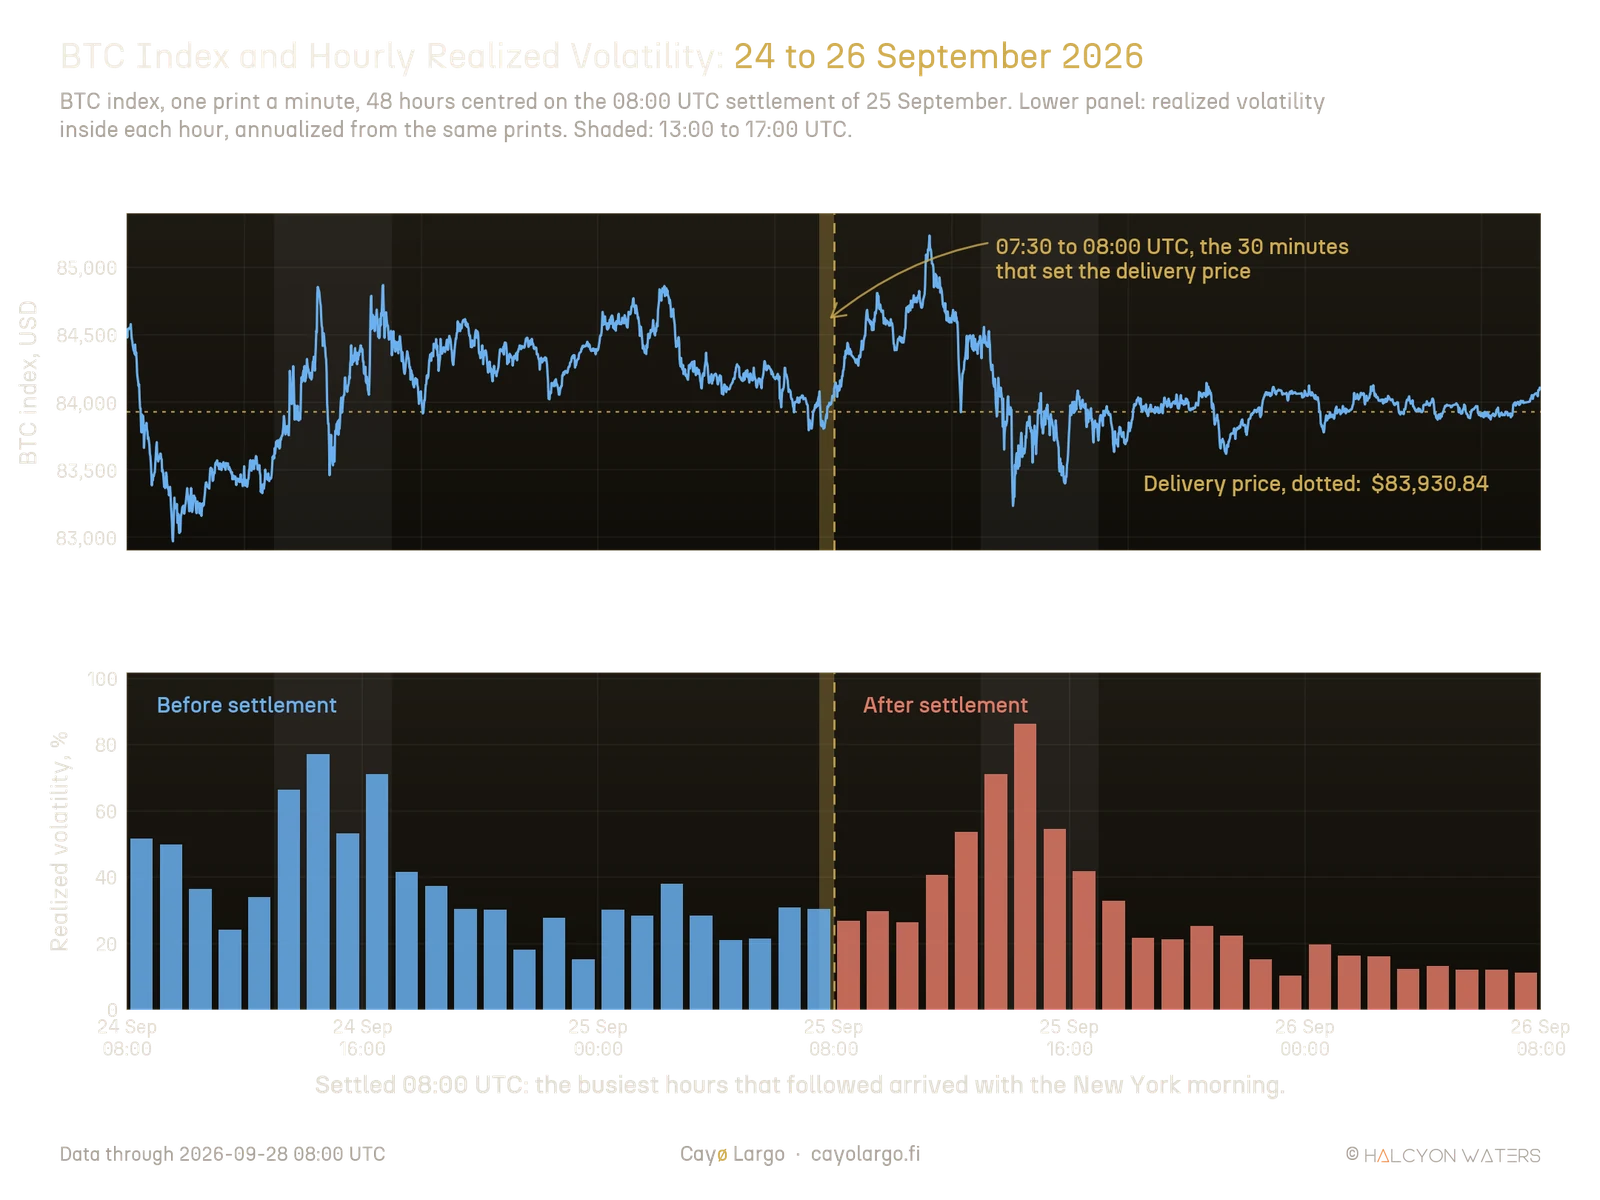
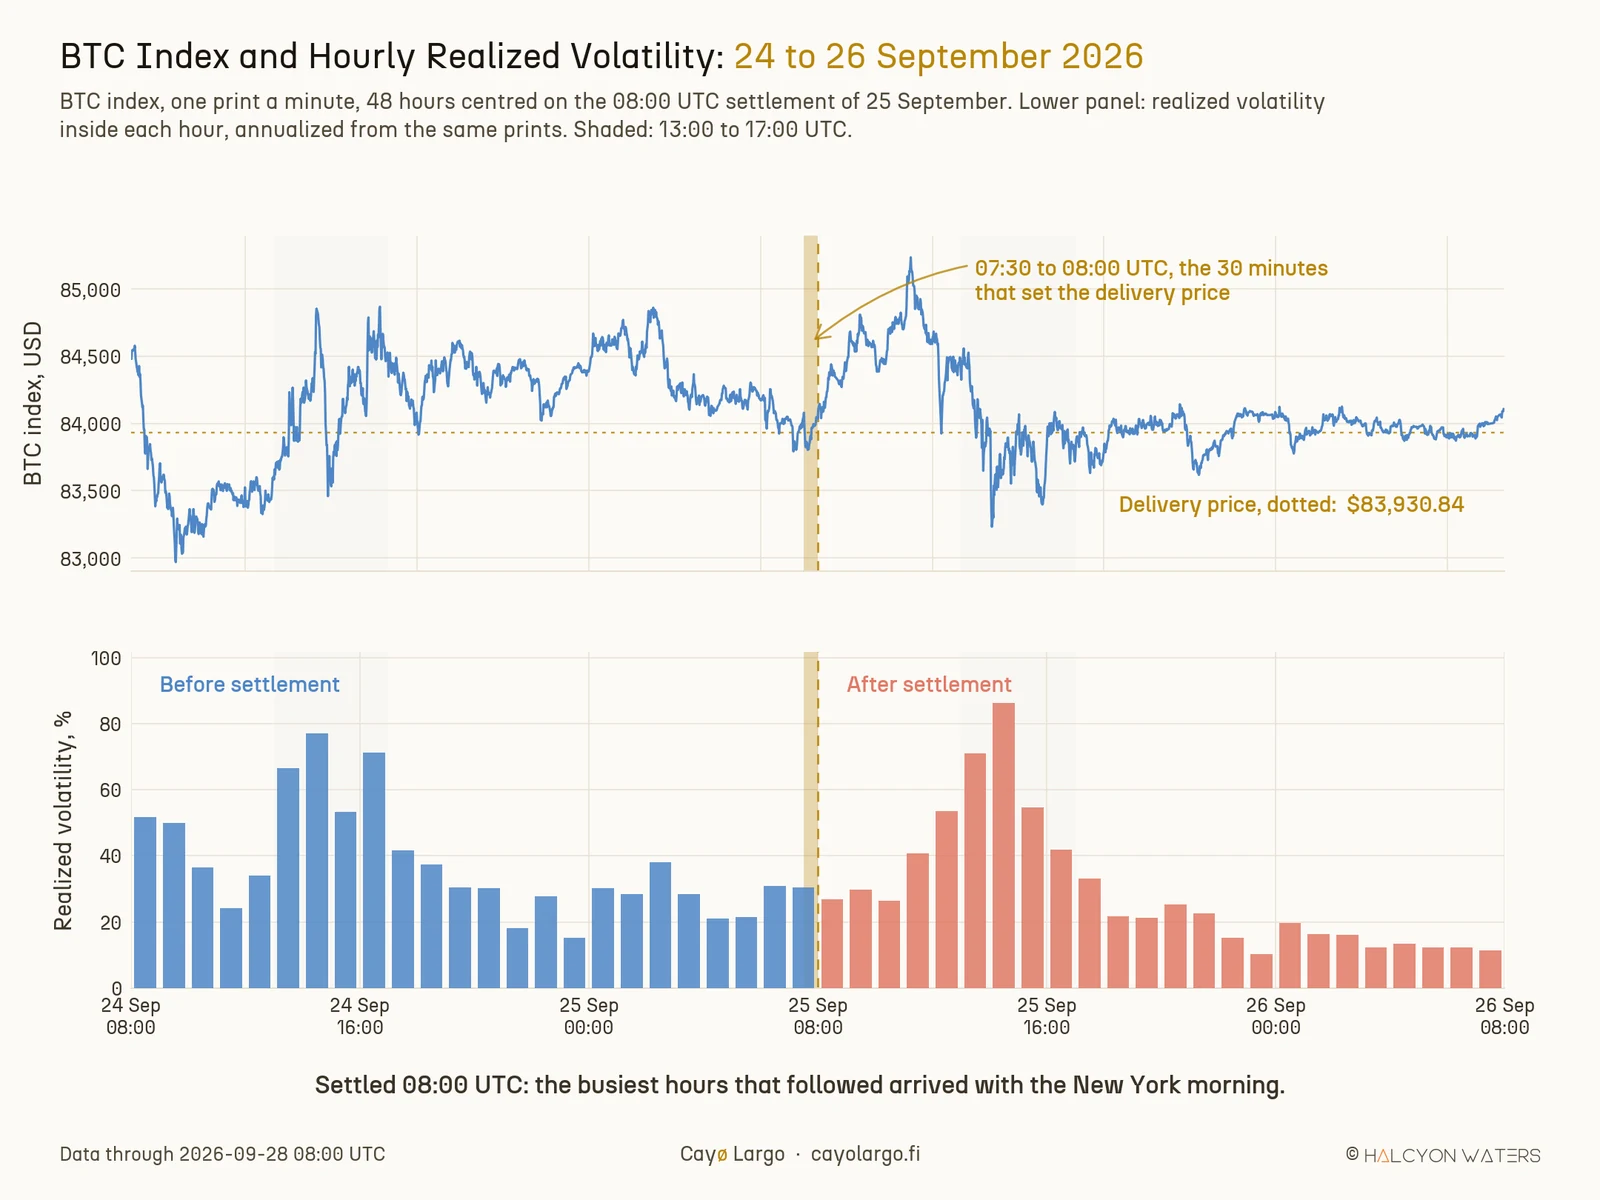
Figure 1: The BTC quarterly of 25 September 2026, one index print a minute. The gold strip is the half hour that set the delivery price. Below, realized volatility inside each hour. The busiest hours after the settlement arrived in the same 13:00 to 17:00 UTC stretch as the busiest hours the day before, when nothing large expired.
Have a look at the lower panel before you read further. The tallest coral bars after the settlement sit in the grey afternoon strip. The tallest blue bars the day before sit there too, when no quarterly was anywhere near expiry. That coincidence is the whole question of this note, seen on one day.
Why dealer gamma could hold a price in place
A market maker who sells an option usually does not want the directional bet that comes with it. It hedges the bet away by trading the underlying. The size of that hedge is the option's delta, . Delta itself moves as spot moves. Gamma is the rate at which it moves, , so keeping the hedge right after a spot move of means trading
where is the change in the hedge in units of the coin, is the net gamma of the dealer's whole option position and is the move in spot. The minus sign is the part that matters.
A dealer who is long gamma trades against the move. When price rises the hedge says sell, when it falls the hedge says buy. Summed across a large book, that flow leans on every move and pins price near strikes where the gamma is concentrated. A dealer who is short gamma trades with the move and adds fuel to it. Our worked case study of a BTC gamma exposure profile walks through how that positioning is read strike by strike.
At settlement those options stop existing and their gamma goes with them. That is the mechanism behind the belief. It is a real one. If you have ever watched a coin sit glued to a big strike into a Friday, you have seen it at work. If a large long-gamma position had been holding the price down, its disappearance should be followed by more movement. If a short-gamma position had been amplifying it, by less. Either way the expiry should leave a mark, larger for a larger expiry.
How we measure realized volatility?
Realized volatility (RV) is the annualized standard deviation of returns the market actually delivered. Implied volatility is what an option charges for them in advance. We compute it from 1-minute log returns of the Deribit index inside a window:
where is the index at the end of the -th minute inside the window from to , is the number of minutes and is the number of minutes in a year. On that Friday, 24 hours before the settlement BTC realized 40.2%. In the 24 hours after, it realized 34.4%. The 12-hour comparison says the market woke up while the 24-hour one says it went to sleep. Both are true, which is the first sign that the window is doing some of the talking.
The crypto day has a shape
Crypto trades around the clock but not evenly around it. We took every weekday from March to September 2026 and measured, for each coin, how much volatility lands in each UTC hour relative to that coin's own daily average.
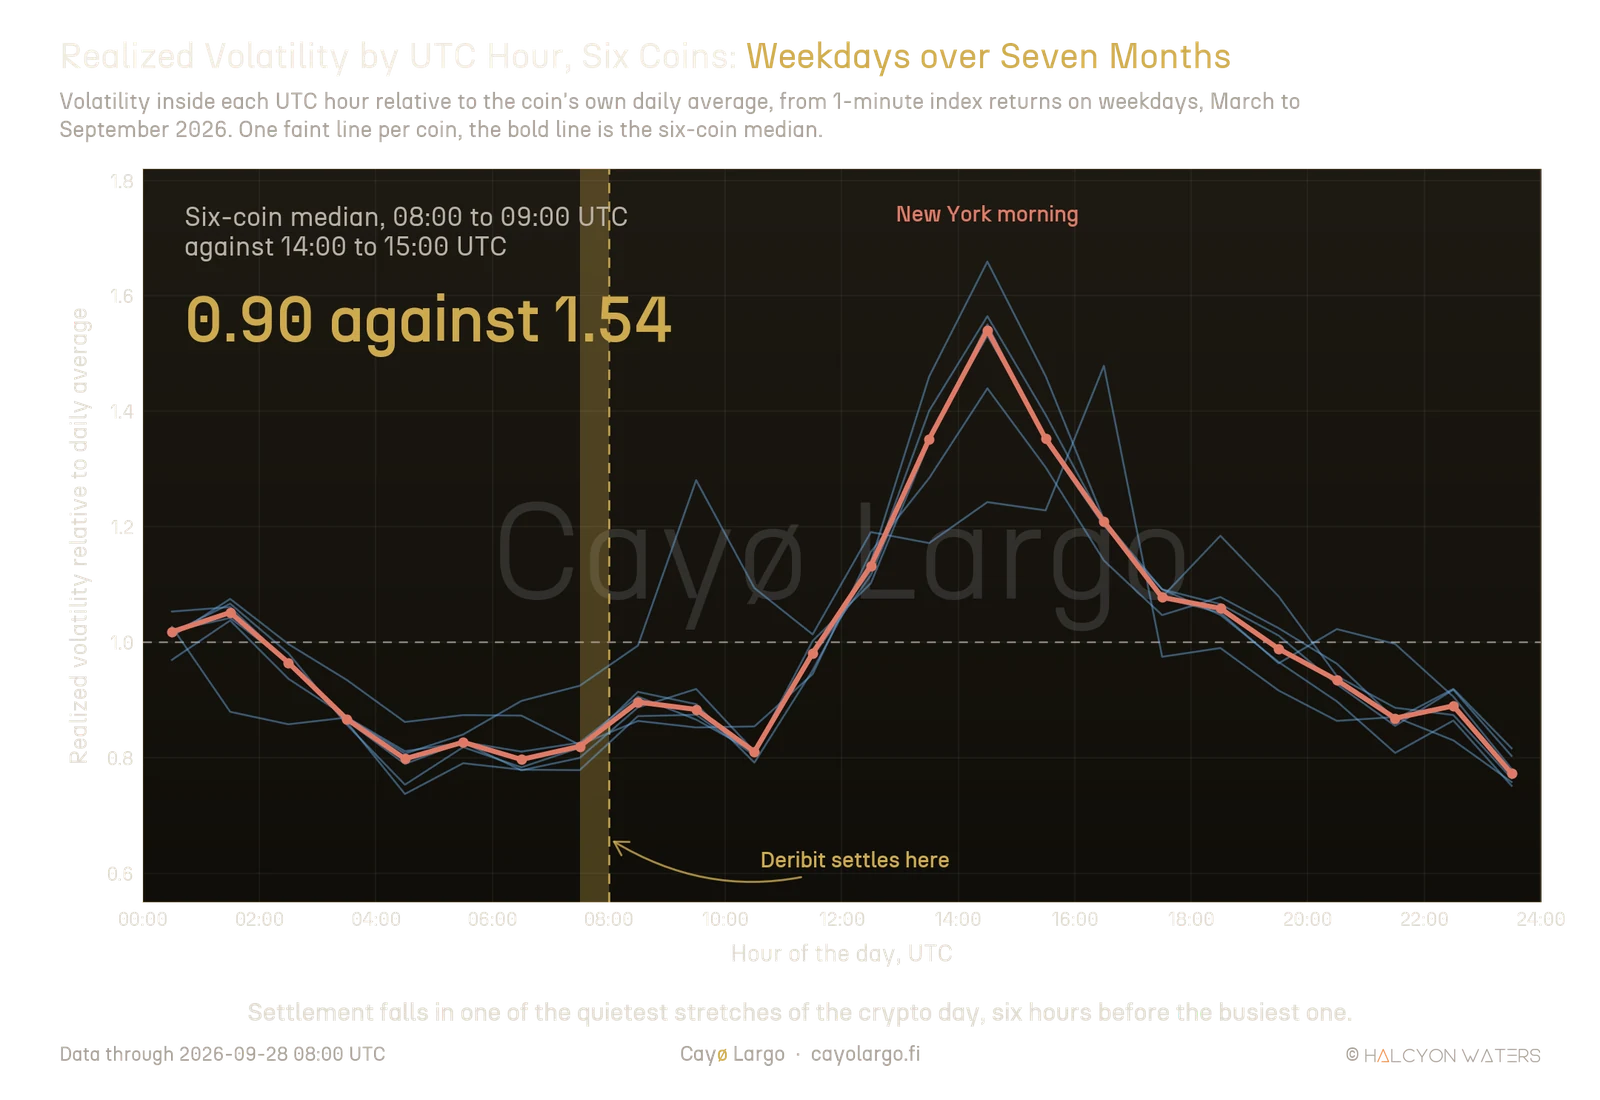
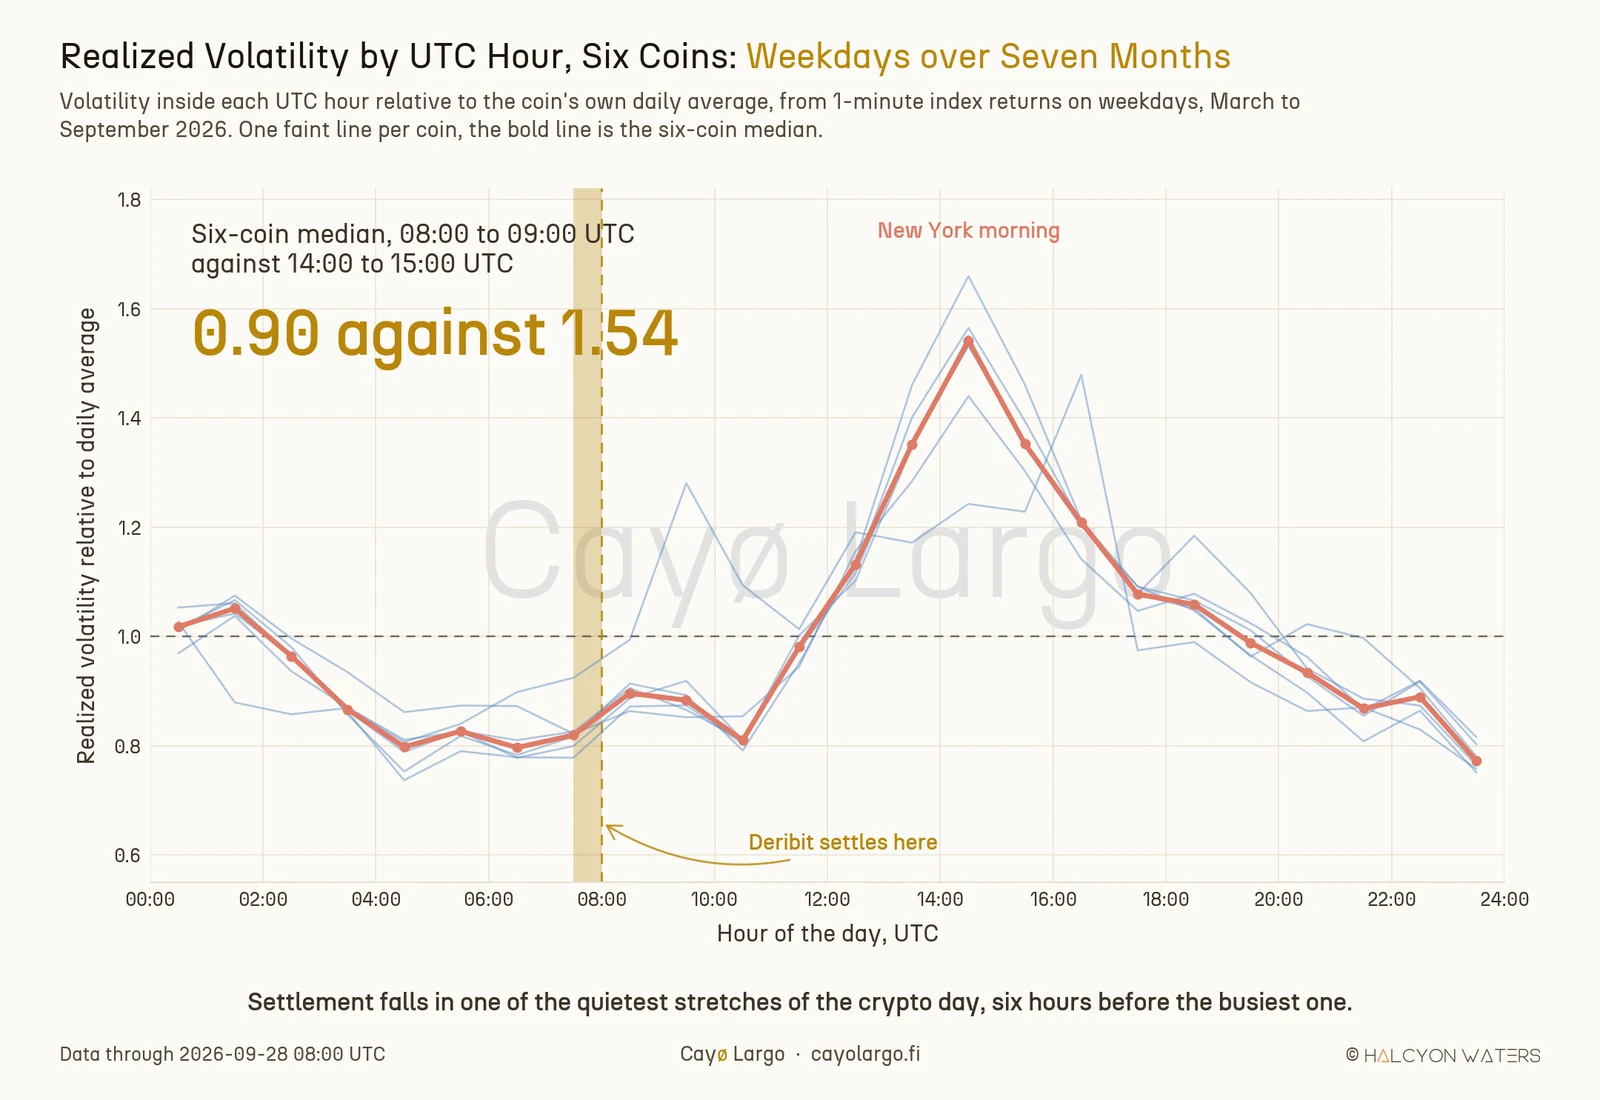
Figure 2: Realized volatility by hour of the day, weekdays, relative to each coin's daily average, from 1-minute returns. Deribit settles in the flat trough between Asia and New York. The peak comes six hours later. The one line that departs from the pack in the morning is TRX, which keeps a flatter day.
Between 08:00 and 10:00 UTC, BTC, ETH, SOL, XRP and AVAX realize 0.85 to 0.92 of their daily average. Between 14:00 and 15:00 UTC they realize 1.44 to 1.66. TRX keeps a flatter day than the other five. The median across the six coins is 0.90 in the settlement hour, i.e. 08:00 to 09:00 UTC, against 1.54 in the busiest one.
That shape loads the comparison before a single option expires. Compare the twelve hours after 08:00 with the twelve before it and you are putting the whole New York morning against the Asian night. Any expiry, of any size, is followed by a busier half day than the one that led into it, for the same reason a boat leaving harbor at slack water meets the tide an hour later. The real question is whether a big expiry adds anything to that rise.
Every expiry, big and small
We sorted the 1,224 settlements by how much of the coin's book was expiring, measured at the 06:00 UTC cycle two hours before settlement. Most days that is a daily expiry carrying about 1% of open interest. Fridays carry the weekly. The last Friday of the month carries the monthly, which four times a year is also the quarterly.
| Expiry, share expiring | Settlements (dates) | 12 hours | 24 hours |
|---|---|---|---|
| Midweek daily, 0.9% | 684 (114) | 1.25 (77%) | 1.00 (50%) |
| Weekend daily, 1.0% | 360 (60) | 1.06 (58%) | 0.95 (46%) |
| Weekly Friday, 7.1% | 138 (23) | 1.29 (89%) | 0.92 (37%) |
| Monthly, 27.4% | 24 (4) | 1.49 (100%) | 0.92 (33%) |
| Quarterly, 46.3% | 18 (3) | 1.28 (100%) | 0.92 (39%) |
Each cell under 12 hours and 24 hours gives realized volatility after the settlement divided by the same span before it, median across settlements. The figure in brackets is the share of settlements where it rose. The share beside each expiry is the median share of the coin's open interest, in USD, settling that morning. Midweek means Monday to Thursday.
Every class rises over twelve hours and the monthlies rise most. Read on its own that looks like the belief confirmed, until you set it beside the other Fridays. The ordinary weekly Friday, carrying about a quarter of a monthly's share, rises 1.29 times. The quarterly, carrying the most, rises 1.28 times. Friday afternoons in New York are busy on their own. Over 24 hours every Friday class drops below 1.0 for the plainest reason available: the window ends on Saturday morning.
The fair test for a big expiry is therefore against an ordinary Friday, same weekday, same weekend, same macro calendar. Taking one reading per date so that six coins on one morning count once, the 7 monthly and quarterly dates rose a median 1.54 times over 12 hours against 1.28 times on the ordinary weekly Fridays. Seven dates cannot separate those two numbers. The Mann-Whitney p-value is 0.24 at 12 hours, 0.67 at 24 hours, 0.77 at 6 hours and 0.50 at one hour. A table of classes will not settle this question on seven months of data. Every settlement has to be used instead.
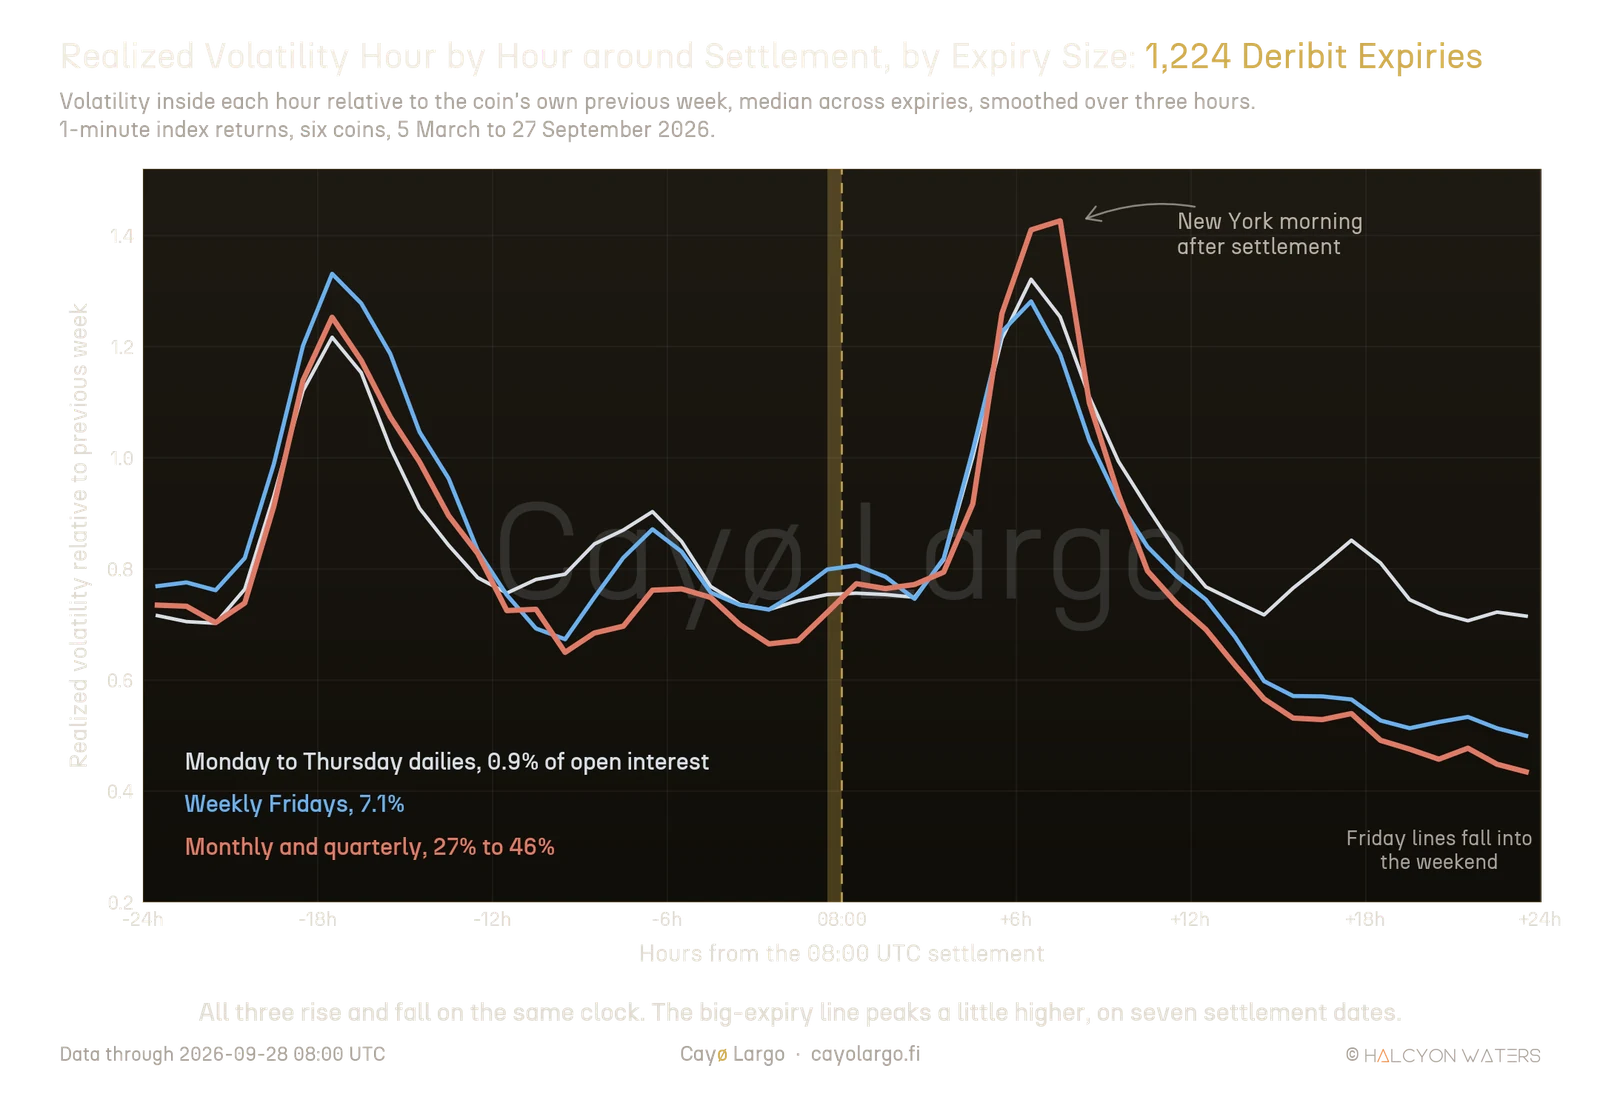
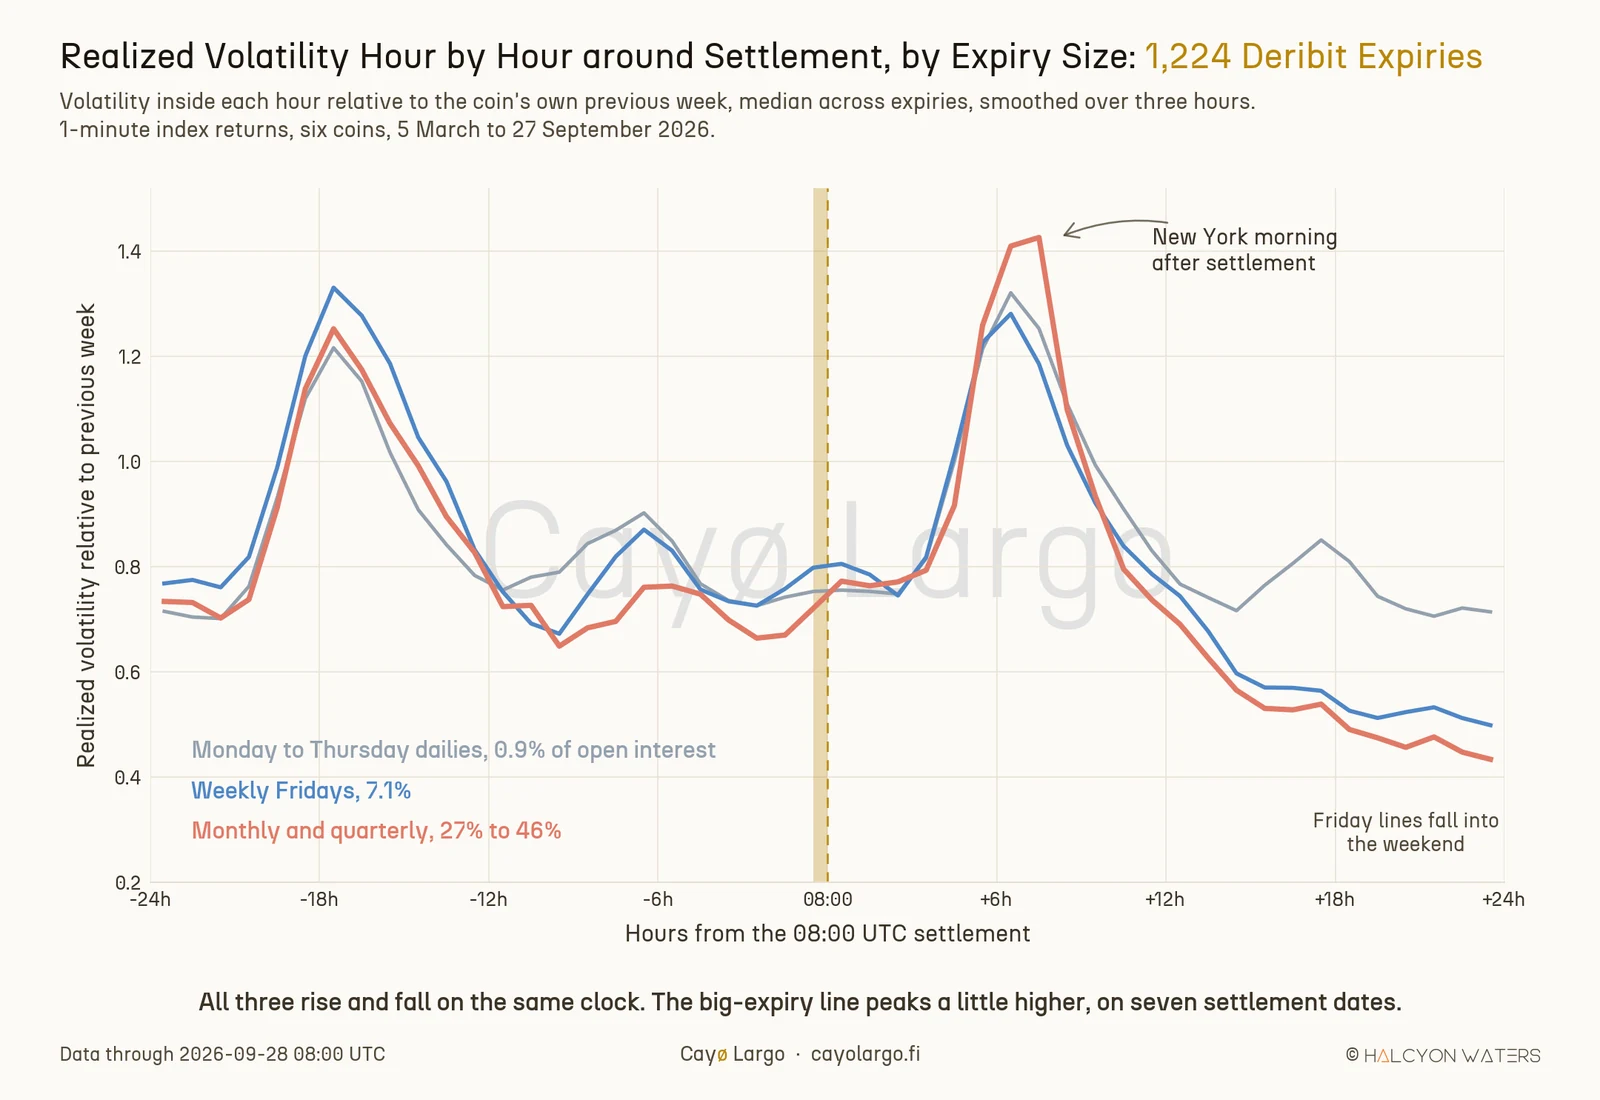
Figure 3: Hour by hour around the settlement, median across expiries, relative to the coin's own previous week, from 1-minute returns. The three groups peak together in the New York morning before settlement and again after it. The monthly and quarterly line peaks a little higher after settlement, on seven dates.
Figure 3 shows the same thing without any ratio. The three lines rise and fall on one clock. That clock is New York's, not Deribit's. The big-expiry line does peak a little higher in the afternoon after settlement, about 1.43 of its previous week against about 1.3 for the other two. If expiring gamma had been holding the market down, that is where it would show. Whether it is the expiry or seven busy afternoons is what the next test answers.
To use every settlement rather than five classes, we regressed the log ratio on the share of the book's dollar gamma expiring that morning, with the weekday and the coin held fixed:
where is the window length, is the fraction of the coin's total dollar gamma sitting in the expiring contracts, and absorb the day-of-week and coin effects and is the residual, with standard errors clustered by date. If the belief held, would be positive. At 12 hours with a 95% interval from to and . For an expiry holding 40% of the book's gamma, the central estimate is a ratio about 1% higher than for an expiry holding none. The interval spans 5% lower to 8% higher. At 6 hours . At 24 hours the slope turns negative. Here , with an interval from to and . The larger the expiry, the less the market moved over the following day, about 9% less at a 40% share. If you hold short gamma through a big expiry for fear of what comes after it, the data leans the other way.
The cleanest version of the test holds the weekday fixed by hand. Take Fridays only and split them at the median expiring share. The smaller half, with a median 13.7% of the book's gamma expiring, rose 1.31 times over the next 12 hours. The larger half, with 38.3% expiring, also rose 1.31 times. Over 24 hours the smaller half ended at 0.95 and the larger at 0.90. In other words, knowing how much gamma had just expired would have told you nothing about the afternoon that followed.
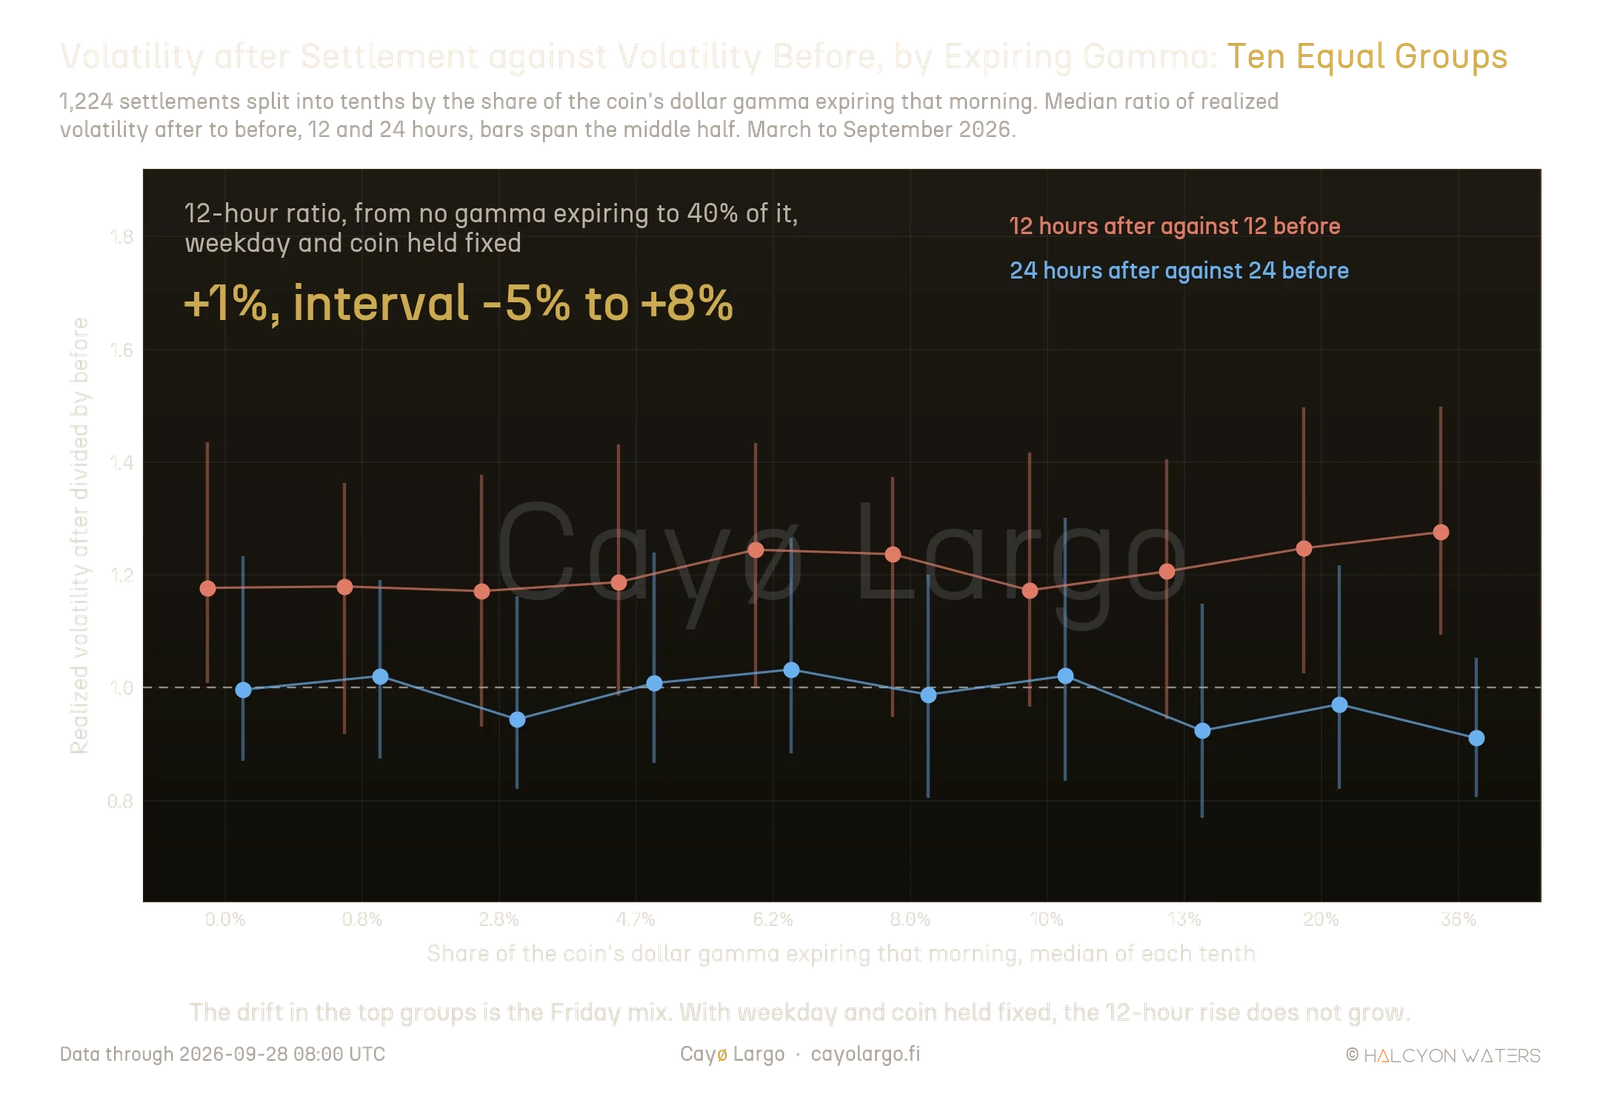
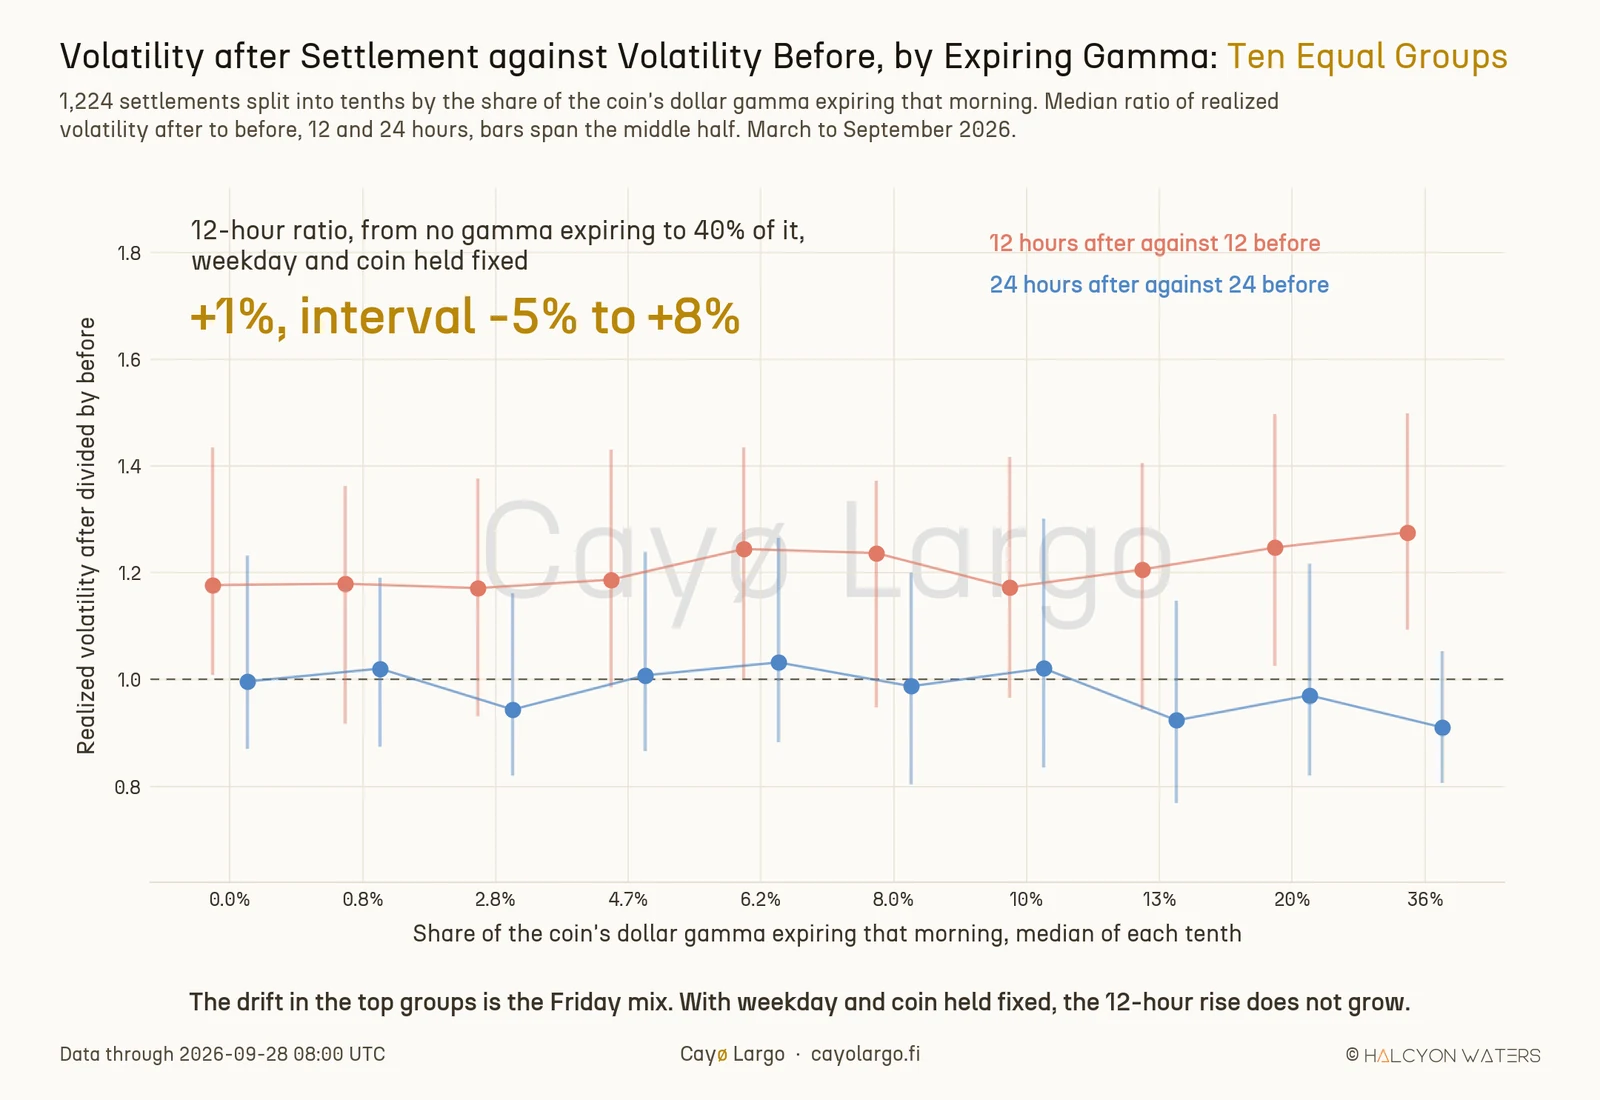
Figure 4: All 1,224 settlements in ten equal groups by the share of gamma expiring. If a larger expiry released more movement, the coral markers would climb to the right. They hold between 1.17 and 1.28 from the first group to the last. The top group reads highest mostly because two thirds of it are Fridays, whose afternoons are busy anyway. With weekday and coin held fixed, 40% of the gamma expiring moves the 12-hour ratio by about 1%.
Does it matter which way dealers were positioned?
The belief comes with a condition attached. If dealers were long gamma into the expiry, damping should end and volatility rise. If they were short, amplification should end and volatility fall. Averaging over both could hide two opposite effects, so we split them.
Nobody observes the dealer side directly. We read it two ways at the 06:00 UTC cycle on the expiring contracts: the standard assumption that dealers are long the calls and short the puts in the open interest, then the dealer side inferred from the trade tape, from which side of each trade was the aggressor, which Cayø Largo serves beside the standard reading on the GEX pinning endpoint. The two constructions agree on the sign only 49.1% of the time, which is a finding of its own and the reason we report both. We kept the half of expiries with the largest net gamma on each coin. A near-zero reading should not decide a side.
| Dealer side, expiring gamma | Settlements (dates) | 12 hours | 24 hours |
|---|---|---|---|
| Standard, long | 252 (120) | 1.21 (75%) | 0.97 (46%) |
| Standard, short | 251 (121) | 1.24 (76%) | 0.97 (46%) |
| Trade tape, long | 266 (140) | 1.23 (72%) | 0.95 (43%) |
| Trade tape, short | 221 (128) | 1.20 (75%) | 0.98 (46%) |
Long-gamma expiries are not followed by more movement than short-gamma ones. On both readings the long side rose as often or slightly less often, the opposite of what the belief predicts. Regressing the ratio on the signed position gives between 0.43 and 0.95 at 12 and 24 hours. Whatever the expiring book was doing to the market, removing it did not show up in realized volatility over the following half day.
Where an expiry's footprint is more likely?
If the expiry leaves a footprint, it is short and sits close to 08:00. Our hour-level test finds nothing there either. In the hour after settlement the big expiries rose a median 1.10 times against 1.07 times for weekly Fridays (). One hour is still coarse for a settlement that is decided in thirty minutes. Weiss, Gaudiosi, Zhou and Webb (2026) looked inside that window and document a return reversal in BTC around the Deribit expiry, concentrated on days of high at-the-money open interest and strongest when dealer gamma exposure is negative, with trading activity rising around the expiry. That is a statement about direction around the settlement, not about how much the market moves in the half day after it.
Equity options show the same timescale. On the S&P 500 the OptionMetrics analysis of third-Thursday expirations finds a median 0-DTE skew of 0.17 at 15:45 ET on third Thursdays, against 0.03 or less at every other time and day they measured, including 10:00 on the same Thursday morning. Expiry flows are measured in minutes around the settlement, not in the half day after it. That is consistent with the implied volatility flare we mapped before Deribit expiries, which also lives in the final hours of a contract rather than after it.
The query behind the size of each expiry
The size of every expiry comes from one snapshot per day, the 06:00 UTC cycle, over every option Deribit lists:
The SQL, as it was run for one morning
SELECT m.coin,
       i.expiration_timestamp,
       sum(m.open_interest * m.underlying_price) AS oi_usd,
       sum(m.open_interest * abs(m.gamma)
           * m.underlying_price * m.underlying_price
           * 0.01)                               AS dgamma
FROM deribit_options_marketdata m
JOIN deribit_options_instruments i
  ON i.instrument_id = m.instrument_id
WHERE m._timestamp >= '2026-09-25 06:00+00'
  AND m._timestamp <  '2026-09-25 06:10+00'
GROUP BY 1, 2;
The row whose expiration equals that day's 08:00 is the expiry about to settle. The sum over all rows is the whole book at the same instant. For BTC on 25 September that gives 14.2 billion USD expiring out of 42.0 billion USD, 33.8% of open interest. Realized volatility comes from Cayø Largo's 1-minute record of the Deribit index for each coin, the same series the spot rates endpoint serves, which begins on 26 February 2026. With an eight-day baseline, the first settlement we can read is 5 March. As a check we repeated everything on the same index sampled every ten minutes. None of the conclusions changed: the 12-hour slope stays flat () and the 24-hour slope stays negative (, ).
What we did not test?
As usual, this study rests on a handful of choices and assumptions. Three of them deserve a few sentences each.
The big expiries are few. Keep in mind that seven monthly and quarterly dates in seven months is the whole population, not a sample we chose. Their 12-hour rise does sit above the weekly Fridays'. It cannot be separated from it. That is why the regression over all 1,224 settlements and the Friday split carry the weight of the argument rather than the table of classes. The 24-hour slope is significant at the 5% level on one-minute returns and just outside it on ten-minute returns, so we read it as a lean, not a law.
We did not overlay the macro calendar. The last Friday of a month often carries US data of its own. That may explain why the monthly class shows the largest 12-hour rise, although it is not separable from ordinary Fridays in our test. We also read Deribit only, the largest crypto options venue. Our spot record starts on 26 February 2026 and has short gaps, a few of them in the hour after 09:00 UTC. Every window we used kept at least 80% of its minutes. A study of the thirty minutes that set the delivery price, at a resolution finer than ten minutes, would say more about the settlement itself than we can.
Finally, we measured how much the market moved, not where it went. The directional reversal Weiss and co-authors describe is a different question and it lives inside the window we treat as one step.
A closing thought
If you trade short-dated options, the practical reading is plain. When a quiet morning turns into a busy afternoon after a big Friday expiry, check the clock before crediting the options. Deribit settles in the lull between Asia and New York. The afternoon would have come anyway. It comes on a Tuesday too. A cause that arrives on schedule every day of the week is a poor explanation for something that happens once a quarter. The live expiration calendar shows what is due to settle next.
References
Imran Lakha, "Low Vol Regime Persists", Deribit Insights, 27 September 2023. Reads the late-September 2023 crypto market as a low realized volatility regime likely to persist "at least until the options expiration on Friday", the expiry-as-lock view this note tests.
Oscar Shih, "When Two SPX Expirations Collide: What Happens Every Third Thursday at 3:45 pm?", OptionMetrics, 11 March 2026. Shows S&P 500 0-DTE skew spiking in the last 15 minutes of third Thursdays, when two expiration cycles overlap, with the effect absent earlier in the session.
Dustin Weiss, Robert Gaudiosi, Z. Ivy Zhou and Robert I. Webb, "Bitcoin option expiration, gamma exposure, and intraday price reversals", Finance Research Letters 107, 110340, 2026. Documents a return reversal in BTC around the Deribit expiry, concentrated on days of high at-the-money open interest and strongest when dealer gamma exposure is negative.
Derive Insights, "What happens to Dealer Hedges after an expiry?", X, 25 September 2026. Explains the unwinding of dealer delta hedges after the BTC quarterly and argues that with the expired gamma gone the market is back in price discovery mode.
Deribit, "public/get_delivery_prices", Deribit API documentation. The published settlement prices used when futures and options expire, one per index per day, against which we checked our own averaging of the index.
Frequently Asked Questions
Does crypto volatility rise after a big options expiry?
Not because of the expiry. Across 1,224 Deribit settlements on six coins, March to September 2026, the share of gamma expiring did not predict the rise in realized volatility over the next 6 or 12 hours. On Fridays the 12-hour rise was 1.31 times for the half of expiries holding a median 14% of the book's gamma and 1.31 times for the half holding 38%. Over 24 hours, larger expiries were followed by slightly less volatility.
Why does bitcoin often move more after the Deribit expiry?
Because of the clock. Deribit settles at 08:00 UTC, when the six coins realize about 0.90 of their daily average volatility on weekdays. The busiest stretch of the crypto day is the New York morning, peaking at about 1.54 between 14:00 and 15:00 UTC. Any 12 hours after settlement contain that stretch while the 12 hours before contain the Asian night.
How is the Deribit delivery price calculated?
Options expiring at 08:00 UTC settle in cash against an average of the Deribit index over the 30 minutes before 08:00. For the 25 September 2026 quarterly, our own 30 one-minute BTC index prints from 07:30 to 08:00 averaged 83,932.29 USD against Deribit's published delivery price of 83,930.84 USD. Spot at 08:00 itself was 84,037.05 USD.
Does it matter whether dealers were long or short gamma into expiry?
Not for volatility afterwards. Split by the sign of dealer gamma on the expiring contracts, realized volatility over the next 24 hours rose in 43% to 46% of cases after long-gamma expiries and 46% after short-gamma ones. That held on the standard open-interest assumption and on the dealer side read from the trade tape, which agree on the sign only about half the time.
Related Articles
Does Max Pain Work for Deribit Options?
Traders have argued about max pain for six years without measuring it. We took 919 Deribit options expiries across six coins and read the max pain strike six hours before each settlement. Then we asked a simple question: did the coin settle nearer to that strike, or nearer to the price it was already trading at when we read it? It settled nearer to the trading price, on every coin. Max pain pulls price a little, one day before expiry. By the last hours the pull is gone.
Why Crypto IV Spikes Before Expiry: The Bow Shock
Why does crypto implied volatility spike before expiry? An IV Footprint heatmap shows a bow-shaped front flaring at the wings before each Deribit settlement.
Which Expiry's Gamma Regime Are You Reading?
At Deribit's daily expiry roll, 90.9% of the changes in BTC's headline gamma regime are the pointer moving to a new contract, not the option book repositioning.