Does Max Pain Work for Deribit Options?
Traders have argued about max pain for six years without measuring it. We took every Deribit options expiry in Cayø Largo's archive, 919 of them across six coins, read the max pain strike six hours before settlement, and compared it to the price each contract actually settled at. The benchmark is doing nothing: assume price stays where it already is. Max pain lost to that benchmark on every coin, and the only horizon where it shows any pull at all is a full day before expiry.
Every expiry, the same picture goes round. A bar chart of open interest, one strike marked in red, and a caption saying price will be dragged there by Friday morning. The strike is called max pain, the level at which option holders as a group would collect the least money. The story attached to it is that whoever sold those contracts has both the motive and the muscle to pin the market there. Six years of posts. Two camps. Not one number.
Let's put one there. In this note we take 919 Deribit options expiries between 14 February and 18 September 2026, read the max pain strike six hours before each settlement, and measure how far the contract actually settled from it. Then we do the same for a level that costs nothing to produce, namely the price already on the screen at that same moment. If max pain knows something, it has to beat that. It does not. The median distance to max pain was 1.23%, and to the price that was already there, 0.53%.
Max pain loses to doing nothing. If the mechanics are already familiar, jump to What The 919 Expiries Show: the two sections before it define the instrument and set up the test.
What Is Max Pain?
Max pain is a settlement price, hypothetically chosen, at which the whole chain would owe its holders the least. Take every open contract, ask what each would be worth if the coin expired at some candidate price, add up the intrinsic value, then repeat the exercise for every strike on the board. The strike with the smallest total wins the name.
where is the strike of the contracts in row of the chain, and and are the call and put open interest sitting at it. means . is the candidate settlement price that minimises the sum. Cryptarbitrage set this out for crypto on Deribit's own education blog in June 2020, and later published the Python that computes it from the exchange API.
Have a look at what the formula actually reads. Open interest, strikes, arithmetic. There is no forecast anywhere in it. It describes where the chain is sitting right now, and the chain sits around spot because that is where an exchange lists strikes and where traders open positions. Move the coin and the chain follows within a day. That makes the strike a consequence, not a cause.
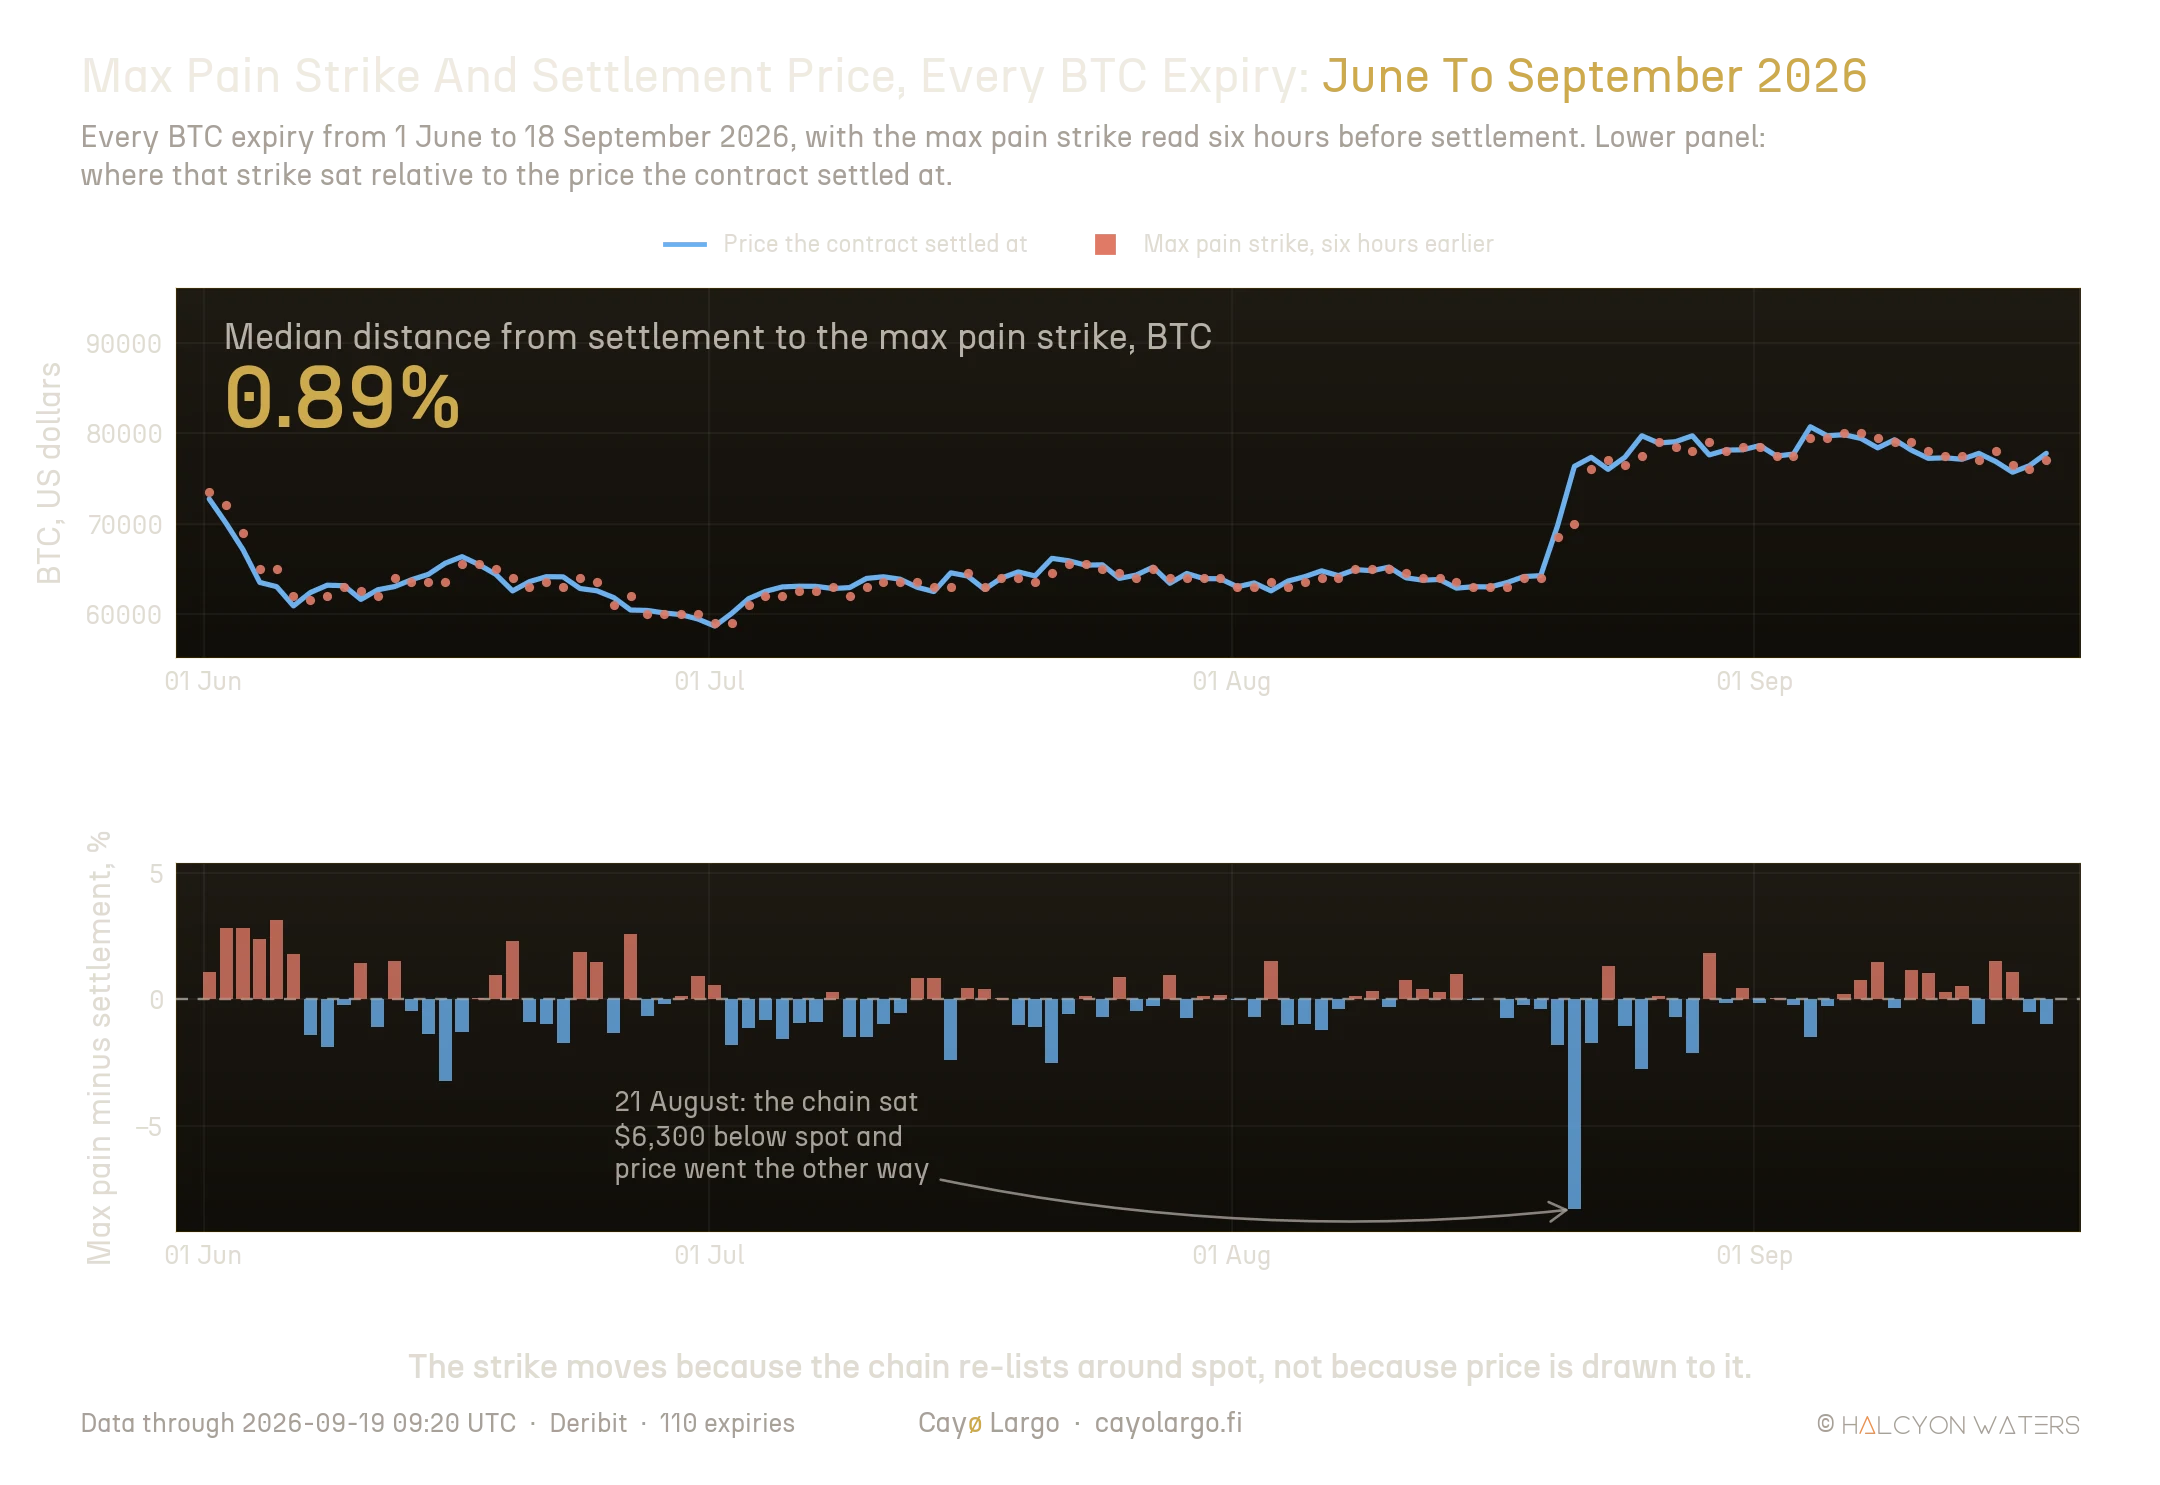
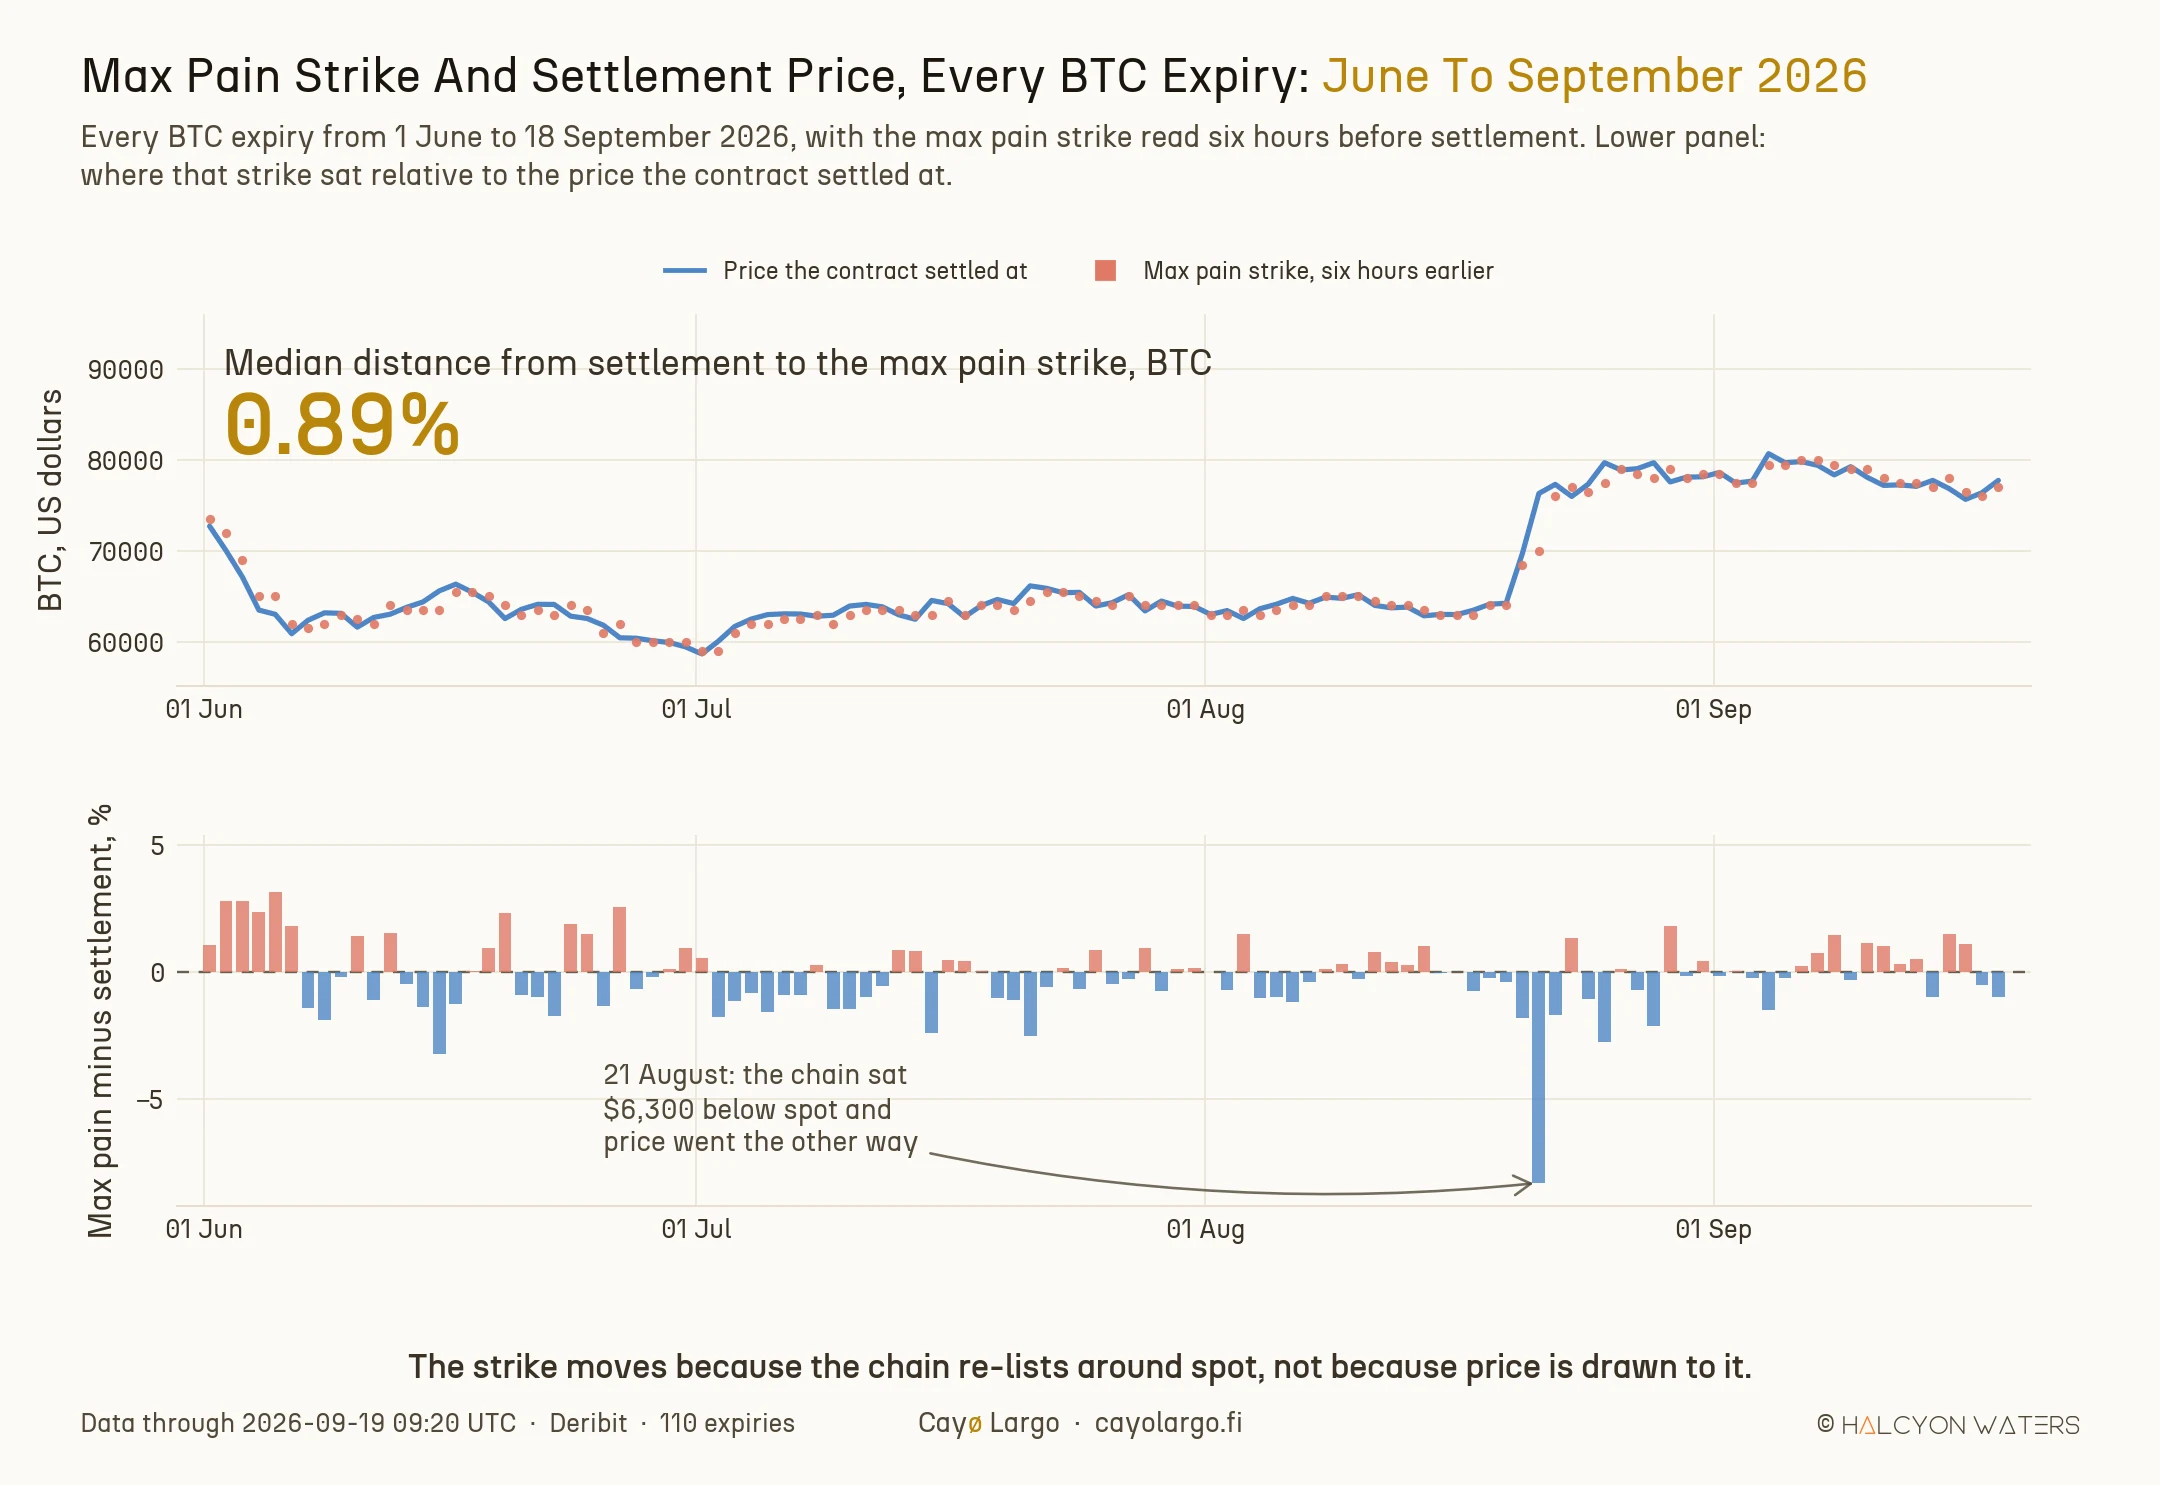
Figure 1: Every BTC expiry from 1 June to 18 September 2026. Upper panel: the price each contract settled at, with the max pain strike read six hours earlier. Lower panel: the distance between them. The strike tracks price up through the August repricing and never arrives first.
The dots ride the line. When BTC went from the low 60,000s to the high 70,000s in the third week of August, max pain came along one expiry behind. Anyone who sails knows the shape of this: the wake tells you precisely where the boat has been. It has never once steered it.
The Test And Its Benchmark
A forecast only means something against an alternative, so we need one that is honest and cheap. Here it is: assume price stays where it is. Read both levels at the same instant, some number of hours before settlement, and compare each to the settlement price .
where is the settlement price, is the max pain strike computed hours before settlement, and is the underlying price at that same moment. Keep in mind what this test is not. It does not ask whether max pain is interesting, or whether anyone watches it. It asks one thing only. If max pain carries information about settlement, has to come in smaller than , because the strike starts out some distance from spot and price must travel that distance for it to win.
What The 919 Expiries Show
It loses. Every coin, no exceptions.
| Coin | Expiries | To max pain | To spot, six hours earlier | Max pain closer |
|---|---|---|---|---|
| BTC | 191 | 0.89% | 0.39% | 29.8% |
| ETH | 191 | 0.99% | 0.56% | 25.7% |
| TRX | 47 | 1.00% | 0.27% | 19.1% |
| XRP | 174 | 1.35% | 0.60% | 23.6% |
| SOL | 190 | 1.75% | 0.57% | 21.1% |
| AVAX | 126 | 1.98% | 0.84% | 21.4% |
| All six | 919 | 1.23% | 0.53% | 24.3% |
The middle two columns are medians of and at hours. The last is the share of expiries where max pain finished nearer. A signed-rank test on the paired distances returns , what at 919 paired observations means the gap is not a sampling accident. BTC is the kindest case in the table and it still reads 0.89% against 0.39%. In other words, on the deepest options book in crypto, the level you were told is a magnet finished more than twice as far from settlement as the number already printed on your screen.
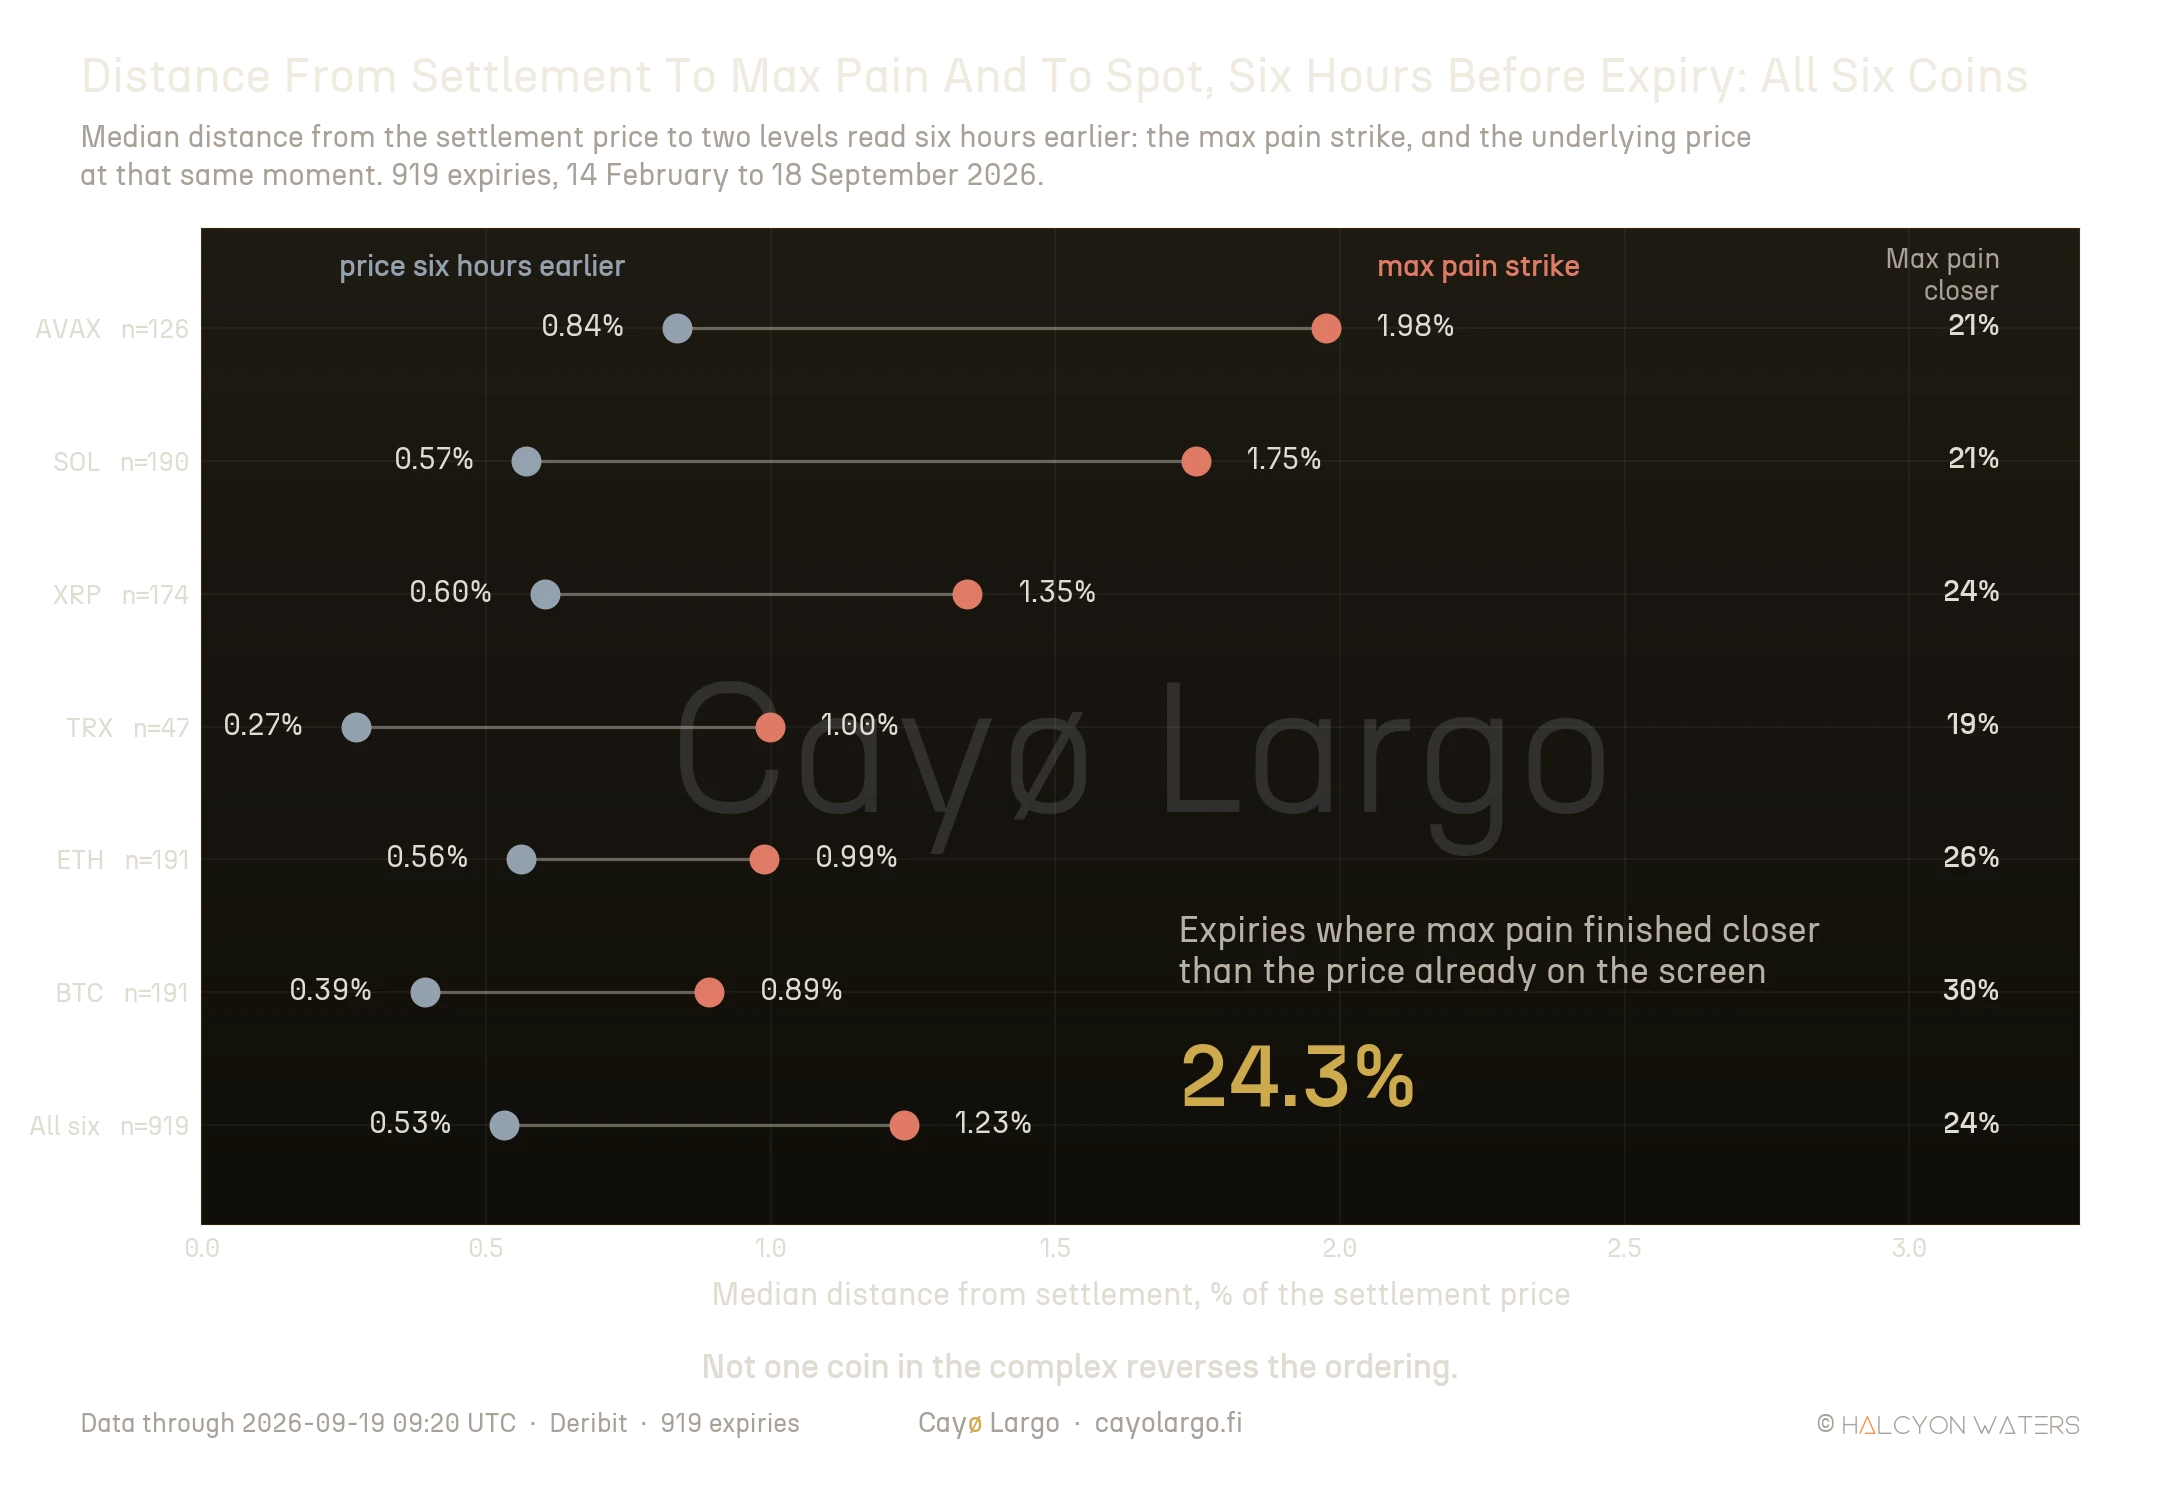
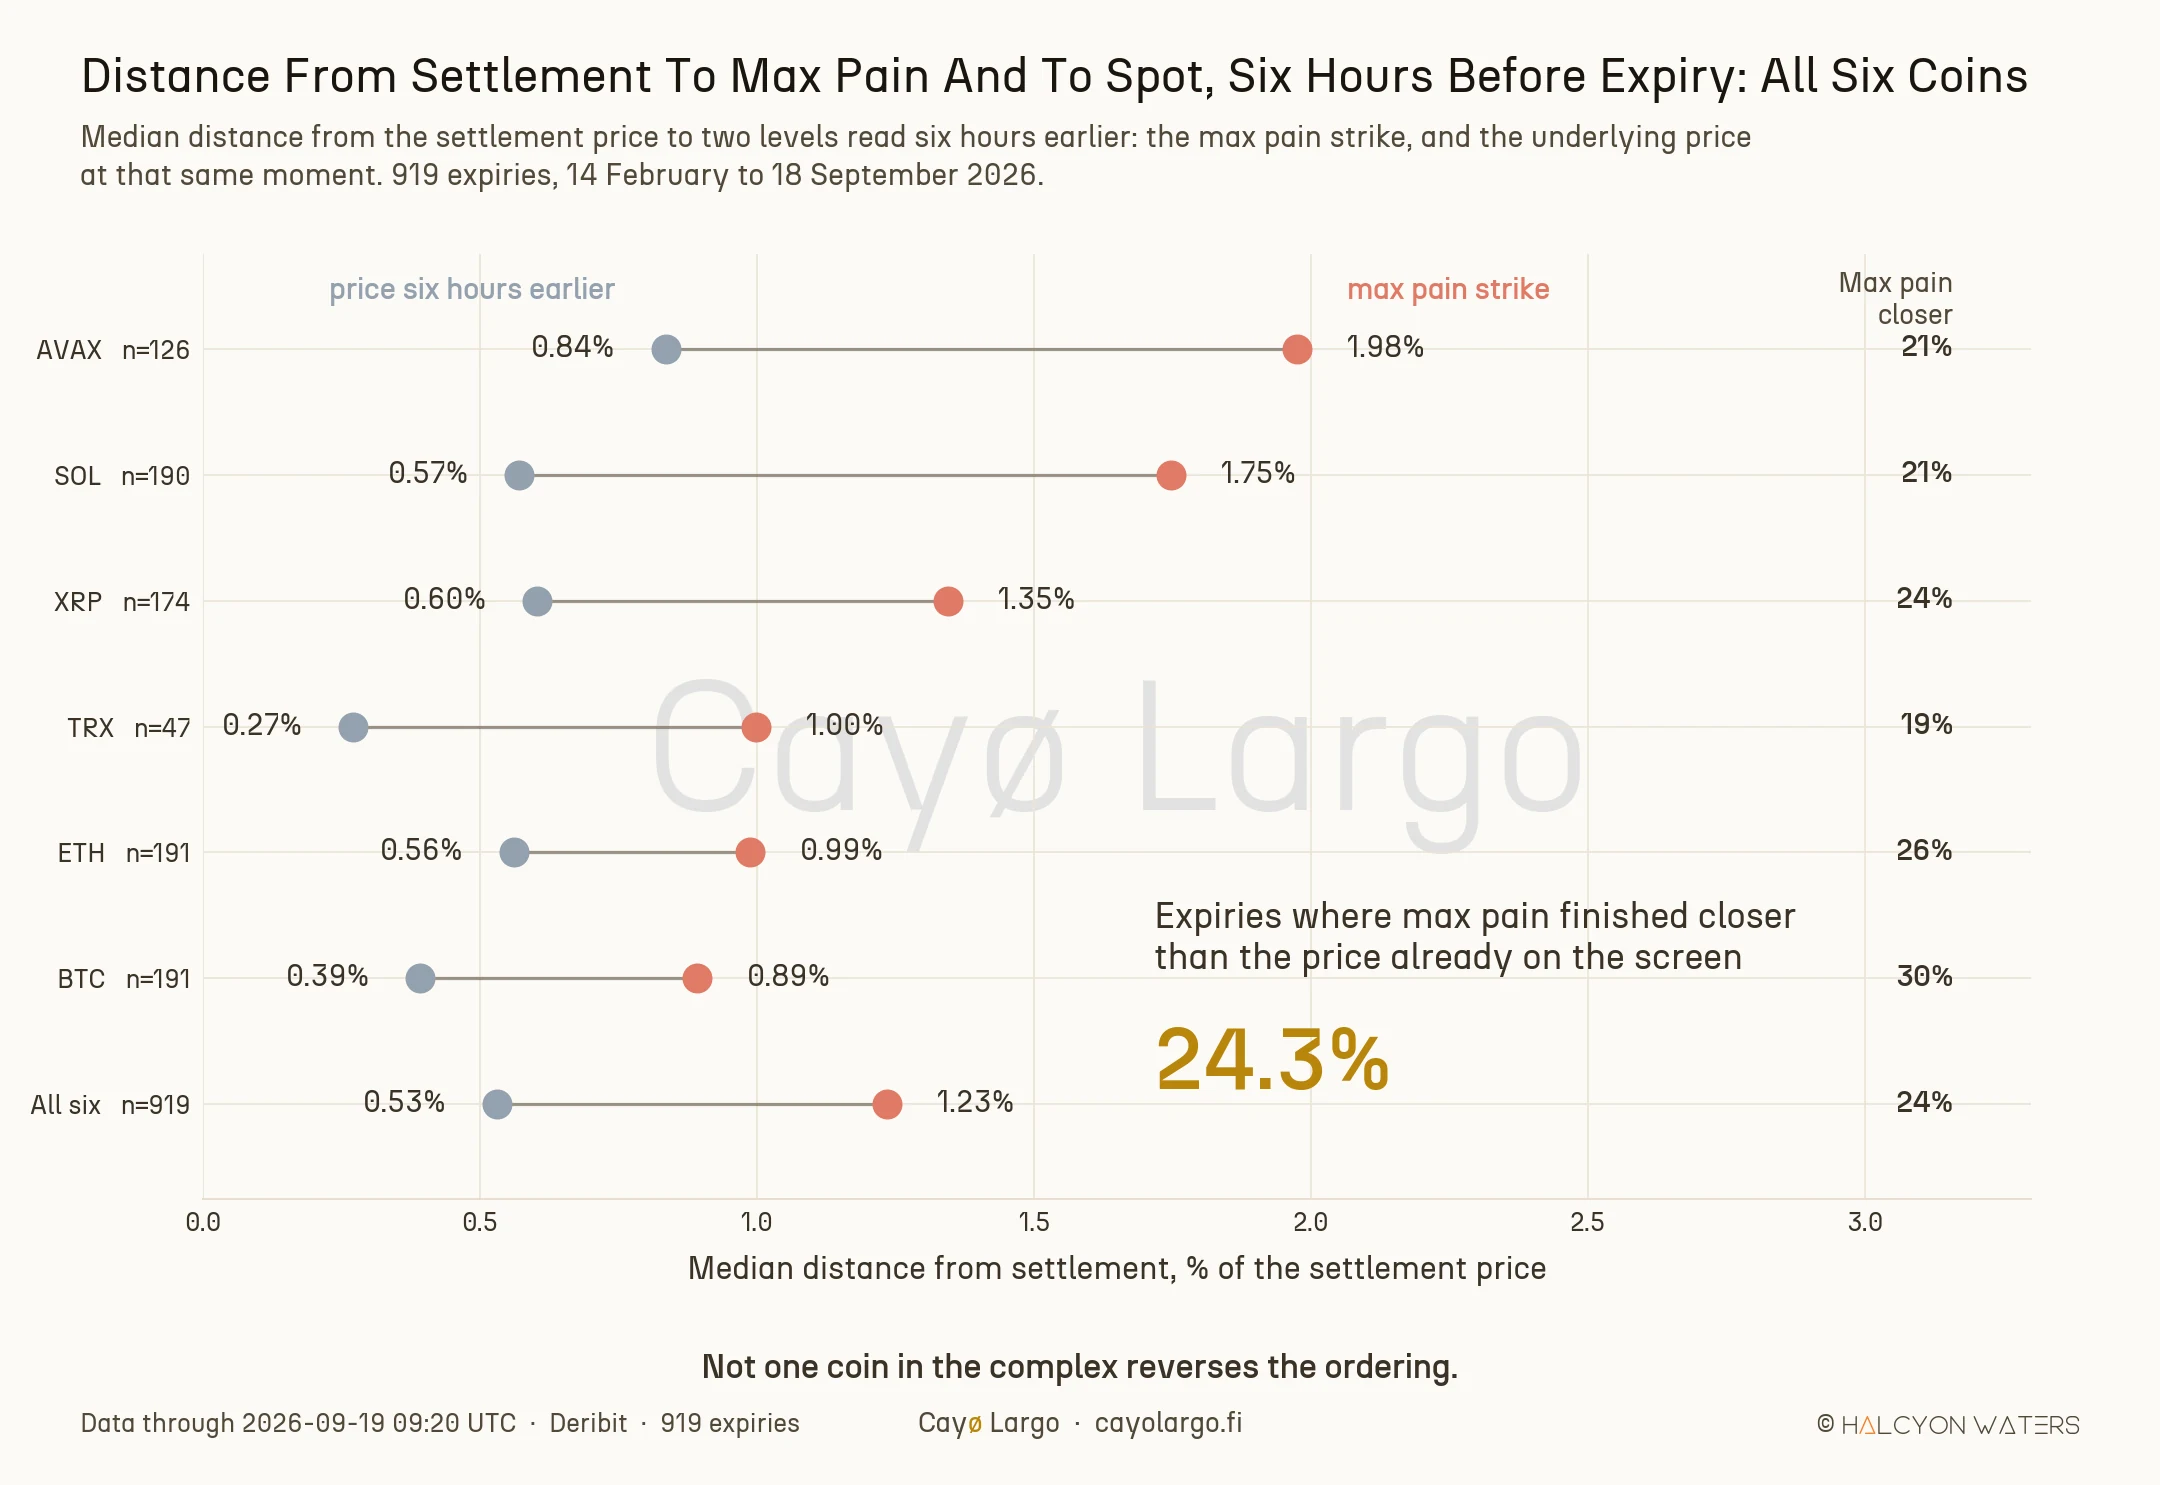
Figure 2: Median distance from the settlement price to two levels read six hours earlier. Coral is the max pain strike, silver is the underlying price at that same moment. The gap between the dots is what the max pain story would have to overcome, and the right-hand column is how often it did.
Now look at the failure more carefully, because it has a shape. Sort the same 919 expiries by how far the strike sat from spot when we read it.
| Distance from spot when read | Expiries | To max pain | To spot | Max pain closer |
|---|---|---|---|---|
| Under 0.5% | 237 | 0.41% | 0.40% | 42.6% |
| 0.5% to 2% | 451 | 1.16% | 0.56% | 23.7% |
| Over 2% | 231 | 3.13% | 0.71% | 6.5% |
Max pain looks best exactly when it is least useful. Sitting within half a percent of spot, it is near enough a coin flip at 42.6%, and no wonder why: the two levels are the same level, and agreeing with spot is not a skill. Push it out past 2% and the win rate collapses to 6.5% of 231 expiries. That is the case a trader would actually act on. It is also the case where the chart is wrong nineteen times in twenty.
Big Books And Short Horizons Do Not Help
The folklore does attach conditions. Max pain works when expiry is close, it says, and when open interest is large. The 2020 Deribit piece says so in its own section on when the calculation is and is not useful. A big book raises the incentive, and a short horizon makes any push cheap enough to sustain. Both conditions live in the archive, so both can be tested rather than argued about.
Neither moves the number. Top quartile of total open interest: max pain closer in 24.8% of 230 expiries. Top quartile of Cayø Largo's own pin probability: 22.6%, i.e. slightly worse. Price already inside the computed pinning zone: 25.0%. Monthly contracts, the ones carrying the largest books, give 26.9% across 26 observations, and pooling them with the quarterlies gives 33.3% across 36. That last figure is the best any cut produces and it is still barely half the coin-flip rate. Every other slice lands within a few points of the unconditional 24.3%, what is precisely the fingerprint of a variable with nothing in it.
The One Horizon Where Something Shows Up
The honest version of this finding is not that the effect is zero. Something is there. It is small, it is real, and it lives further from expiry than anyone thinks to look.
Take only the expiries where max pain was not already sitting on spot, and ask a directional question instead of a distance one. Did price move toward the strike, or away from it? One day before settlement, it moved toward max pain in 55.0% of 928 expiries, binomial . That is a genuine tilt. It is also a feeble one, because the median expiry covered 13% of the gap and stopped there.
where is the share of the distance to max pain that price actually travelled. A value of 1 means price arrived at the strike, 0 means it never set off, and a negative value means it walked away. The median is 0.13. Think of it as a tide rather than a tow: the water does shift, and no boat is going anywhere on it.
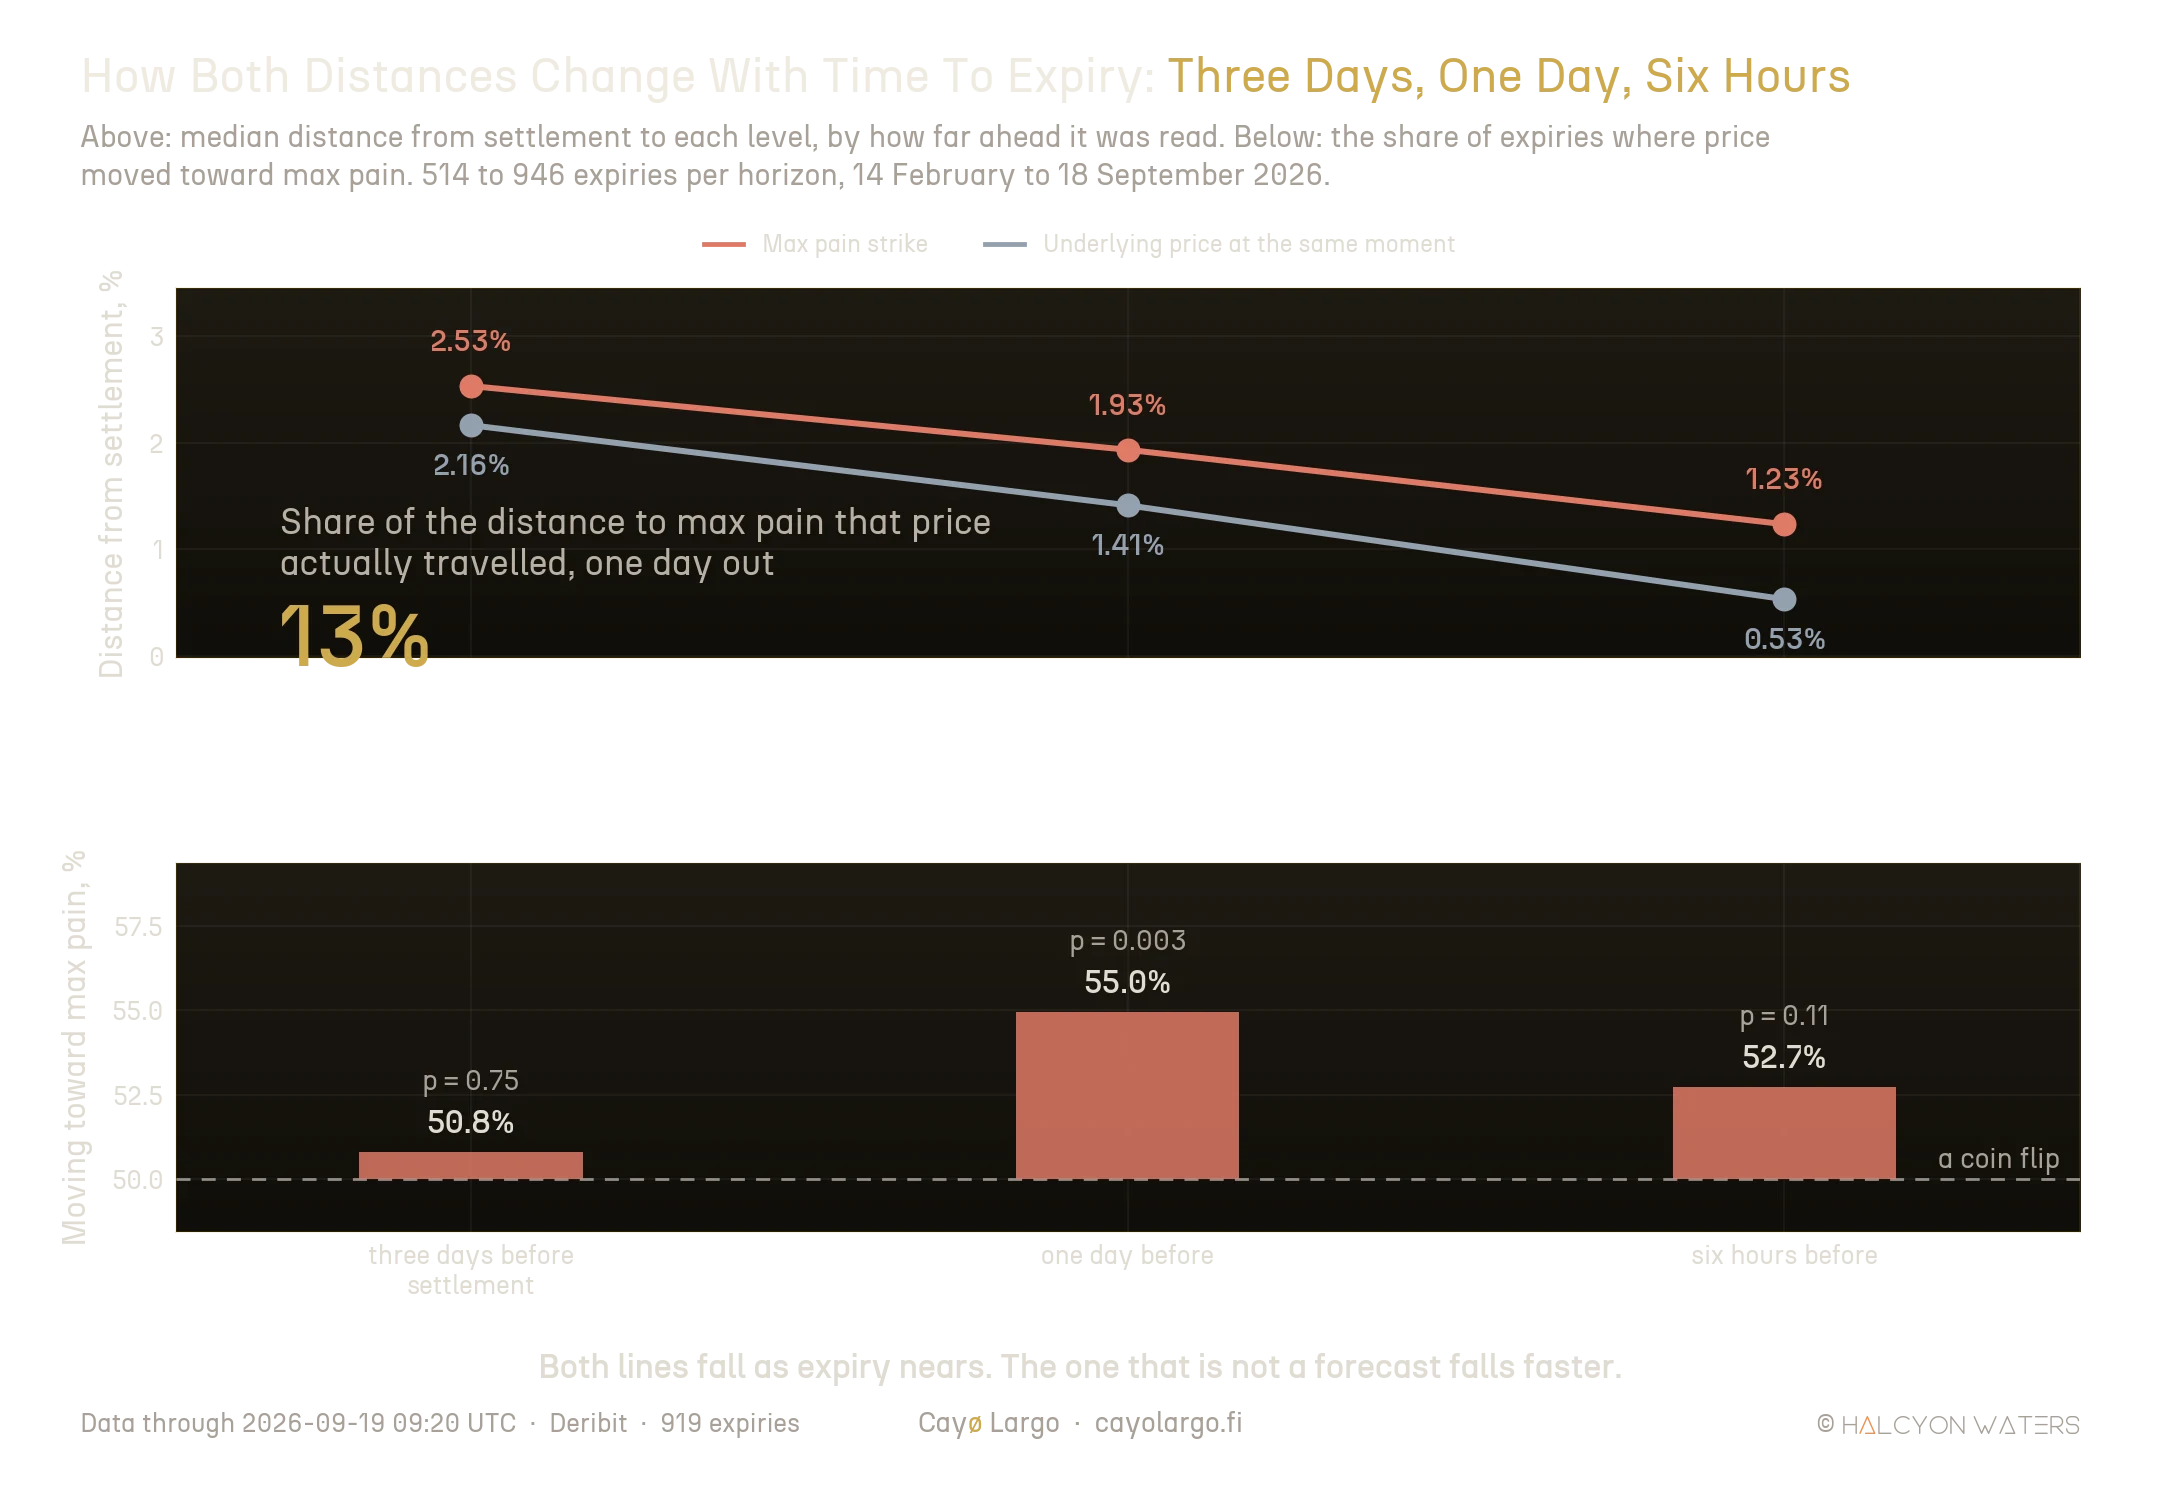
Figure 3: Above: median distance from settlement to each level, by how far ahead it was read. Below: the share of expiries where price moved toward max pain rather than away, against the coin-flip line. The tilt appears one day out and has faded by six hours.
Three days out the tilt reads 50.8%, indistinguishable from chance. Six hours out it is 52.7% at , also indistinguishable. The one horizon where the effect registers is the one nobody screenshots. That shape is backwards for a hedging story, where the pressure is supposed to build as gamma concentrates into the final hours.
Two checks matter before anyone reads more into the 55.0%. The direction is balanced. The strike sat above spot on 468 expiries and below it on 460, price rose on 468 and fell on 460, and the tilt survives on both sides at 55.3% and 54.6%. So it is not a rising market dragging a lagging strike behind it. The second check is less comfortable. The effect is not uniform across the complex. ETH at 58.6% and SOL at 57.8% carry the whole thing. BTC, the deepest book in crypto, reads 52.9% and does not clear significance across 208 expiries. An effect driven by book size should be loudest where the book is largest. This one is quietest there. We have no mechanism to offer for that, and we would rather say so than dress a regularity up as an explanation.
The Query Behind Every Number Above
Everything above falls out of one query against deribit_options_gex_pinning, Cayø Largo's per-expiry gamma and pinning table, sampled every ten minutes across the six coins. It does two things. First, find the price each contract came to rest at. Then reach back hours and pick up max_pain_strike and underlying_price from the same snapshot. Reading both levels off the same row is the part that matters, because any error in the price feed then lands on both of them and cannot quietly favour one.
The SQL, as it was run
WITH expiries AS (
  SELECT DISTINCT coin, expiration_timestamp AS exp
  FROM deribit_options_gex_pinning
  WHERE _timestamp >= '2026-02-13' AND _timestamp < '2026-09-20'
    AND expiration_timestamp < '2026-09-19 08:00+00'
),
settle AS (                       -- the price each contract came to rest at
  SELECT e.coin, e.exp,
         (SELECT p.underlying_price
            FROM deribit_options_gex_pinning p
           WHERE p.coin = e.coin
             AND p._timestamp >= e.exp - interval '25 minutes'
             AND p._timestamp <= e.exp + interval '35 minutes'
           ORDER BY abs(extract(epoch FROM (p._timestamp - e.exp))),
                    p.hours_to_expiry
           LIMIT 1) AS settle_px
    FROM expiries e
)
SELECT s.coin, s.exp, s.settle_px,
       a.max_pain_strike AS mp,          -- the level under test
       a.underlying_price AS spot_a,     -- the benchmark it has to beat
       a.hours_to_expiry AS h, a.expiry_type, a.total_oi_usd, a.pin_probability
  FROM settle s
  CROSS JOIN LATERAL (                   -- one snapshot per expiry, at the anchor
    SELECT * FROM deribit_options_gex_pinning p
     WHERE p.coin = s.coin AND p.expiration_timestamp = s.exp
       AND p.hours_to_expiry BETWEEN 4 AND 9        -- 20 to 28 for one day,
     ORDER BY abs(p.hours_to_expiry - 6) LIMIT 1    -- 66 to 78 for three days
  ) a
 WHERE s.settle_px IS NOT NULL;
The window runs 14 February to 18 September 2026, the full life of that table, and yields 919 usable expiries at six hours, 946 at one day and 514 at three days. Every field is documented on the GEX pinning endpoint, and the same computation runs live on the GEX Landscape.
Two things in that query are worth arguing with, so let's argue with them first. settle_px is a proxy, not the settlement print, which on Deribit is a 30-minute time-weighted average of the index rather than a snapshot. Against distances measured in whole percent the difference is noise, and it lands on both compared levels equally. The second is a missing expiry. TRX carries occasional tick errors in underlying_price, values near 9.7 against a book trading at 0.33. Any expiry whose price moves more than 50% inside the measurement window gets discarded as a feed artefact, not a market event. One did.
What We Did Not Test, And What Others Have
None of this says expiry positioning is a myth. It says max pain is the wrong instrument for reading it, and the sharpest way to see that is to look somewhere the effect has been measured properly. The equity market has better evidence than crypto has yet produced. OptionMetrics measured the third Thursday of the S&P 500 monthly cycle, the one day a month when two expiration cycles overlap. In the last fifteen minutes of trading the zero-day skew runs at a median of 0.1669, against roughly 0.03 at every other timestamp. Mean and median index returns into the close turn negative on exactly those days. That is a positioning effect with a mechanism and a measurement behind it. It is not max pain.
The distinction is the one Imran Lakha drew on 17 September 2026. Aggregate intrinsic value is the wrong quantity, he argues, because it says nothing about which side of the chain dealers sit on. The number that actually forces hedging flow is charm, namely the rate at which delta decays with time. Our data supports the negative half of that argument. The positive half we have not tested, and it is a harder test, because it needs the dealer sign rather than the open interest. Cayø Largo carries taker-flow-signed exposure for exactly that purpose and the charm surface is already mapped in our note on the delta-decay ridge at expiry. Whether it predicts settlement is the next piece, not this one.
A fair reader will now ask whether any strike level survives this test. None does, ours included. The gamma-concentration magnet Cayø Largo computes beside max pain finishes nearer to settlement than max pain on 44.5% of expiries, and nearer than spot on 30.4%. That is the expected result rather than a disappointing one. A magnet marks where hedging demand concentrates, which is a statement about the book, and it is read as structure rather than as a price forecast. Expecting any strike to out-forecast the last traded price was always the wrong question to put to it.
What To Watch Into Expiry Instead
Vitor Gaspar described expiry-day pin risk in July 2026 as the day the smooth mathematics stops applying. Deltas turn binary. Whether you end up holding the underlying is settled by ticks. His answer is process, not prediction: clear the near-the-money strikes days early, and keep whatever is left deliberately far from the money. That advice comes through this note untouched, because it never rested on knowing where price would settle.
What does not come through is the chart. A strike sitting a median 1.14% from spot when you read it, which price closes 13% of the way to on its very best day, is a description of the option chain. It was never a forecast of anything. Watch what has to be hedged, not what would hurt the most.
References
Cryptarbitrage, Maximum Pain For Option Buyers Going Into Expiration, Deribit Insights, 18 June 2020. The canonical crypto statement of the calculation, with a worked BTC chain for 29 May 2020 whose total-intrinsic-value curve bottoms at the max pain strike. Its closing section sets the conditions under which the author expects the number to be useful, low time to expiry and high open interest, and notes that Deribit settles on a 30-minute time-weighted average of the index rather than a last price.
Cryptarbitrage, Deribit Max Pain (Python Code), Deribit Insights, 20 May 2022. A free implementation that pulls open interest from the exchange API and plots calls, puts and total intrinsic value per strike. Useful for anyone who wants to reproduce the strike itself before arguing about what it predicts.
Oscar Shih, When Two SPX Expirations Collide, OptionMetrics, 11 March 2026. Measures the third Thursday of the S&P 500 cycle from May 2022 to February 2026 and finds zero-day skew at 15:45 running roughly five times its usual level, with index returns into the close turning negative on those days. The clearest recent demonstration that expiry positioning moves prices through a mechanism that has nothing to do with max pain.
Vitor Gaspar, Pin risk: what happens to an option book on expiry day, LinkedIn, 27 July 2026. States the pinning mechanism as desks describe it, open interest concentrating gamma at a nearby strike and hedging flows pushing the underlying toward it, strongest in large monthly expiries, and argues that the professional response is to clear the book days early rather than to trade the level.
Imran Lakha, Max Pain Is the Wrong Question, Options Insight, 17 September 2026. Argues that aggregate intrinsic value is not dealer exposure, that open interest cannot tell you who owns the contracts, and that charm is the quantity worth watching into settlement. The prompt for this measurement, and the half of it our data supports.
Frequently Asked Questions
Does max pain work?
Barely, and not as a level you can trade. Across 919 crypto options expiries between 14 February and 18 September 2026, settlement landed a median 1.23% away from the max pain strike read six hours earlier, against 0.53% from the underlying price at that same moment. Max pain finished closer than the price already on the screen in 24.3% of expiries. The ordering holds on all six coins.
Is max pain accurate near expiry?
It gets closer in absolute terms and further behind in relative terms. Three days out the median distance to max pain is 2.53%; six hours out it is 1.23%. Over the same horizons the distance to the underlying price falls from 2.16% to 0.53%. Max pain improves as expiry nears because spot stops moving, not because the strike acquires skill.
Do crypto prices get pulled toward the max pain strike?
There is a small real pull and it peaks about one day before settlement. At that horizon price moved toward max pain in 55.0% of 928 expiries, with a binomial p-value of 0.003, closing a median 13% of the distance. By six hours out the effect is 52.7% and no longer statistically distinguishable from a coin flip.
What should a desk watch at expiry instead of max pain?
The quantity that moves hedges rather than the one that scores option buyers. As time runs out the delta of every contract in the book migrates, and whoever is hedging it must trade the underlying to stay flat. That flow is charm, and unlike max pain it depends on which side of the chain dealers actually sit.
Related Articles
How to Read Gamma Exposure: Bitcoin GEX Live Case Study
BTC trades at $77,140 with $51 million in put open interest stacked at $76,000 and the gamma regime deep in negative territory. Expiry is 16 hours away. Here's how to read every chart on the GEX Landscape page and what each one tells you about what happens next.
Why BTC Delta Decays Fastest at Expiry: The Charm Ridge
Charm, the delta-decay Greek, blows up at the money as expiry nears. On Deribit it prints a bright ridge that sweeps onto every BTC 08:00 settlement.
Which Expiry's Gamma Regime Are You Reading?
At Deribit's daily expiry roll, 90.9% of the changes in BTC's headline gamma regime are the pointer moving to a new contract, not the option book repositioning.