How to Read Gamma Exposure: Bitcoin GEX Live Case Study
BTC trades at $77,140 with $51 million in put open interest stacked at $76,000 and the gamma regime deep in negative territory. Expiry is 16 hours away. Here's how to read every chart on the GEX Landscape page and what each one tells you about what happens next.
BTC is trading at $77,140. The May 22 options expiry is 16 hours away. And $51 million in put open interest is stacked on a single strike while the gamma regime reads NEGATIVE. Let's walk through exactly what you're looking at on Cayø Largo's GEX Landscape page, chart by chart, and what each one tells you about what happens next.
The Setup
It's May 21, 2026. BTC sits at $77,140. The May 22 Deribit expiry is 16 hours out. Options expire all the time, but the gamma profile on this one tells a story worth reading.
The magnetic strike sits at $76,000, about 1.5 percent below spot. The Pin Score reads 63 out of 100. The magnet quality is B, meaning it's vol-stable but decays fast. And fast it is: the half-life is just 1.8 hours, which means the pinning force loses half its remaining strength every 108 minutes. The gamma regime is NEGATIVE, with the GEX Flip at $78,148, about 1.3 percent above the current price.
If those numbers don't mean anything yet, that's the point of this article. We're going to walk through each chart on the GEX Landscape page, in order, and by the end you'll read them like a weather forecast.
Gamma Exposure by Strike
This is the first chart you see. Every bar is one strike price. Blue bars extending right mean positive gamma (stabilising). Orange bars extending left mean negative gamma (amplifying).
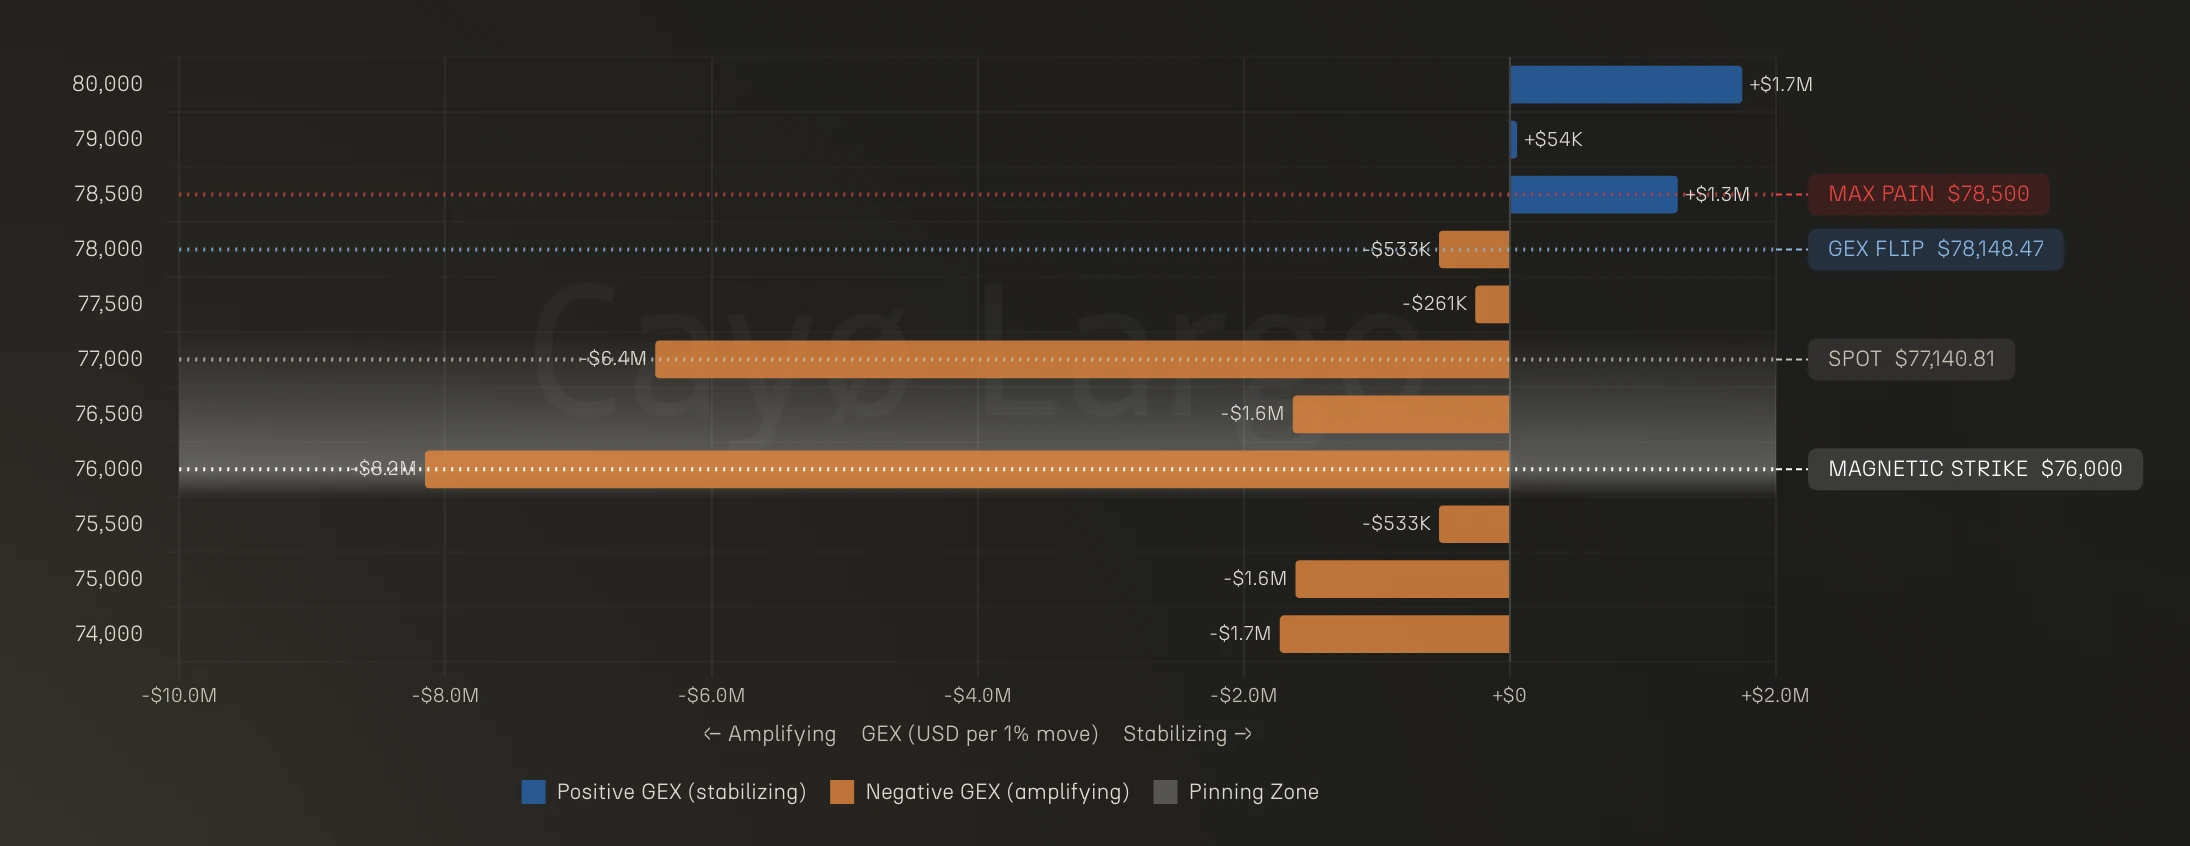
Figure 1: Standard Gamma Exposure by Strike. Two massive negative bars dominate: $76,000 at -$8.0M and $77,000 at -$6.4M.
Two strikes jump off the screen. The $76,000 magnetic strike shows -$8.0M of negative GEX. Right above it, $77,000 adds another -$6.4M. Everything below $78,000 is orange. The only blue bars sit at $78,500 (+$1.3M) and $80,000 (+$1.7M), both above the GEX Flip.
What does "negative gamma" actually mean in practice? When someone buys a put on Deribit, a market maker usually sells it to them. To stay risk-neutral, the market maker hedges by selling some BTC. As the price moves, they adjust. Gamma measures how fast they need to adjust, and the sign tells you whether their hedging stabilises or destabilises the market.
The formula for gamma exposure at a single strike:
where is gamma at strike , is open interest in contracts, is the Deribit multiplier (1 for BTC), and is spot. Net GEX at a strike sums call gamma exposure and subtracts put gamma exposure. When that net is negative, dealer hedging amplifies moves: price drops trigger more selling, price rises trigger more buying. The shock absorbers are off.
The GEX Flip at $78,148 is the price where cumulative gamma crosses zero. BTC trades $1,000 below it. That's negative gamma territory: every move gets amplified by dealer hedging rather than dampened.
This isn't just our reading. Derive Insights published a similar analysis on May 20, aggregating GEX across all expiries and five exchanges (Deribit, Derive, Binance, Bybit, OKX). Their conclusion: the largest negative bar sits at $76K, positive GEX only begins at $79K, and the $80K-$81K call wall is the ceiling. Our single-expiry Deribit view confirms the same structure at higher resolution. Here's a side-by-side comparison:
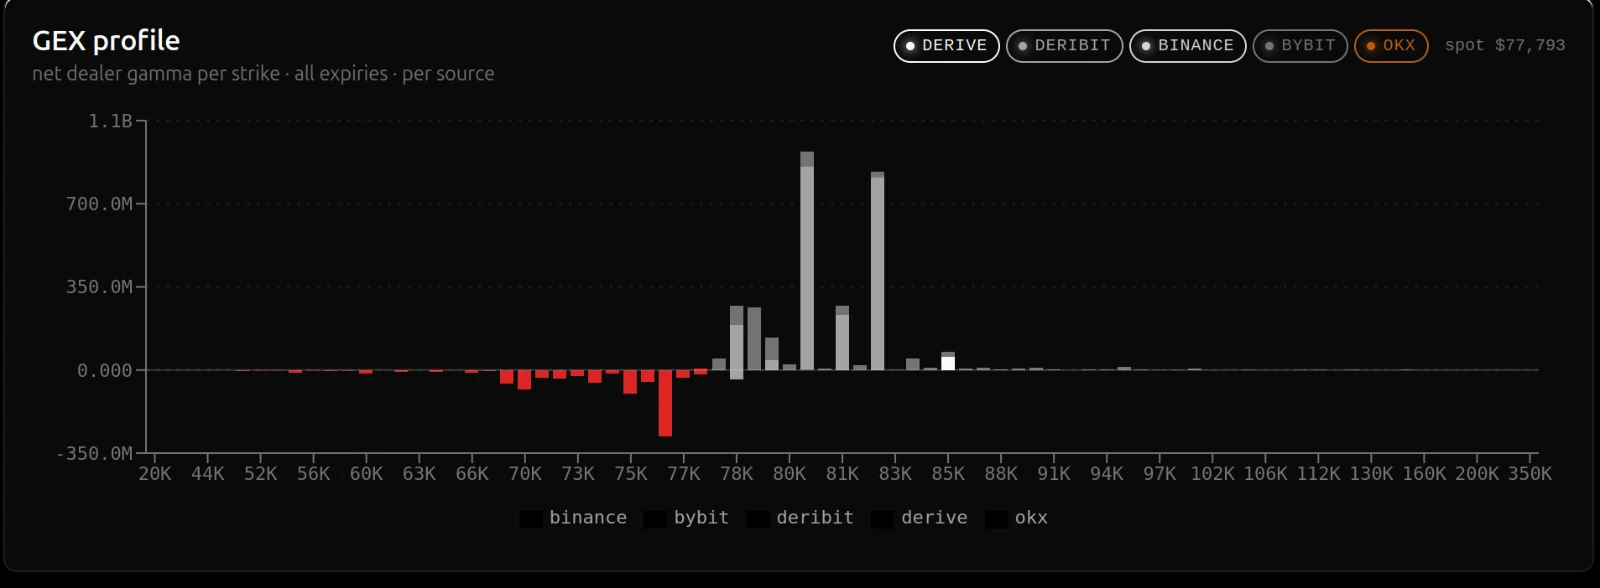
Figure 6: GEX profile by Derive Insights (May 20). Net dealer gamma per strike across all expiries and five exchanges. Same structural picture: deep negative below \$79K, call wall at \$80K.
What Changes When You Correct for Taker Flow
Here's where most analytics platforms stop. Standard GEX assumes every option was bought by a customer and sold by a dealer. That assumption is wrong in 55 to 60 percent of cases.
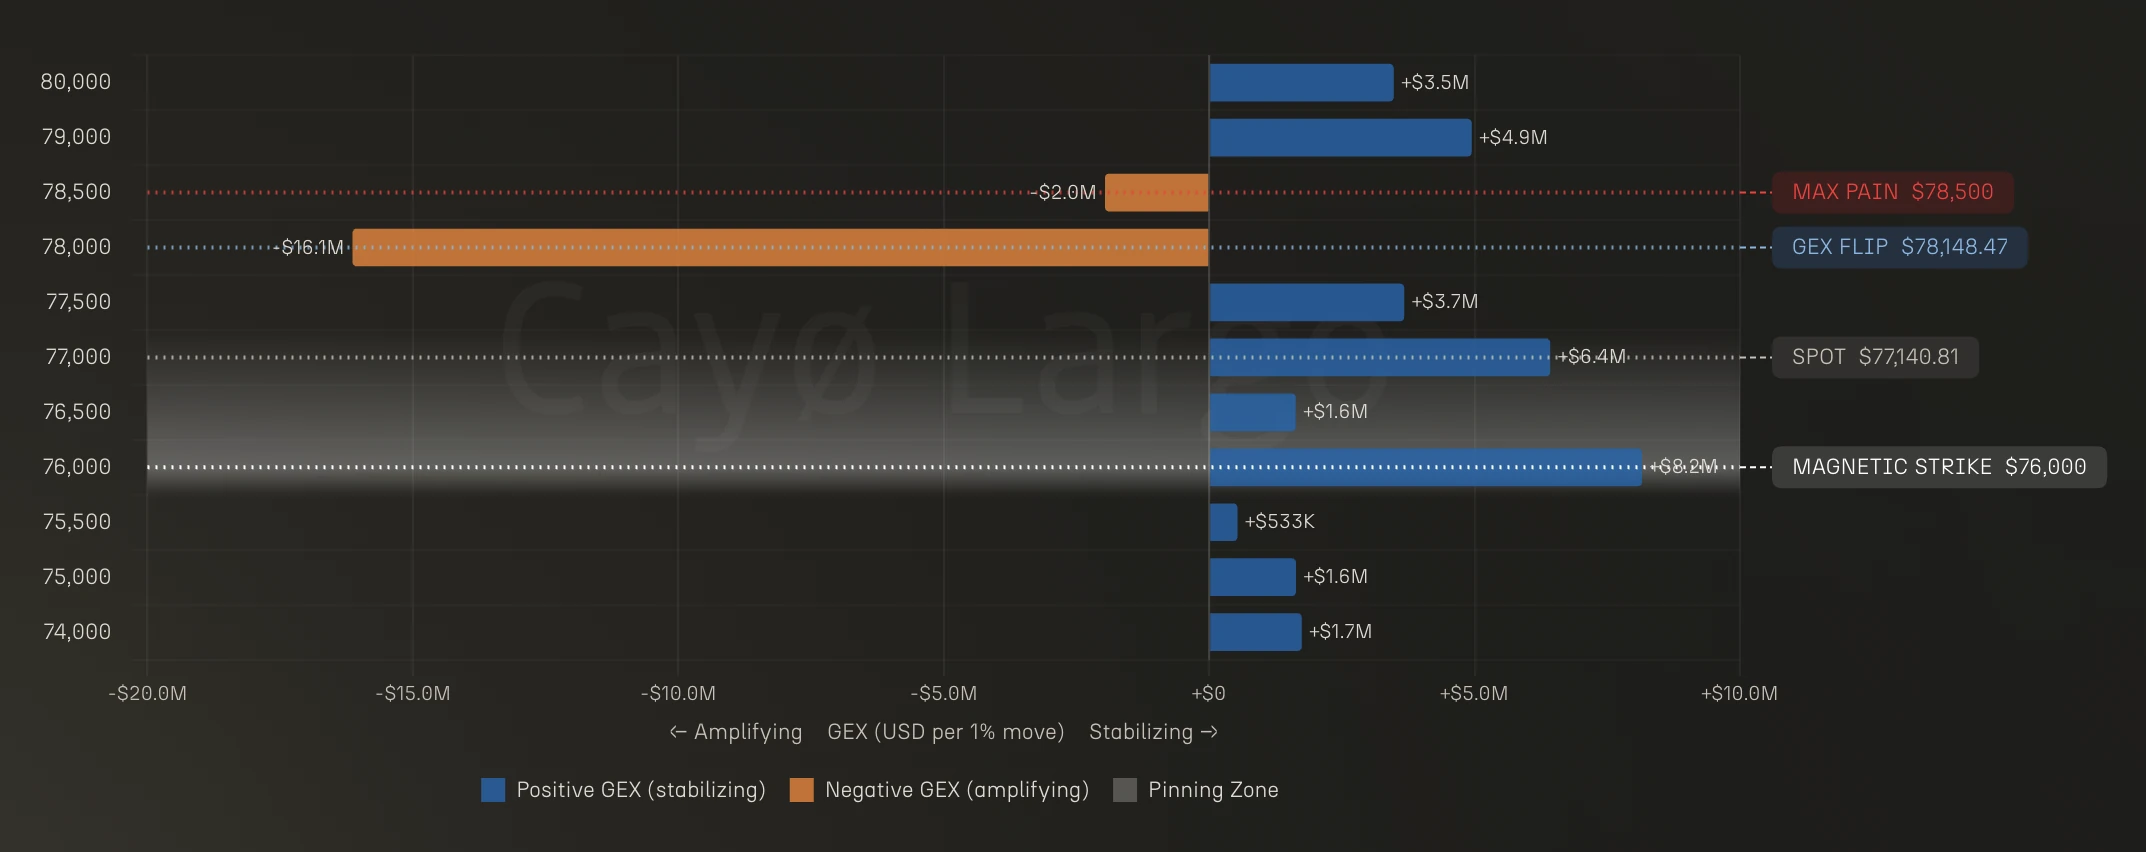
Figure 2: Taker-Flow Corrected GEX. The picture inverts: $76,000 flips to +$8.2M, while $78,000 emerges as the true negative monster at -$16.1M.
Cayø Largo reads the actual trade tape from Deribit to determine who was the buyer and who was the seller in each transaction. The result on this expiry is dramatic.
The $76,000 strike flips from -$8.0M in the standard view to +$8.2M in the corrected view. That's a complete sign reversal. The $77,000 strike flips from -$6.4M to +$6.4M. Below spot, nearly every strike turns blue. The real negative weight has shifted: $78,000 now reads -$16.1M, more than double any single bar in the standard chart.
This changes the trading narrative entirely. Standard GEX tells you the magnet at $76,000 is destabilising. Corrected GEX tells you it's actually stabilising: dealers are providing a floor there, not amplifying a breakdown. The real danger zone is $78,000, one thousand dollars above spot, where the corrected chart reveals the deepest amplifying pocket in this entire expiry.
Open Interest: Follow the Money
The next chart shows where the actual capital is sitting. Think of open interest as the raw material that creates the GEX profile.
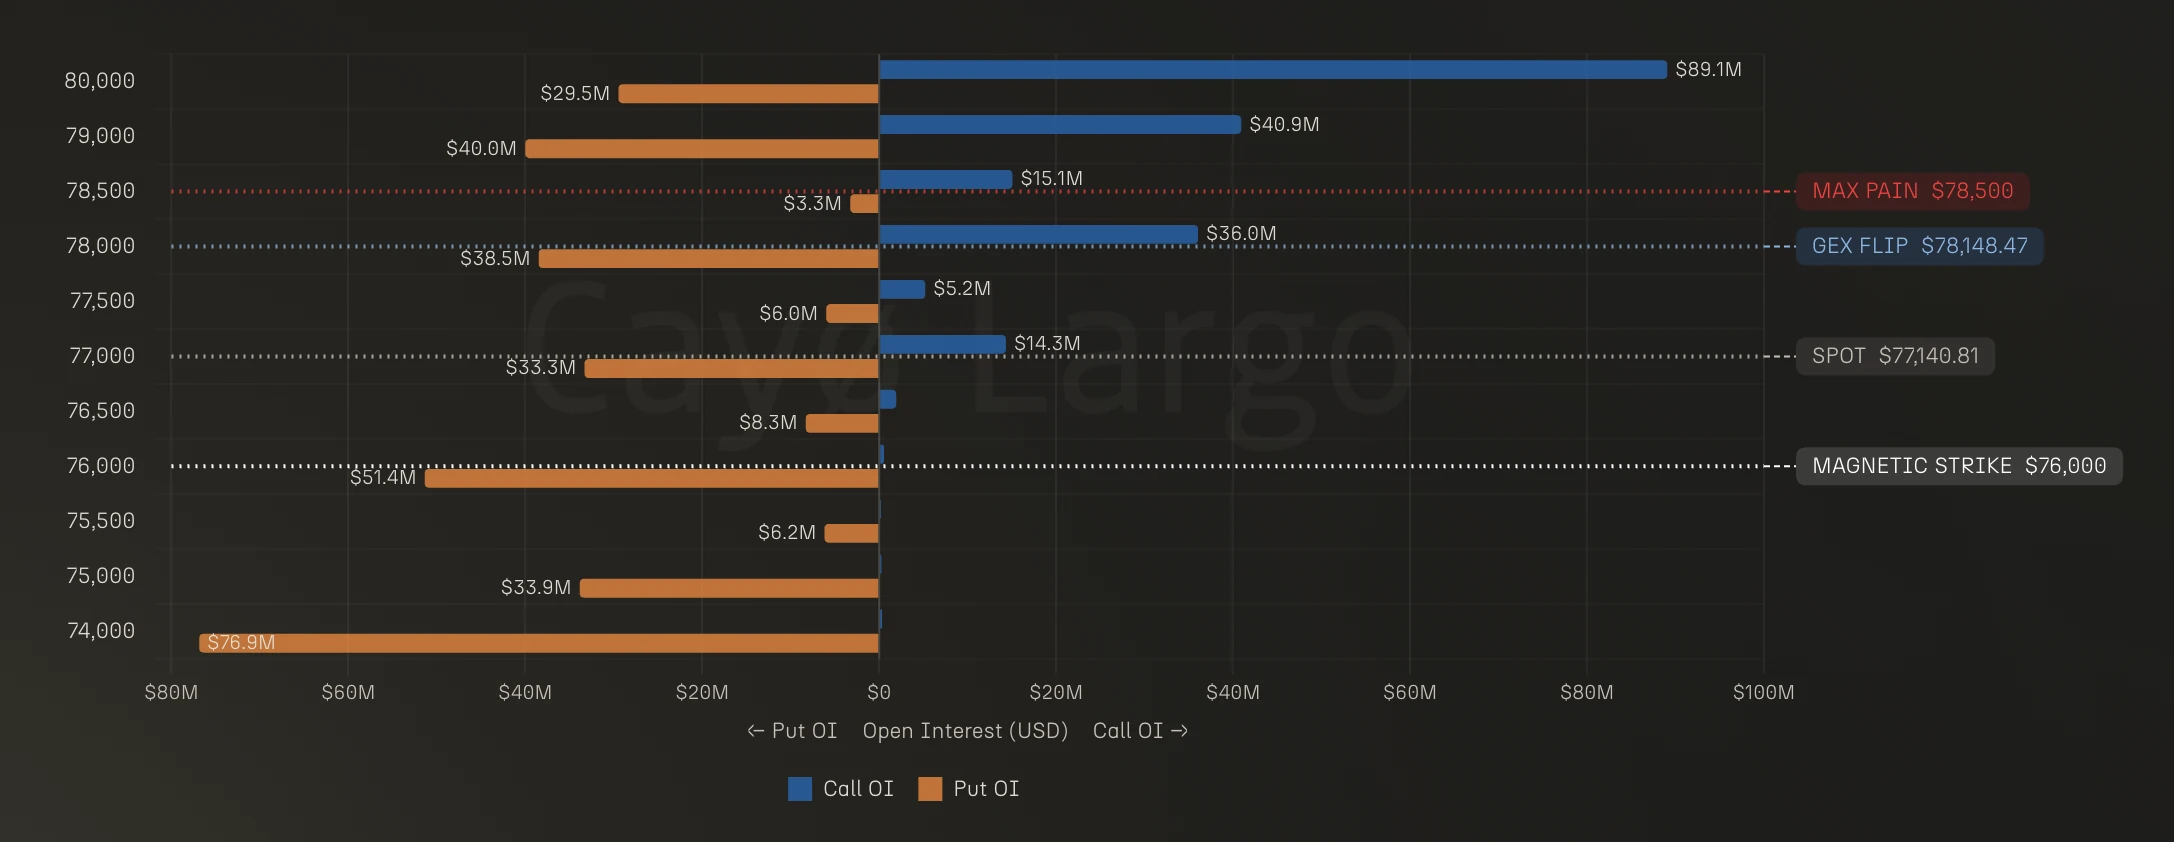
Figure 3: Open Interest by Strike. Massive call OI at $80,000 ($89.1M) and put OI at $74,000 ($76.9M) frame the battlefield. The magnetic strike at $76,000 holds $51.4M in puts.
The two heaviest positions frame a wide battlefield. Call open interest at $80,000 reaches $89.1M, the single largest position on the board. Put open interest at $74,000 counters with $76.9M. Between these poles, the magnetic strike at $76,000 holds $51.4M in puts, and $78,000 has $38.5M in puts against $36.0M in calls, making it the most contested strike on the chain.
Max pain sits at $78,500, about 1.8 percent above spot. That gap between the current price and max pain tells you the market is trading below where options writers expected it to be. As expiry approaches, there's structural pull toward $78,500: every dollar BTC rises toward max pain reduces the aggregate payout options sellers owe.
Gamma Evolution: Watching the Fuse Burn
This chart adds the dimension standard GEX snapshots miss: time.
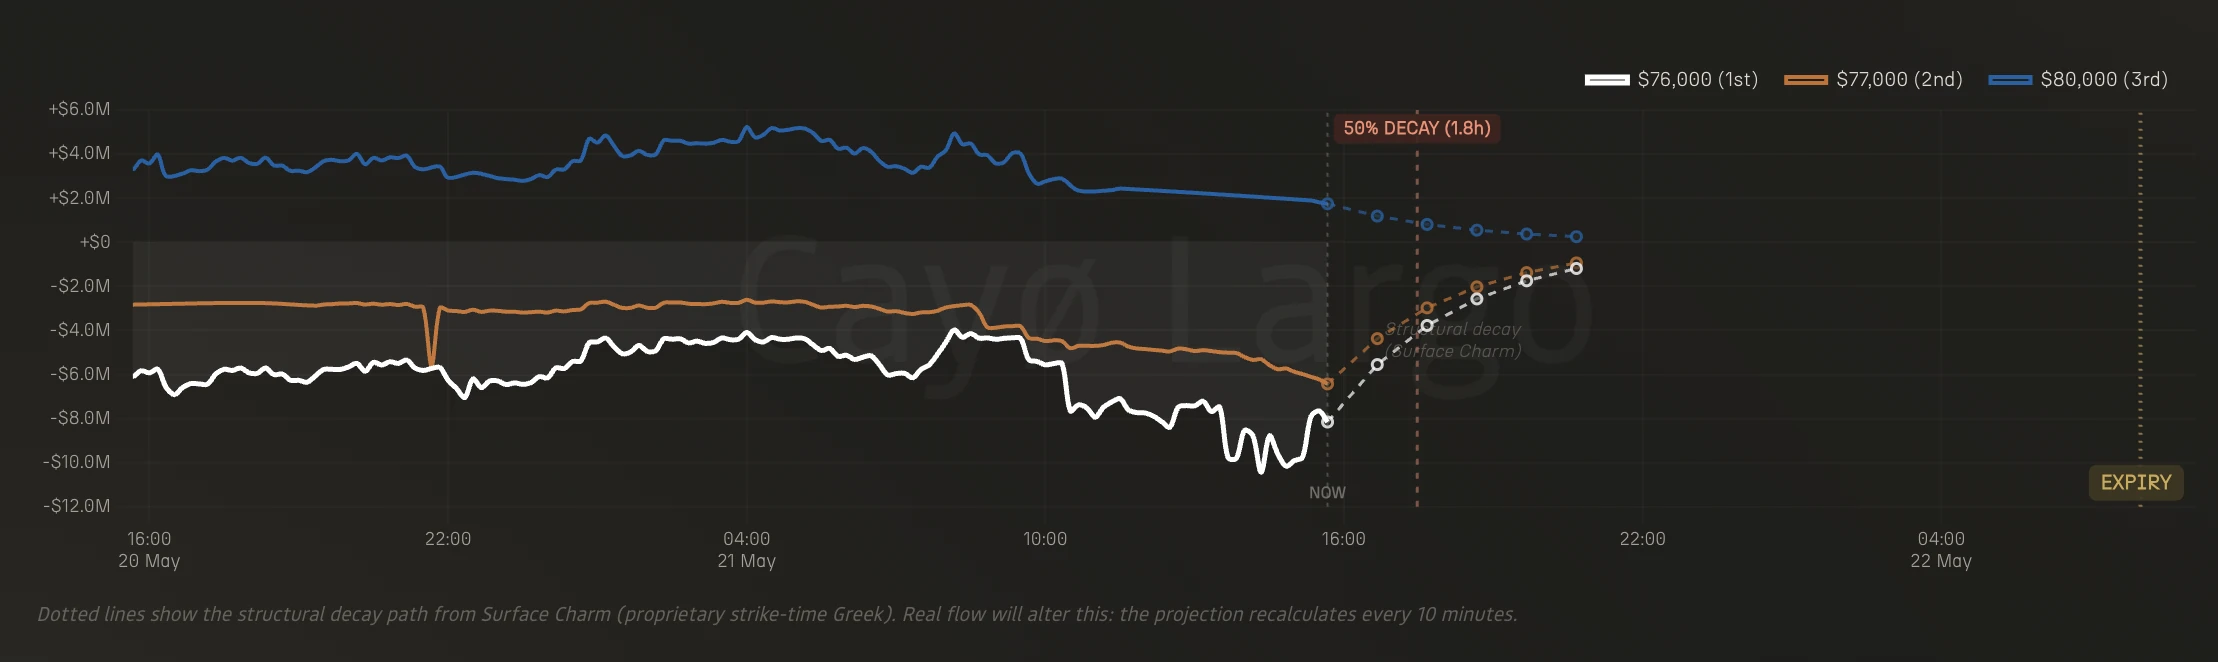
Figure 4: Gamma Evolution by Strike. Three strikes tracked: $76,000 (white), $77,000 (orange), $80,000 (blue). Dotted lines project the structural decay from Surface Charm toward expiry.
The chart tracks three strikes over time. The $76,000 magnetic strike (white line) has been oscillating between -$5M and -$10M, recently spiking deeper before recovering. The $77,000 strike (orange) runs steadier around -$3M to -$4M. The $80,000 strike (blue) is the only positive line, sitting between +$1M and +$2M.
The dotted lines projecting from "NOW" toward expiry are the key feature. These are calculated from Surface Charm, one of Cayø Largo's proprietary strike-surface Greeks:
Surface Charm measures how the option's sensitivity to strike price (dual delta, ) changes as time passes toward expiration. This is different from standard Charm (which tracks how delta decays over time). Surface Charm tells you how fast the pricing structure at a specific strike flattens as expiry approaches: when it flattens, the magnetic pull at that strike fades. The projected half-life follows from it directly:
The half-life here is 1.8 hours. That means 50 percent decay by approximately 17:28 UTC on May 21, which is just 11 percent of the remaining 16-hour window. The dotted decay paths show all three strikes converging toward zero as expiry approaches: the structural force dissolves, and the price becomes free to move.
Breakout Zone: Where the Price Goes Next
The final chart ties everything together.
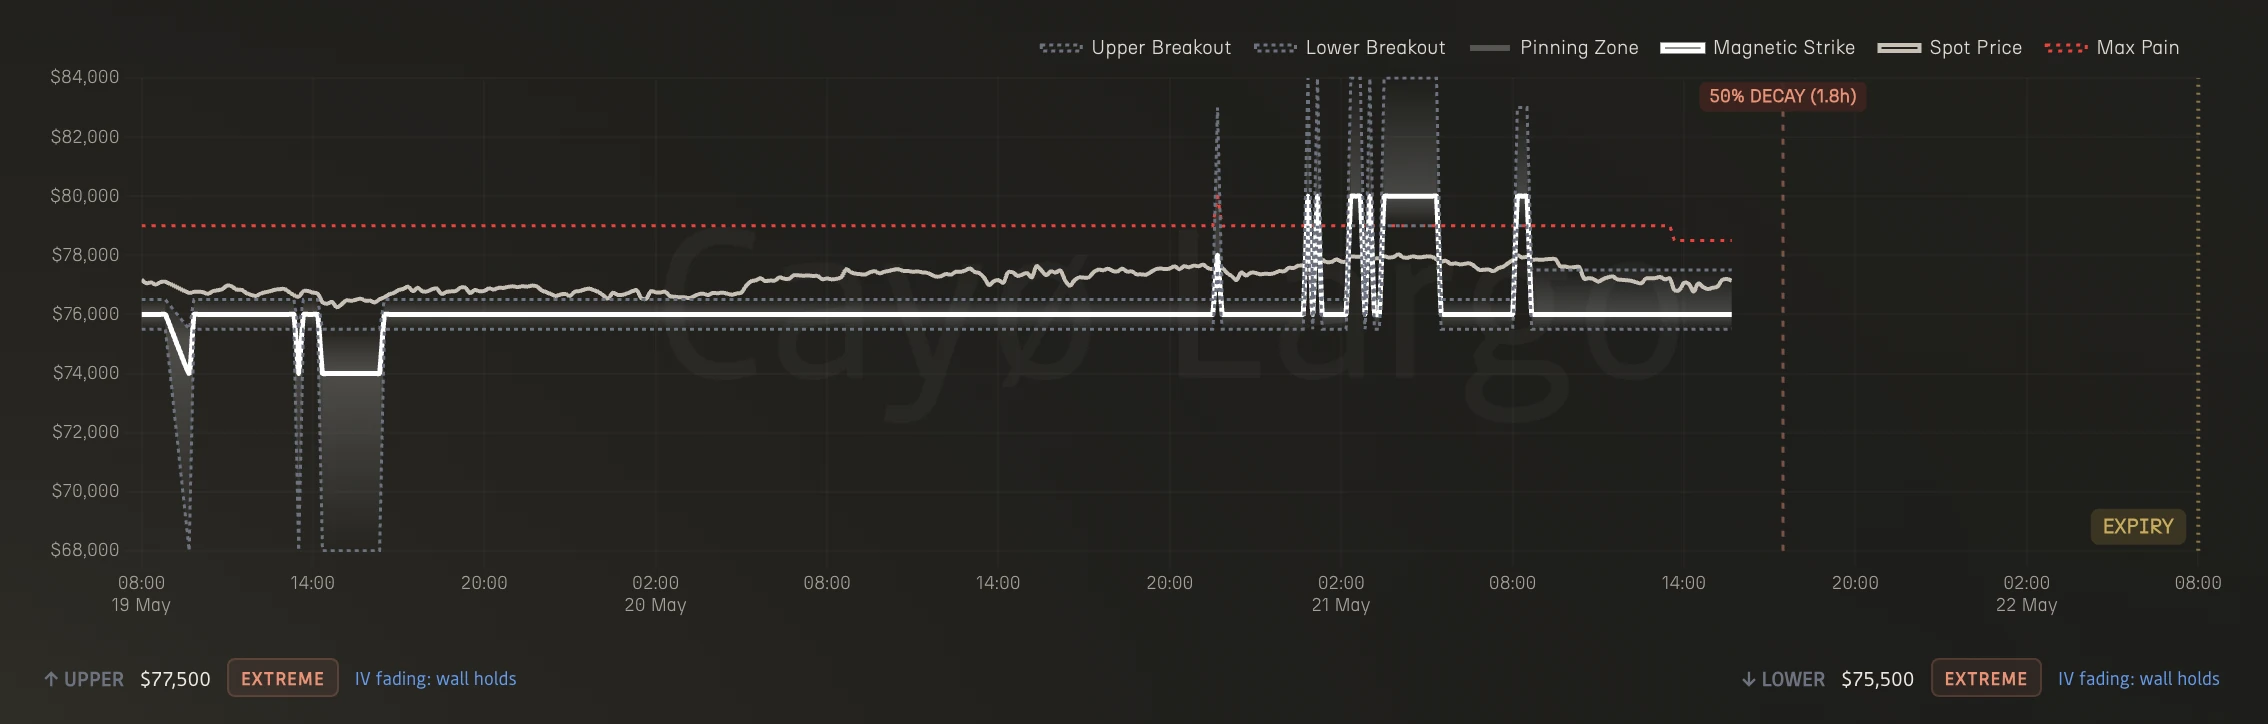
Figure 5: Breakout Zone Evolution. Upper breakout at $77,500 and lower at $75,500, both EXTREME. IV fading at both boundaries: wall holds. A $2,000 corridor with 1.8h of pinning left.
The upper breakout sits at $77,500. The lower breakout at $75,500. Both labelled EXTREME. Both showing "IV fading: wall holds", meaning implied volatility at those strikes is declining, not rising. Nobody is paying up for a breakout in either direction. For now.
That's a $2,000 band. Look at the price history across the chart: BTC dropped sharply to around $73,000 on May 19, recovered, and has since been oscillating within the pinning zone. The magnetic strike at $76,000 has held through multiple tests. Max pain at $78,500 (red dotted line) sits above the entire zone, pulling price gently upward.
But the 1.8-hour half-life means this structure is dissolving fast. Each passing hour weakens the pin. The closer we get to the May 22 expiry, the more likely a directional break becomes. And in a negative gamma regime, dealer hedging will amplify whatever direction the break takes.
What You Just Learned for Free
Five charts. One story. BTC is pinned near $76,000 with a $2,000 breakout corridor closing in from both sides. The gamma regime is negative, meaning any breakout gets amplified. The pinning force has a 1.8-hour half-life, the fastest decay in this article. Standard GEX says the magnet is destabilising. Taker-flow correction tells a different story: the $76,000 strike is actually providing a floor, while $78,000 hides the real amplifying pocket at -$16.1M.
This is the kind of nuance that changes trading decisions. Without the correction, you might short the breakdown through $76,000. With it, you'd recognise the stabilising cushion and look elsewhere.
This is one expiry, one coin, one snapshot. But it shows exactly what gamma exposure analysis gives you: not a prediction, but a map of the forces acting on price. Once you understand the mechanics, every expiry becomes a story you can follow in real time.
Every chart in this article comes from Cayø Largo's GEX Landscape page. It updates every 10 minutes, for every coin we cover, completely free. No login required. No paywall. Just open it and start reading.
Frequently Asked Questions
What is gamma exposure (GEX) in crypto options?
Gamma exposure measures how much hedging activity options dealers need to do when the price moves. When GEX is positive, dealer hedging dampens price swings and pulls the price toward high-interest strikes. When GEX is negative, dealer hedging amplifies moves, making the price more volatile.
What is a magnetic strike?
The magnetic strike is the price level where gamma-weighted open interest is most concentrated. It acts like a gravitational center: dealer hedging activity naturally pushes the price toward this level. It differs from max pain because it accounts for hedging pressure, not just options P&L.
What does negative gamma mean for traders?
In a negative gamma regime, dealer hedging adds fuel to price moves instead of cushioning them. If the price drops, dealers sell more. If it rises, dealers buy more. This creates feedback loops that can accelerate moves in either direction.
What is the difference between standard GEX and taker-flow corrected GEX?
Standard GEX assumes all options were bought by customers and sold by dealers. Taker-flow corrected GEX uses actual trade tape data from Deribit to determine who was the buyer and who was the seller in each transaction. This corrects errors in 55 to 60 percent of cases and gives a more accurate picture of dealer positioning.
Why does the magnetic strike half-life matter?
The half-life tells you how quickly the magnetic strike's gravitational pull is fading. A 1.8-hour half-life means the pinning effect loses half its strength every 1.8 hours. As expiry approaches and the half-life shortens, the price is less constrained and more likely to break out of the pinning zone.
Related Articles
Why Crypto IV Spikes Before Expiry: The Bow Shock
Why does crypto implied volatility spike before expiry? An IV Footprint heatmap shows a bow-shaped front flaring at the wings before each Deribit settlement.
Variance Risk Premium: Are Options Overpriced or Cheap?
How to read IV vs RV charts and the variance risk premium to figure out whether crypto options are overpriced, underpriced, or fairly valued. Live AVAX example from Deribit.
Why Knowing Your Greeks Won't Save You on Deribit
You learned Delta, Gamma, Theta. You can explain Black-Scholes over coffee. Then you open Deribit's options page and none of it helps. Here's why options theory breaks down on a live screen.