4 Traps Between a Crypto-Options Backtest and a Profit
Four crypto-options signals that shine in backtest and die at real fills. What the spread, the wrong vehicle, overlapping windows and a trending coin cost you.
Most options content posts winners. This one shows four signals that did not work, on purpose, because the traps that caught them are worth more than another green curve. Learn the four and you can read almost any options backtest and tell, before a cent is at risk, whether it survives a real order book. We tested each one the honest way, with real fills and a hard cross-asset check. First the setup and the moments it fired, then the trades and what they actually made, then the scoreboard.
The Trading Idea
Here it is, trader to trader. The market goes quiet and you catch a big desk quietly taking its volatility bets off the table. Not its direction, just its bet on how much things will move. A market maker is telling you it thinks nothing is coming and it is getting comfortable.
So you take the other side. The moment everyone is sure it stays calm is usually the moment it does not. You want to be long volatility and the cleanest way to do that is a straddle, a call and a put at the same at-the-money strike. Now you do not care which way price goes, only that it goes. You put the trade on when the signal fires and take it off two days later.
Why a trader likes this one. Your loss is small and known, the premium you paid and no more. But if it breaks, up or down, the further it runs the more you make. A small fixed loss against an open-ended win, while fading a desk that just told you it expects calm. That is the shape of trade you go looking for.
That shape is worth seeing, because it is the same trade in every backtest here. You pay both premiums up front and that total is the floor on the loss. Here is what it pays at expiry.
| Condition | Action | Why | Cohort | Coin | Expected |
|---|---|---|---|---|---|
| Dealer VommaEX dumped, bottom decile, into a calm tape | Buy the ATM straddle, hold 48h | A desk flattening vol into calm is fadeable and quiet tends to break | ATM, ~30 day | BTC, ETH | Realized vol expands, the straddle pays |
The idea in one line. The last column is the thesis, not the outcome. Whether it survives real fills is the rest of this note.
That is one of the four signals in this note and the one that looked best. The picture it comes from holds the other three.
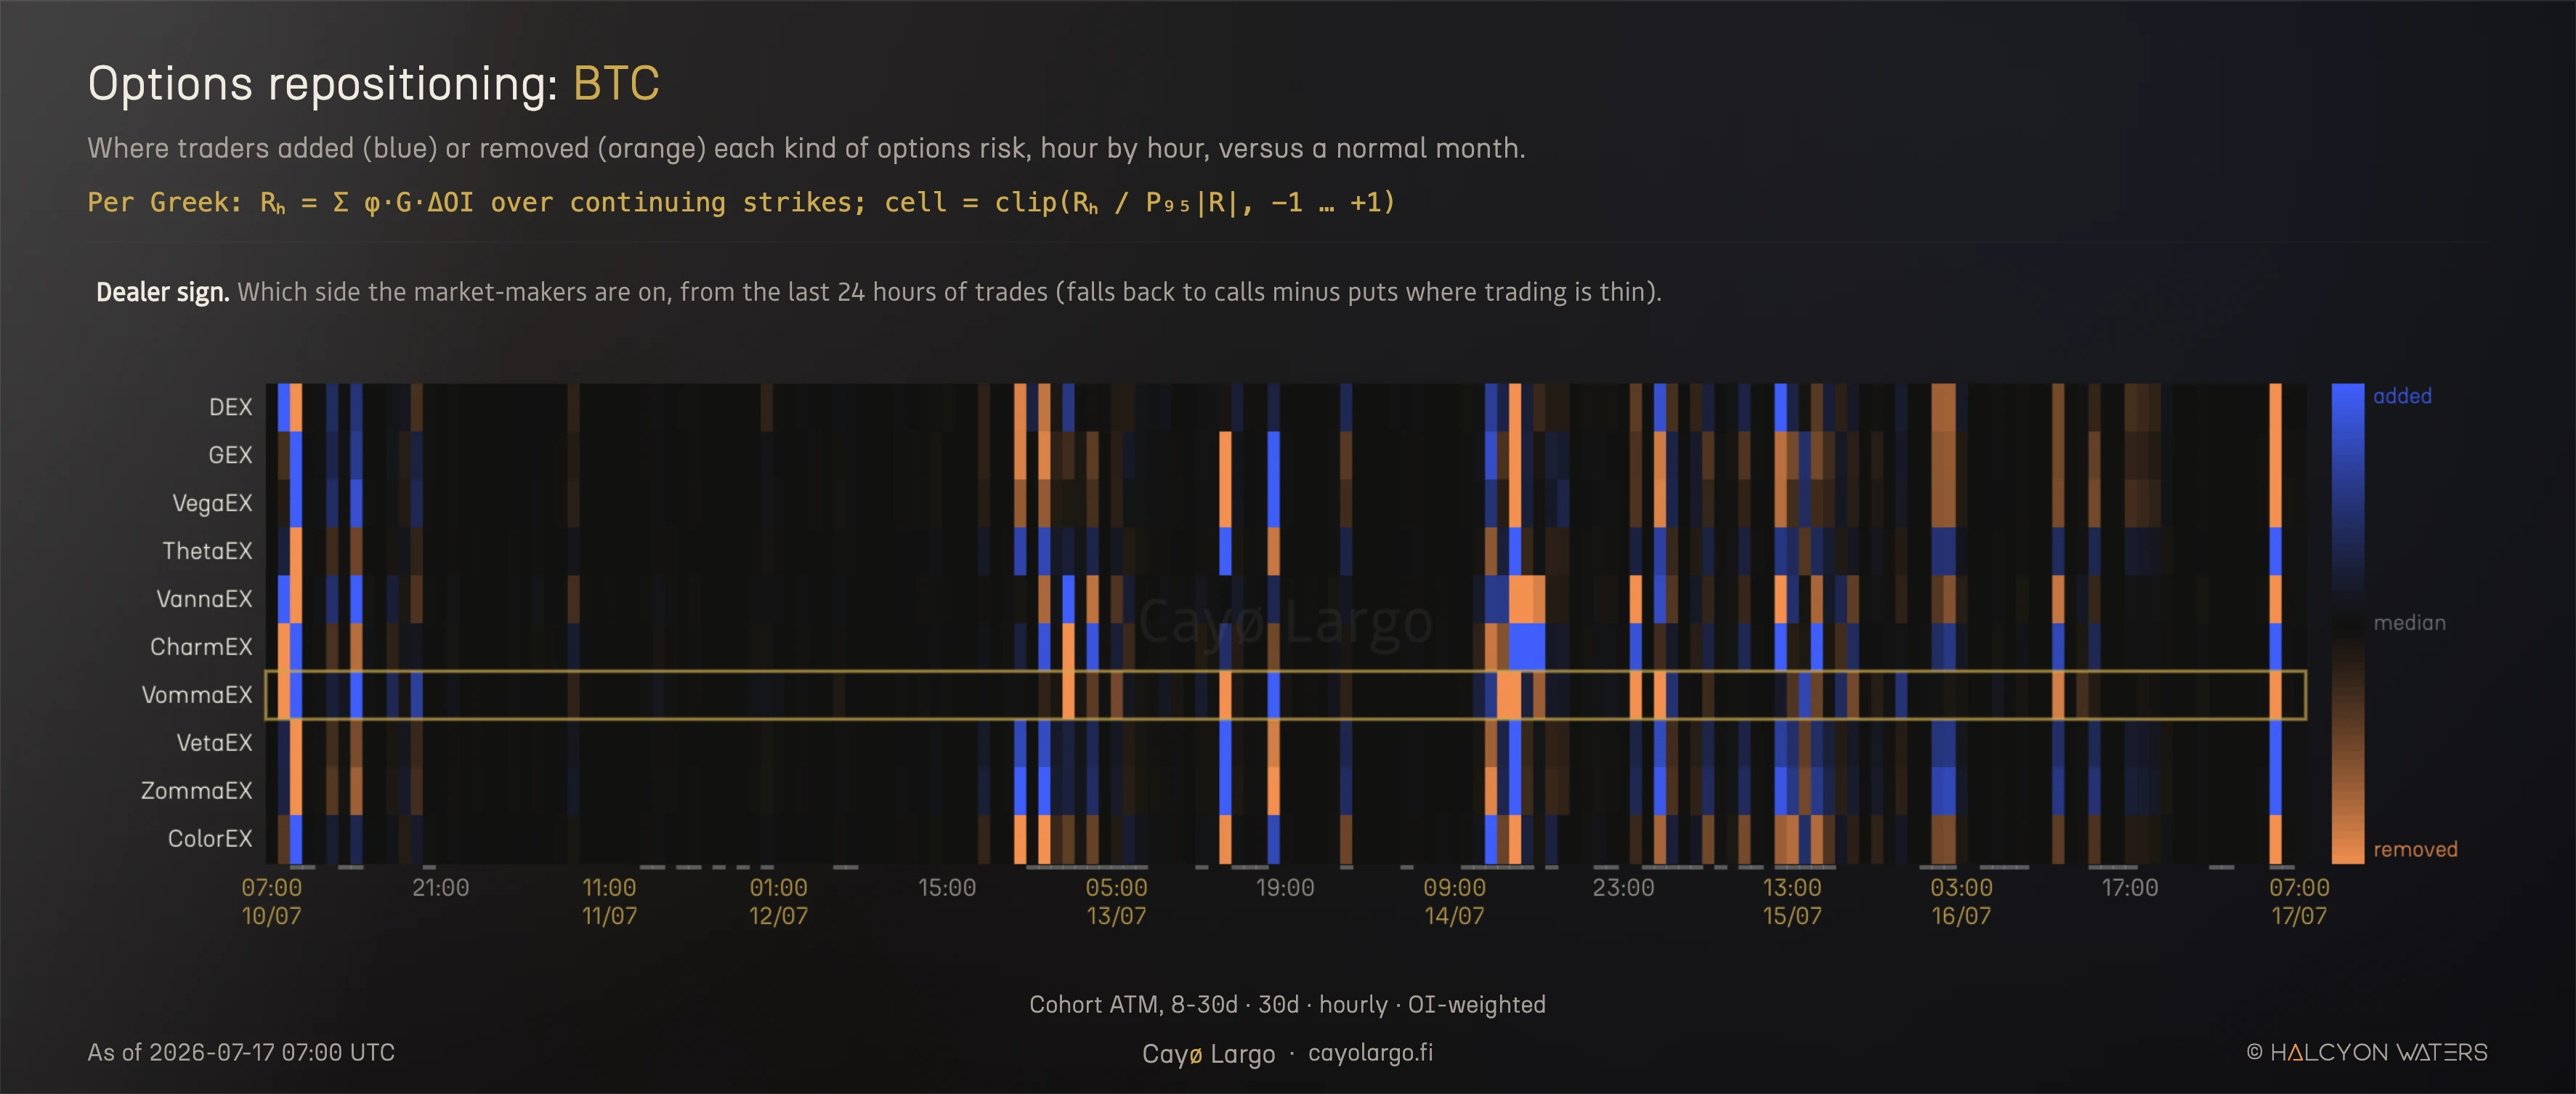
Figure 2. The raw material. Cayo's options repositioning heatmap for BTC, ATM 8-30d, every Greek's dealer-signed flow hour by hour. Blue is exposure added, orange removed. The highlighted VommaEX row is where the first signal came from. Every trap below starts as a bright cell here that looked like it meant something.
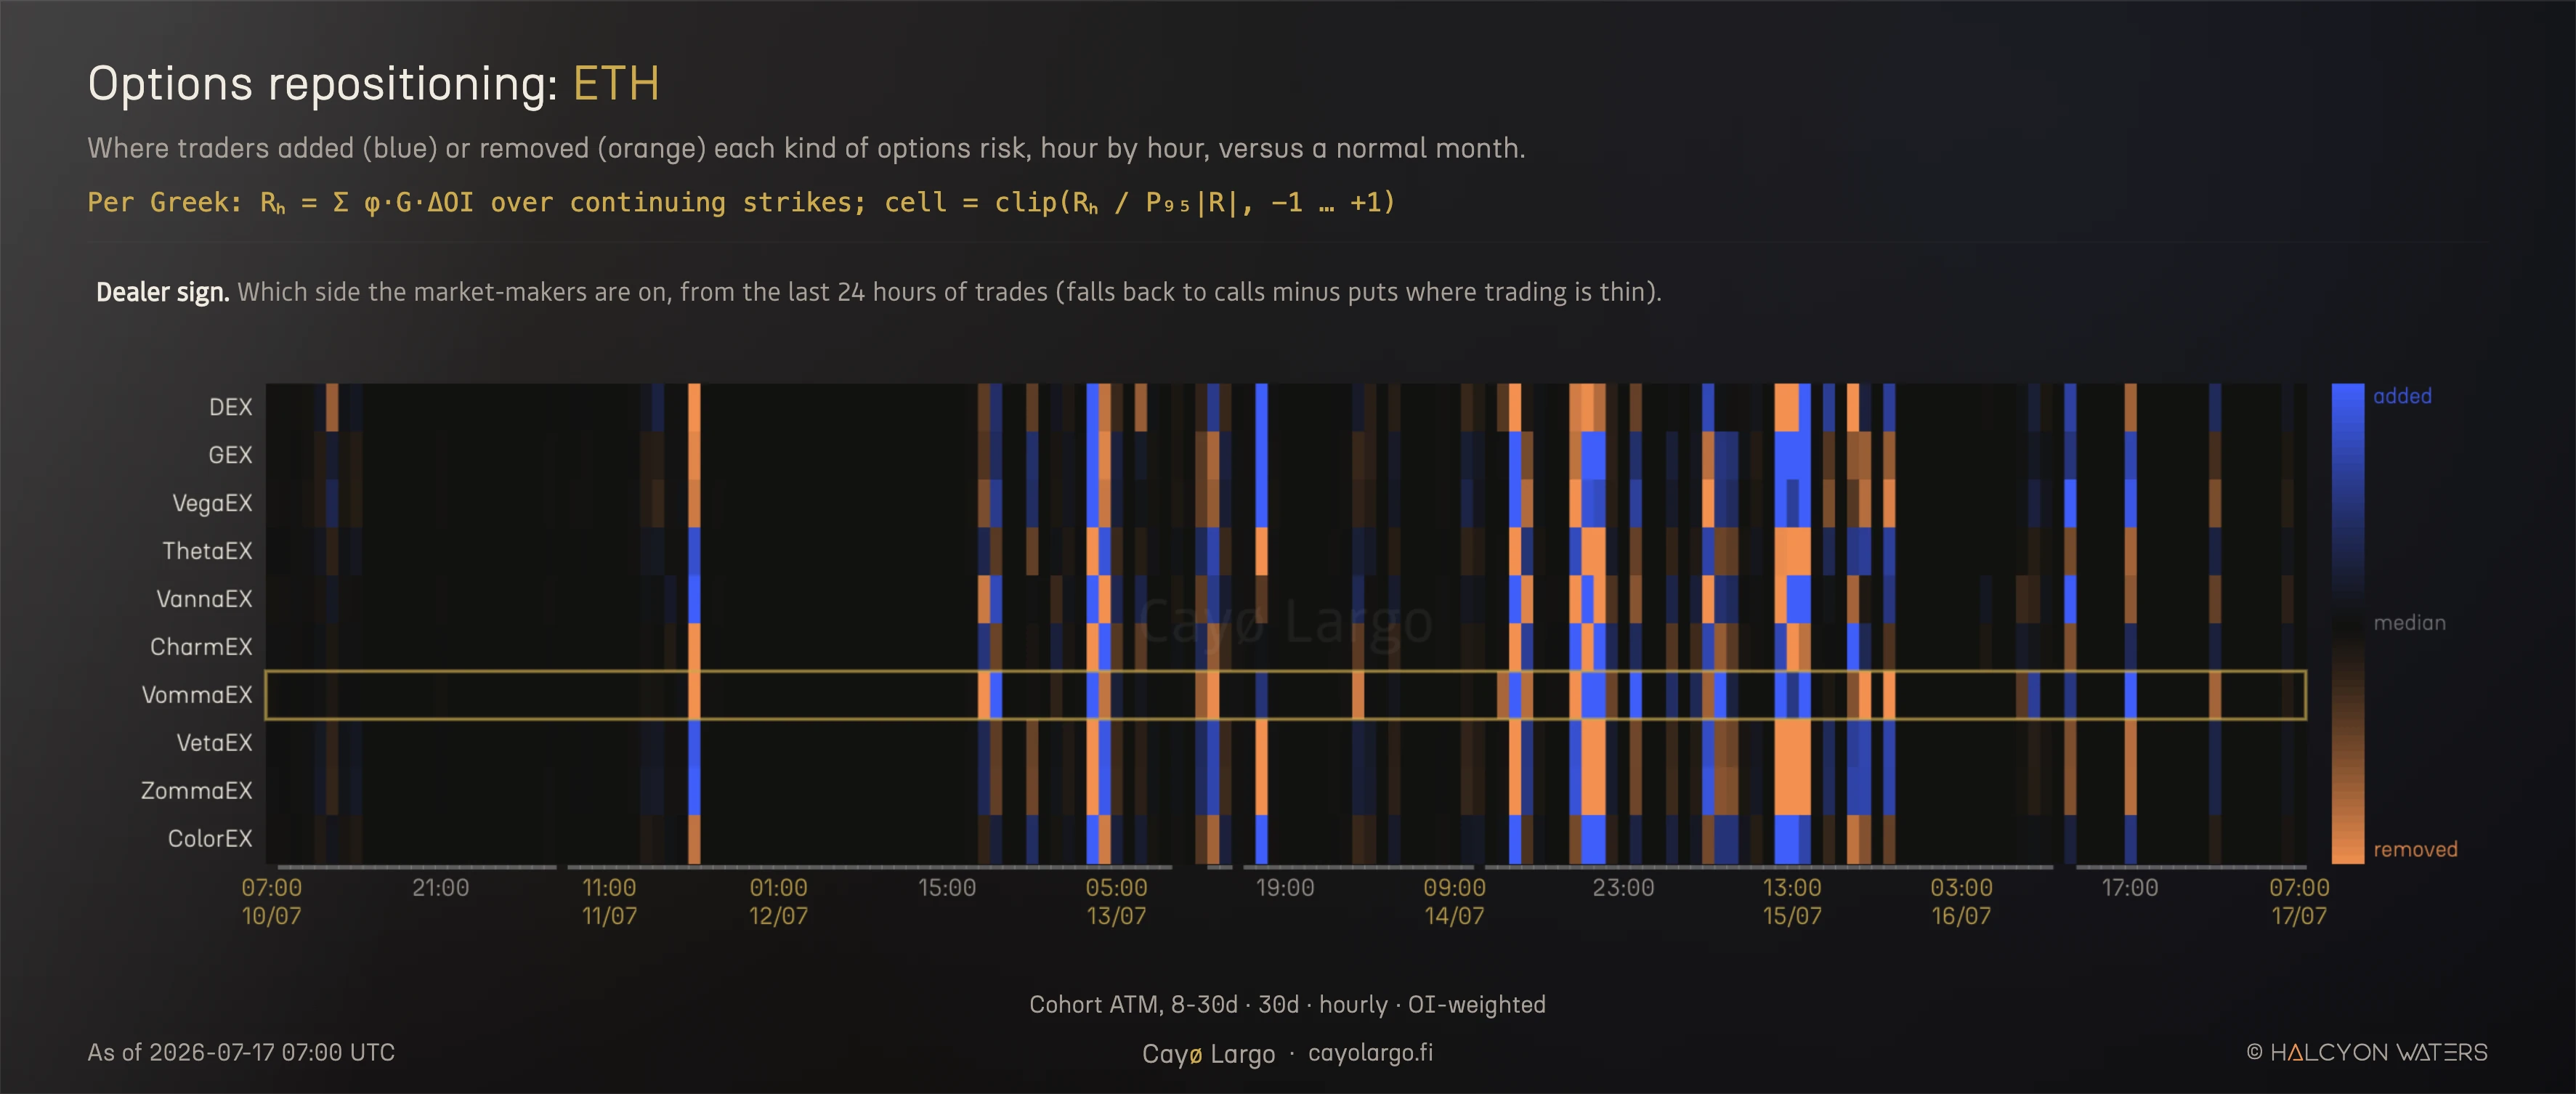
Figure 3. The same read in ETH, same cohort and week. The dump shows up in **both coins at once** and that cross-asset echo is exactly what made it look like a signal worth trading rather than noise in one name.
Same dump, both coins, same week. To judge whether it is tradeable, start with the row it lives on.
From Vomma to VommaEX
To read that picture, start with the row the trade lives on. Vomma is vol-of-vol, how much an option's vega moves when implied volatility itself moves, the curvature of a volatility bet rather than the bet.
Here is vega and the implied vol, so Vomma is vega's own sensitivity to vol, the second derivative of the option price with respect to volatility. Aggregate it across the book, weight each strike by open interest, sign it by which way the dealers leaned and it becomes VommaEX, one row in the repositioning heatmap.
In that heatmap each row is one Greek. Blue means dealers added that risk in the hour, orange means they took it off, measured against a normal month. Each cell is built from what actually traded. For every strike you take the change in open interest, the contracts that changed hands, times the strike's Greek, times the dealer sign and add it up.
Open interest moves only when a position is opened or closed, so this measures trading, not the drift of a Greek as spot wanders. What made the dump attractive was not one orange cell but a coordinated column, VommaEX removed with Vanna beside it and Theta added, a whole column moving as one desk decision you could watch rather than guess at. One detail matters later. Vomma is near zero at the money and lives out in the wings. A signal is simply a row at an extreme, the brightest cell in its recent range and each of the four backtests below picked one and asked the only question that counts. Could you trade it.
Triggers
Here is that one row, VommaEX, across the whole backtest for both coins at once, with every trigger marked. Blue is convexity added, orange removed. A gold caret is a moment the rule fired,
dealer VommaEX in the bottom decile of its own trailing week and trailing realized vol below its median, a calm tape. Here is the dealer-signed VommaEX repositioning at hour , its rank within the trailing seven days, the trailing 24-hour realized vol and its median. We take the first fire of each episode.
A Vol Edge Is Not a Profit
The first signal was a dealer dumping vol-of-vol convexity into a quiet tape, traded as a long at-the-money straddle. Measured as a variance risk premium, implied vol minus the realized vol that followed, it looked clean and it repeated across BTC and ETH. Priced at the mark it returned +21 percent over 26 trades.
Then we paid the spread. Entry at the offer, exit at the bid, the fills you can actually hit. The same 26 trades lost 87 percent. Nothing about the signal changed, only the price it was assumed to fill at. The spread cost about four points per trade against a mark edge of about eight tenths of a point, five times the edge. A vol-point edge is the profit of a perfectly hedged, cost-free position. It is not what a straddle you buy and sell returns.
Here are both lines, same trades. The gold prices every fill at the mark. The red pays the spread you would actually pay.
Each of those two lines is a sum. Here is what the gold one sums, one option at a time.
Aligned at hour zero, the paths above show each trade's shape. Slide them back to when they actually happened and you get the programme in real time, several trades often live at once.
How each trade runs, in full. This is event-driven, one trade per trigger. The signal fires at a moment, shown in the Opened column and that is when the straddle goes on. It is held 48 hours and closed, no earlier exit. The 26 triggers are 26 distinct moments across three weeks, not one setup repeated. At mark is the paper P&L at the close, At fills is that close priced at real bid and offer and Best exit is the most you could have banked by liquidating at the peak, also at fills. Even that best real exit is red for more than half the trades: the fat peaks you see at mark were never reachable through the spread. Click any row for its full 48-hour path.
Click any row to drop down that option's own 48-hour path.
| Opened (trigger) | Straddle | Paid $ | Sold $ | At mark | At fills | Best exit | Spread | |
|---|---|---|---|---|---|---|---|---|
| ▸ 1 | 19 Jun 19:00 | BTC-10JUL26-63000-C + -P | 4634 | 4459 | −0.9 | −3.8 | −2.0 | −2.9% |
| ▸ 2 | 20 Jun 19:00 | ETH-10JUL26-1700-C + -P | 173 | 158 | −5.7 | −8.7 | −2.9 | −3.0% |
| ▸ 3 | 22 Jun 10:00 | ETH-10JUL26-1750-C + -P | 161 | 151 | −0.3 | −6.7 | +2.7 | −6.4% |
| ▸ 4 | 23 Jun 04:00 | BTC-10JUL26-64000-C + -P | 4225 | 4469 | +11.7 | +5.8 | +16.9 | −5.9% |
| ▸ 5 | 23 Jun 05:00 | ETH-10JUL26-1700-C + -P | 152 | 149 | +0.9 | −2.2 | +10.3 | −3.1% |
| ▸ 6 | 24 Jun 09:00 | BTC-10JUL26-63000-C + -P | 3980 | 4177 | +14.9 | +5.0 | +35.9 | −9.9% |
| ▸ 7 | 24 Jun 13:00 | ETH-10JUL26-1650-C + -P | 146 | 169 | +21.0 | +16.2 | +16.2 | −4.8% |
| ▸ 8 | 27 Jun 20:00 | BTC-17JUL26-60000-C + -P | 4810 | 4347 | −7.1 | −9.6 | +1.9 | −2.5% |
| ▸ 9 | 28 Jun 23:00 | ETH-17JUL26-1550-C + -P | 169 | 148 | −9.8 | −12.5 | −3.2 | −2.7% |
| ▾ 10 | 1 Jul 13:00 | ETH-31JUL26-1550-C + -P | 203 | 243 | +26.5 | +19.5 | +19.5 | −7.0% |
ETH-31JUL26-1550-C + -P Opened 1 Jul 13:00 → closed 3 Jul 13:00 (held 48h). Peaked +26.5% at mark (48h), best real exit +19.5%. Ended +26.5% at mark, +19.5% at fills. The gap between the two lines is the spread. | ||||||||
| ▸ 11 | 3 Jul 16:00 | ETH-31JUL26-1750-C + -P | 194 | 186 | −0.6 | −4.2 | −2.6 | −3.6% |
| ▸ 12 | 3 Jul 18:00 | BTC-31JUL26-62000-C + -P | 5187 | 4944 | −2.9 | −4.7 | −1.1 | −1.8% |
| ▸ 13 | 4 Jul 13:00 | ETH-31JUL26-1750-C + -P | 191 | 184 | −1.6 | −4.0 | −0.6 | −2.4% |
| ▸ 14 | 4 Jul 18:00 | BTC-31JUL26-63000-C + -P | 5056 | 4701 | −4.5 | −7.0 | −1.4 | −2.5% |
| ▸ 15 | 5 Jul 17:00 | ETH-31JUL26-1750-C + -P | 191 | 182 | −1.9 | −5.0 | −2.4 | −3.1% |
| ▸ 16 | 5 Jul 19:00 | BTC-31JUL26-63000-C + -P | 4988 | 4576 | −4.8 | −8.3 | −2.9 | −3.5% |
| ▸ 17 | 6 Jul 07:00 | ETH-31JUL26-1750-C + -P | 190 | 174 | −5.2 | −8.5 | −2.0 | −3.3% |
| ▸ 18 | 6 Jul 08:00 | BTC-31JUL26-63000-C + -P | 4795 | 4523 | −2.6 | −5.7 | −0.2 | −3.1% |
| ▸ 19 | 9 Jul 09:00 | ETH-31JUL26-1750-C + -P | 438* | 156 | −5.0 | excl. | excl. | bad quote |
| ▸ 20 | 10 Jul 01:00 | ETH-24JUL26-1750-C + -P | 131 | 123 | −1.9 | −6.1 | +2.0 | −4.2% |
| ▸ 21 | 10 Jul 06:00 | BTC-31JUL26-64000-C + -P | 4259 | 3835 | −7.2 | −9.9 | −2.5 | −2.7% |
| ▸ 22 | 11 Jul 18:00 | ETH-31JUL26-1850-C + -P | 157 | 161 | +8.2 | +2.5 | +2.5 | −5.7% |
| ▸ 23 | 12 Jul 18:00 | ETH-31JUL26-1800-C + -P | 158 | 154 | +2.7 | −2.5 | −2.5 | −5.2% |
| ▸ 24 | 13 Jul 01:00 | BTC-31JUL26-64000-C + -P | 4029 | 3755 | −3.5 | −6.8 | −0.8 | −3.3% |
| ▸ 25 | 14 Jul 13:00 | BTC-31JUL26-64000-C + -P | 3763 | 3421 | −6.1 | −9.1 | +0.4 | −3.0% |
| ▸ 26 | 14 Jul 13:00 | ETH-31JUL26-1850-C + -P | 150 | 139 | −5.0 | −7.9 | +1.6 | −2.9% |
| ▸ 27 | 15 Jul 06:00 | ETH-31JUL26-1900-C + -P | 143 | 139 | +6.8 | −2.6 | −0.3 | −9.4% |
Table 2: Every straddle, the two contracts and their dollars, priced at the mark and at real fills. The mark column is a coin flip that averages slightly positive. The fills column is red almost everywhere and the spread column is why. Trade 19 paid an entry quote 160 percent over mark, a stale print, so it is dropped. This is the gap a backtest hides, one trade at a time.
A word on size. Each trade is one straddle, one call and one put, one contract per leg. On Deribit that is one BTC for a BTC straddle and one ETH for an ETH straddle, which is why the dollar columns sit near 4,000 for BTC and 150 for ETH. Every number here is a percent of the premium you put up, so it does not scale with size. One straddle or a hundred returns the same percentage. Trades are weighted equally by premium, not by dollars, so a small ETH straddle counts the same as a large BTC one. And fills only worsen as size grows past the top of book, so the spread drag above is the optimistic case.
Every number in that table comes out of the Cayo Largo SDK. The trigger scan, the straddle it picks and both the mark and fills legs are a short script.
import cayolargo as cl

cayo = cl.Client()   # key from ~/.cayolargo/credentials

# 1. The trigger: dealer VommaEX in the bottom decile of its trailing
#    week, dropped into a calm tape. Collapse overlaps to one per episode.
triggers = (
    cayo.repositioning
        .scan(coins=["BTC", "ETH"], cohort="ATM_DTE_30", greek="vomma")
        .where(cl.pctile("repositioning_dealer", window="7d") <= 0.10)
        .where(cl.realized_vol(window="24h") <= cl.median("realized_vol"))
        .since("2026-06-19")
        .dedupe(min_gap="12h")
)

# 2. Buy the nearest ATM ~30d straddle at each fire, hold 48h and price
#    it both ways: mark-to-mark and offer-in / bid-out for real fills.
ledger = []
for t in triggers:
    s = cayo.options.straddle(coin=t.coin, at=t.ts, dte=30, moneyness="atm")
    fills = s.path(t.ts, hold="48h", price="fills")   # taker at both ends
    ledger.append({
        "opened":   t.ts,
        "straddle": s.name,
        "paid":     s.entry(t.ts).ask_usd,             # what you pay
        "sold":     s.exit(t.ts + cl.hours(48)).bid_usd,
        "at_mark":  s.pnl(t.ts, hold="48h", price="mark"),
        "at_fills": fills.last,
        "best":     fills.max,        # best exit you could actually hit
    })

df = cl.DataFrame(ledger)
print(df.summary())
# 26 trades · at mark +21.1% · at fills -86.8% · best exit red on 15The Vehicle Has to Fit the Move
The same signal died a second way and this one generalizes. A thirty-day at-the-money straddle costs about ten percent of spot in premium, so it needs roughly a ten percent move to break even. The signal preceded moves of about three percent. The trade needed three times the move it was built to catch. No signal quality fixes a vehicle whose breakeven is triple the move on offer.
This is why the cost structure decides everything and why we moved every later test onto the perpetual. A directional signal trades the perp at about ten basis points. The same signal expressed in options fights a spread sixty times wider. Before asking whether a signal is real, ask what it would cost to trade, because the cheapest correct expression is usually the only one that survives.
Overlapping Windows Lie
The second signal looked like the fix. In the wings, where vomma actually lives, dealers adding convexity in far-above-spot calls preceded an up move of about +1.3 percent in both coins and it was directional, so it belonged on the cheap perp. On the discovery scan it was the best lead we had.
It was an artifact. The scan measured seventy hourly fires but forty-eight-hour windows that start one hour apart overlap almost completely, so those seventy samples were really about twelve independent episodes and two clustered up-moves carried the whole average. It also ranked each fire against the full sample, which quietly uses the future to define the present. De-cluster to independent episodes and rank against only the trailing week and the +1.3 percent became minus 0.7 percent in BTC, negative before costs. The edge was in the measurement, not the market.
The Trend in Disguise
The last check is the one that killed the most leads, so it deserves the last word. Whenever a signal looked directional, it looked directional in ETH, which drifted up all window. The clean control is BTC, which was range-bound, so its baseline forward return sits near zero. Any real directional edge has to show up there too.
None did and the most instructive case is our own. Cayo's activity signal labels positioning bullish or bearish. Bet those labels as a naive 24-hour direction call and the two sides land within a tenth of a percent of each other and of the baseline, up about half the time. That is the honest result and the correct one. The activity signal reads dealer positioning, not the next move and this is the proof it does not pretend otherwise. A tool that will not fake a forecast it was never built to make is a tool you can trust with the ones it was.
| Coin | Signal | Return 24h | Up rate |
|---|---|---|---|
| BTC | baseline | −0.03% | 0.508 |
| BTC | bullish | −0.09% | 0.518 |
| BTC | bearish | −0.03% | 0.530 |
| ETH | baseline | −0.05% | 0.500 |
| ETH | bullish | −0.01% | 0.499 |
| ETH | bearish | −0.07% | 0.485 |
Table 3: The activity signal's labels against the next 24 hours of spot. Bullish and bearish are indistinguishable from each other and from doing nothing, because the label reads options positioning, not price. That is the design, not a defect.
Dealer gamma is the one signal with a direct mechanical link to spot, since a short-gamma desk has to hedge with the move and amplify it. It shows a faint short-gamma momentum in BTC, the direction the theory predicts and nothing in ETH. Neither side clears the ten basis points it costs to trade.
| Coin | Gamma regime | Momentum 6h | Momentum 24h |
|---|---|---|---|
| BTC | short gamma | −0.08% | +0.14% |
| BTC | long gamma | −0.17% | −0.10% |
| ETH | short gamma | −0.13% | −0.12% |
| ETH | long gamma | −0.11% | −0.14% |
Table 4: Momentum PnL after cost, following the trailing move by gamma regime. Only the BTC short-gamma cell at 24 hours is even faintly green and it does not survive in ETH. The one signal with real physics behind it still fails the cross-asset test.
Every exciting number we found lived in the trending coin and vanished in the flat one. A signal that only works where the market was already going is not a signal. It is the market.
What the Losers Teach
A signal is easy to make look good. Price it at the mark, average over overlapping windows, show the coin that trended and almost anything prints a positive number. The work is in the tests that take those numbers away. The four sections above are four ways a signal fools you before it reaches an account. Here they are side by side, one row each: every one passed the eye test and failed a real one, which is what separates a backtest from a track record.
The Scoreboard
| Signal | Trade | On paper | Honestly | Killed by |
|---|---|---|---|---|
| VommaEX dump, ATM | 30-day straddle | +21% | −87% | the spread |
| VommaEX add, wings | long perp | +1.3% / signal | ~0 | overlap inflation |
| Cayo activity signal | as a 24h direction bet | — | flat, both coins | positioning read, not a forecast |
| Dealer gamma (GEX) | perp momentum | faint in BTC | null in ETH | cross-asset control |
Table 1: Four signals, BTC and ETH, mid-2026. Every one looked worth trading in the loose measurement and failed the tight one. The "killed by" column names the four traps the sections above worked through.
The Bar Every Signal Must Clear
Four honest nulls is not a wasted month. It is a filter. The two tests that did the killing, de-clustering and the cross-asset control, plus the two costs that did the rest, the spread and the vehicle, are now the bar every future idea has to clear before it earns a green line. Most of what looks like edge in options data does not clear that bar and saying so plainly is the whole point.
The reason we can run these screens at all is the data underneath them: dealer-signed repositioning per Greek and cohort, realized-vol regime at ten-minute resolution, gamma exposure by strike, all captured every ten minutes. That is what lets us test a claim honestly instead of admiring it and it is the same data every green signal will one day have to survive. The scoreboard stays open. The next idea gets the same four tests and if it clears them, it will have earned the curve.
Disclaimer
This article is published by Halcyon Waters sp. z o.o. (Cayo Largo) for general information and educational purposes only. It is a study of a systematic signal on historical data. It is not investment advice, not a personal recommendation, not an offer or solicitation to buy or sell any financial instrument, and not an inducement to enter into any transaction.
Cayo Largo is a data and analytics provider. It is not a broker, an investment adviser, or a portfolio manager. It does not execute trades or hold client funds, and nothing here is tailored to the circumstances, objectives, or risk tolerance of any reader. You are solely responsible for your own decisions and should seek independent professional advice before trading.
Options and other derivatives are high-risk instruments. They can move sharply, can expire worthless, and can lose more than the amount committed. You can lose your entire investment.
Any performance shown is hypothetical and backtested. It is calculated with the benefit of hindsight over past data and does not represent actual trading. It does not account for fees, funding, slippage, liquidity, or the ability to enter or exit at the prices shown. Hypothetical results have inherent limitations and frequently differ from results actually achieved. Past performance is not indicative of future results.
Market data, including data sourced from Deribit, is believed to be reliable but is not guaranteed to be accurate or complete. Cayo Largo accepts no liability for any loss arising from the use of this material.
Frequently Asked Questions
Why publish signals that did not work?
Because the reasons they failed are the tradeable knowledge. A signal that looks profitable on paper and loses at real fills teaches you more than a curve that was never costed. Most options content shows only winners, which hides exactly the mistakes that cost money. This is the record of four honest tests and what killed each one.
What is the single most common way an options signal fails?
The cost structure. A vol-point edge measured at the mark is not a profit and loss. Once you pay the bid-offer to trade two option legs, a small statistical edge becomes a large loss. The signal that returned +21 percent at the mark lost 87 percent at fills you could actually take, on the same trades. The spread was about five times the edge.
How do you tell a real signal from a lucky backtest?
Two tests kill most false positives. De-cluster overlapping windows into independent events, because 70 hourly fires are often 12 real episodes and a couple of them can carry a whole average. And demand cross-asset consistency, because an effect that shows up only in the coin that happened to trend is the trend, not the signal. Every lead we found died to one of these two checks.
Did dealer gamma predict anything?
Faintly in BTC and not at all in ETH. Short-gamma bars were slightly more trending in BTC, the direction the theory predicts but the effect did not clear costs and reversed in ETH. Cross-asset consistency, the same check that killed the other leads, killed this one too.
How do you account for the bid-ask spread when backtesting an options strategy?
Price entries at the offer and exits at the bid, the fills you can actually hit, not the mark or the mid. For a two-leg trade like a straddle the round-trip spread is large: here it cost about four points per trade against a mark edge of under one point. Backtesting at the mark hides that entirely. The same 26 trades went from plus 21 pct at the mark to minus 87 pct at real fills.
Why does a 30-day ATM straddle need about a 10 pct move to break even?
You pay both the call and the put premium up front and a 30-day at-the-money straddle costs roughly 10 pct of spot combined. Price has to travel far enough for one leg to recover both premiums, so the breakeven move is about the size of the premium, near 10 pct. The signal here preceded moves of about 3 pct, so the vehicle needed three times the move it was built to catch.
Related Articles
Crypto Variance Risk Premium: Live IV vs RV on Six Coins
How to read IV vs RV charts and the variance risk premium to figure out whether crypto options are overpriced, underpriced, or fairly valued. Live AVAX example from Deribit.
How to Read Gamma Exposure: Bitcoin GEX Live Case Study
BTC trades at $77,140 with $51 million in put open interest stacked at $76,000 and the gamma regime deep in negative territory. Expiry is 16 hours away. Here's how to read every chart on the GEX Landscape page and what each one tells you about what happens next.
What a Greek Z-Score Misses About Options Positioning
A Greek panel can tell you the level of exposure and whether the surface is in an unusual state. Neither answers what anyone traded. This is the maths of a third view, an open-interest-weighted repositioning channel that measures trading and stays silent when nobody trades.
Why Knowing Your Greeks Won't Save You on Deribit
You learned Delta, Gamma, Theta. You can explain Black-Scholes over coffee. Then you open Deribit's options page and none of it helps. Here's why options theory breaks down on a live screen.