What a Greek Z-Score Misses About Options Positioning
A Greek panel can tell you the level of exposure and whether the surface is in an unusual state. Neither answers what anyone traded. This is the maths of a third view, an open-interest-weighted repositioning channel that measures trading and stays silent when nobody trades.
Put a Greek panel in front of a trader and they will ask it three questions. How much exposure is on the book. Is the surface in an unusual state right now. And what did anyone actually do.
The first two have good answers. Exposure by strike is a sum you can compute from open interest and a pricing model. Unusualness is a z-score, each Greek measured against its own rolling history, coloured across all 37 Greeks and four derivative orders. Both are legitimate instruments and we run both.
The third question is the one this note is about, because for a long time we answered it by squinting at the other two. That does not work. The reason it does not work is structural rather than a matter of tuning. This note sets out the maths of a measure built to answer it directly and then tests that measure against an episode where the other views disagreed with it.
Three Questions, Two Answers
Start with what positioning means, precisely. A trader asking "what did anyone do" is asking about a change in the book: contracts that were not there an hour ago and are there now, or the reverse. That is a statement about open interest. It is not a statement about price, or about volatility, or about how far any quantity sits from its recent average.
Hold that definition against the two views we already had.
The exposure view reports a level. It tells you the book carries so much gamma at the 64,000 strike. Levels are useful and they are not flow. A level that has not changed since yesterday and a level that was rebuilt from scratch this morning read identically.
The anomaly view reports distance from history. It tells you a Greek is far from its own normal. That is a real signal about market state. It is the correct instrument when you want to know which order of Greek felt a regime shift first. It is silent on whether a human was involved.
Neither view is broken. The gap is that positioning is a third question. It needs its own arithmetic.
Why Greeks Alone Cannot Carry Positioning
The constraint is upstream of any dashboard choice. It is worth stating cleanly because it rules out a whole family of would-be fixes.
A Black-Scholes Greek is a deterministic function of four inputs, spot , strike , time to expiry and implied vol . Aggregate a set of Greeks with fixed weights over a fixed set of options and the aggregate is still a deterministic function of those same inputs. Trading is not one of the inputs.
So any quantity built from the Greek alone can move for exactly three reasons. Spot moved, the clock ran, or the surface moved. There is no channel through which a trade can enter. Read the hands of a clock all day and you will never learn who wound it. This is true of the raw Greek, of a rolling average of it, of a z-score on it and of any ratio between two of them. You cannot recover flow from a function that never took flow as an argument.
One corollary catches people, so it is worth stating plainly. You cannot use one Black-Scholes Greek to confirm another. They share and , so their ratios are algebraic identities. In our data the correlation between Vomma-over-vega and ultima-over-vega was minus 0.997 before the episode below and minus 0.9997 after. That is not two signals agreeing. It is one deterministic function printed twice.
Positioning therefore has to come from a quantity that records what the market did. Open interest is that quantity. It is not a function of . It is a count of contracts standing. It changes only when somebody trades.
Splitting Exposure Into Revaluation, Trading and Membership
The fix is to stop averaging the Greek and start measuring exposure, then split the change in that exposure into a part that is drift and a part that is trading. Both fall out of one product rule.
Define the exposure of a cohort in Greek as the open-interest-weighted, signed sum over its member strikes,
where is the open interest at strike and is a sign we return to below. Take the change between two ten-minute snapshots. For a strike present in both, expand the difference of the product,
with and . Sum over the cohort and the change in exposure splits into three named channels,
Read the channels. The market channel holds open interest fixed and lets the Greek move. It is the book being revalued because spot and vol changed, with no trade behind it. The repositioning channel holds the Greek fixed at its current value and lets open interest move. It is the exposure added or removed by actual trading on strikes that stayed in the cohort. The membership channel, , collects strikes that entered or left the cohort between the two bars, the calendar effect of options ageing across a boundary. The three sum exactly to the change in exposure, so nothing is double-counted and nothing is thrown away.
That decomposition is the whole idea. Every Greek panel that came before it was reporting the sum. The sum is dominated by the first term.
Weighting by Position, Not by Liquidity
Two weighting choices separate this measure from an averaged panel and both matter.
A liquidity-weighted panel weights each option by a quote-quality score. That is the right weight for a different question, how much to trust a given quote. It is the wrong weight for positioning, because a deep, liquid at-the-money option and a thin wing option can carry very different amounts of open interest and it is the standing size that a position is made of.
The obvious way to test that is to ask whether the open-interest-weighted exposure level carries anything beyond the mechanical drivers. Regress it on , , and their squares and cross term, then read the . We ran it with a kill condition attached. It is worth reporting what happened, because it did not go our way.
On a single at-the-money cohort the level looked promising, keeping about a third of its variance independent of the drivers. Across all 28 cohorts it fell apart. Gross open-interest weighting turned out to be exactly as mechanical as the liquidity-weighted average, 0.885 against 0.883. Everything that looked like signal was entering through the call-minus-put imbalance and that imbalance is mostly a description of which moneyness bucket you selected. Below-spot cohorts are nearly pure puts, one of them printing an imbalance of on all 502 bars with zero variance. Above-spot cohorts are nearly pure calls. Across cohorts, the apparent signal correlated with how much room the ratio had to move at . We were measuring the metric's own freedom, not the market.
So the exposure level is not a positioning measure and we are not going to claim it is. What matters is that the level was never the thing we set out to build. The next section is.
The prerequisite is that open interest moves intraday and it does. Across the cohort the fraction of ten-minute bars on which a strike's open interest changed ran at 0.051, more than seven times the 0.0069 you would see if open interest were a once-a-day snapshot. The repositioning channel is not forced to be a daily object. It has genuine ten-minute dynamics to measure.
The sign is the last choice. It comes in two conventions.
| • | Net. Calls count plus one and puts minus one, the textbook call-minus-put convention. It assumes long calls and short puts and takes no view on who is on which side. |
| • | Dealer. Each strike is signed from live Deribit taker flow, so the sign reflects the market-maker side actually observed rather than an assumption and it falls back to the net convention where flow is thin. On a reconciliation test the dealer-signed gamma matched the independent GEX pipeline to correlation one, which is the check that the sign is not inventing structure. |
The Repositioning Channel and Its Colour
Pull the repositioning term out on its own and it is the measure we wanted from the start,
The sum runs only over continuing strikes, those in the cohort at both bars, so membership never enters. Only the change in open interest counts, so revaluation never enters. What is left is trading, signed and open-interest-weighted. It is silent when nobody repositioned and that silence is a feature. A measure that is loudest when the market is quietest and drifting is measuring the drift.
The sign convention is the case function from above,
Repositioning is additive across time, so a ten-minute channel sums cleanly to any coarser bar. For an hourly display we sum the six ten-minute values, then map the result to colour against a fixed percentile scale so a busy hour reads bright and a normal one reads dark,
The scale is the 95th percentile of the absolute repositioning over a 30-day baseline, one yardstick for what a large move is in this Greek. A standard deviation would be the obvious alternative and it is the wrong one here, because a genuine flow series is zero most of the time and a standard deviation built on that distribution is not a meaningful unit. The 95th percentile of the magnitude survives it.
Colour it and the surface reads the way the eye expects. Blue where exposure was added, orange where it was removed, brightness scaled to the size of the trade against a normal month, dark where nothing happened.
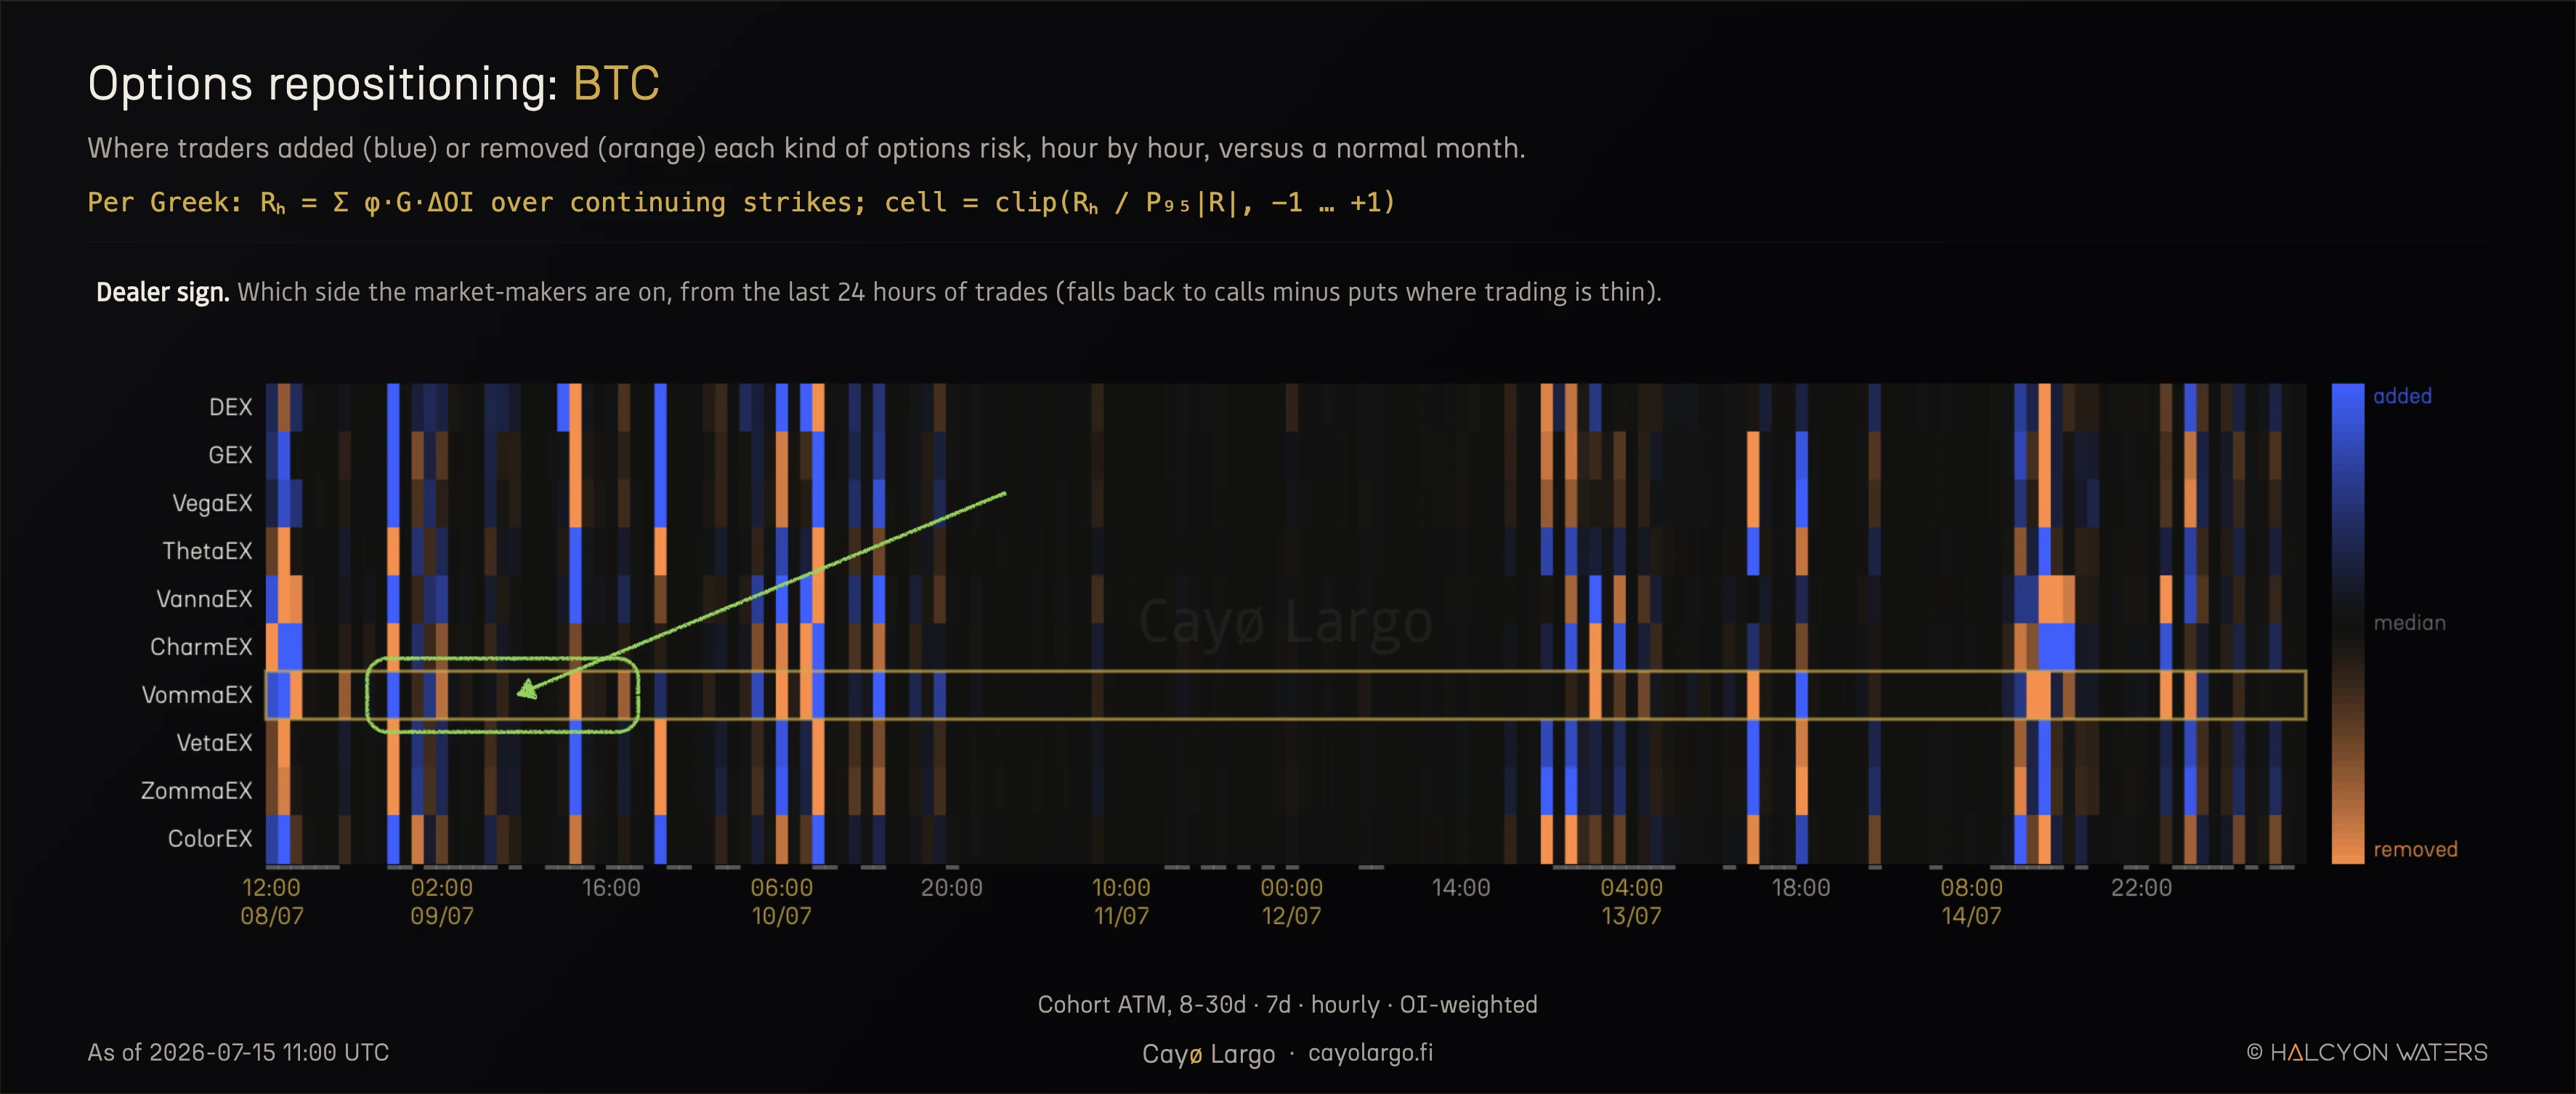
Figure 1: BTC options repositioning, week of 8 to 14 July. Ten OI-weighted exposures by hour, dealer sign, VommaEX row highlighted. Blue is exposure added, orange removed, brightness by the size of the move against a 30-day normal. Dark means nobody traded that risk in that hour. Hold the bright VommaEX columns against the flat stretch on the 9th, marked in green. The difference between a desk moving risk and a desk standing still is visible without a formula.
Eight Hours That Looked Like a Convexity Bet
A measure is worth what it is worth when it disagrees with the instrument you already trusted. On 09 July it did.
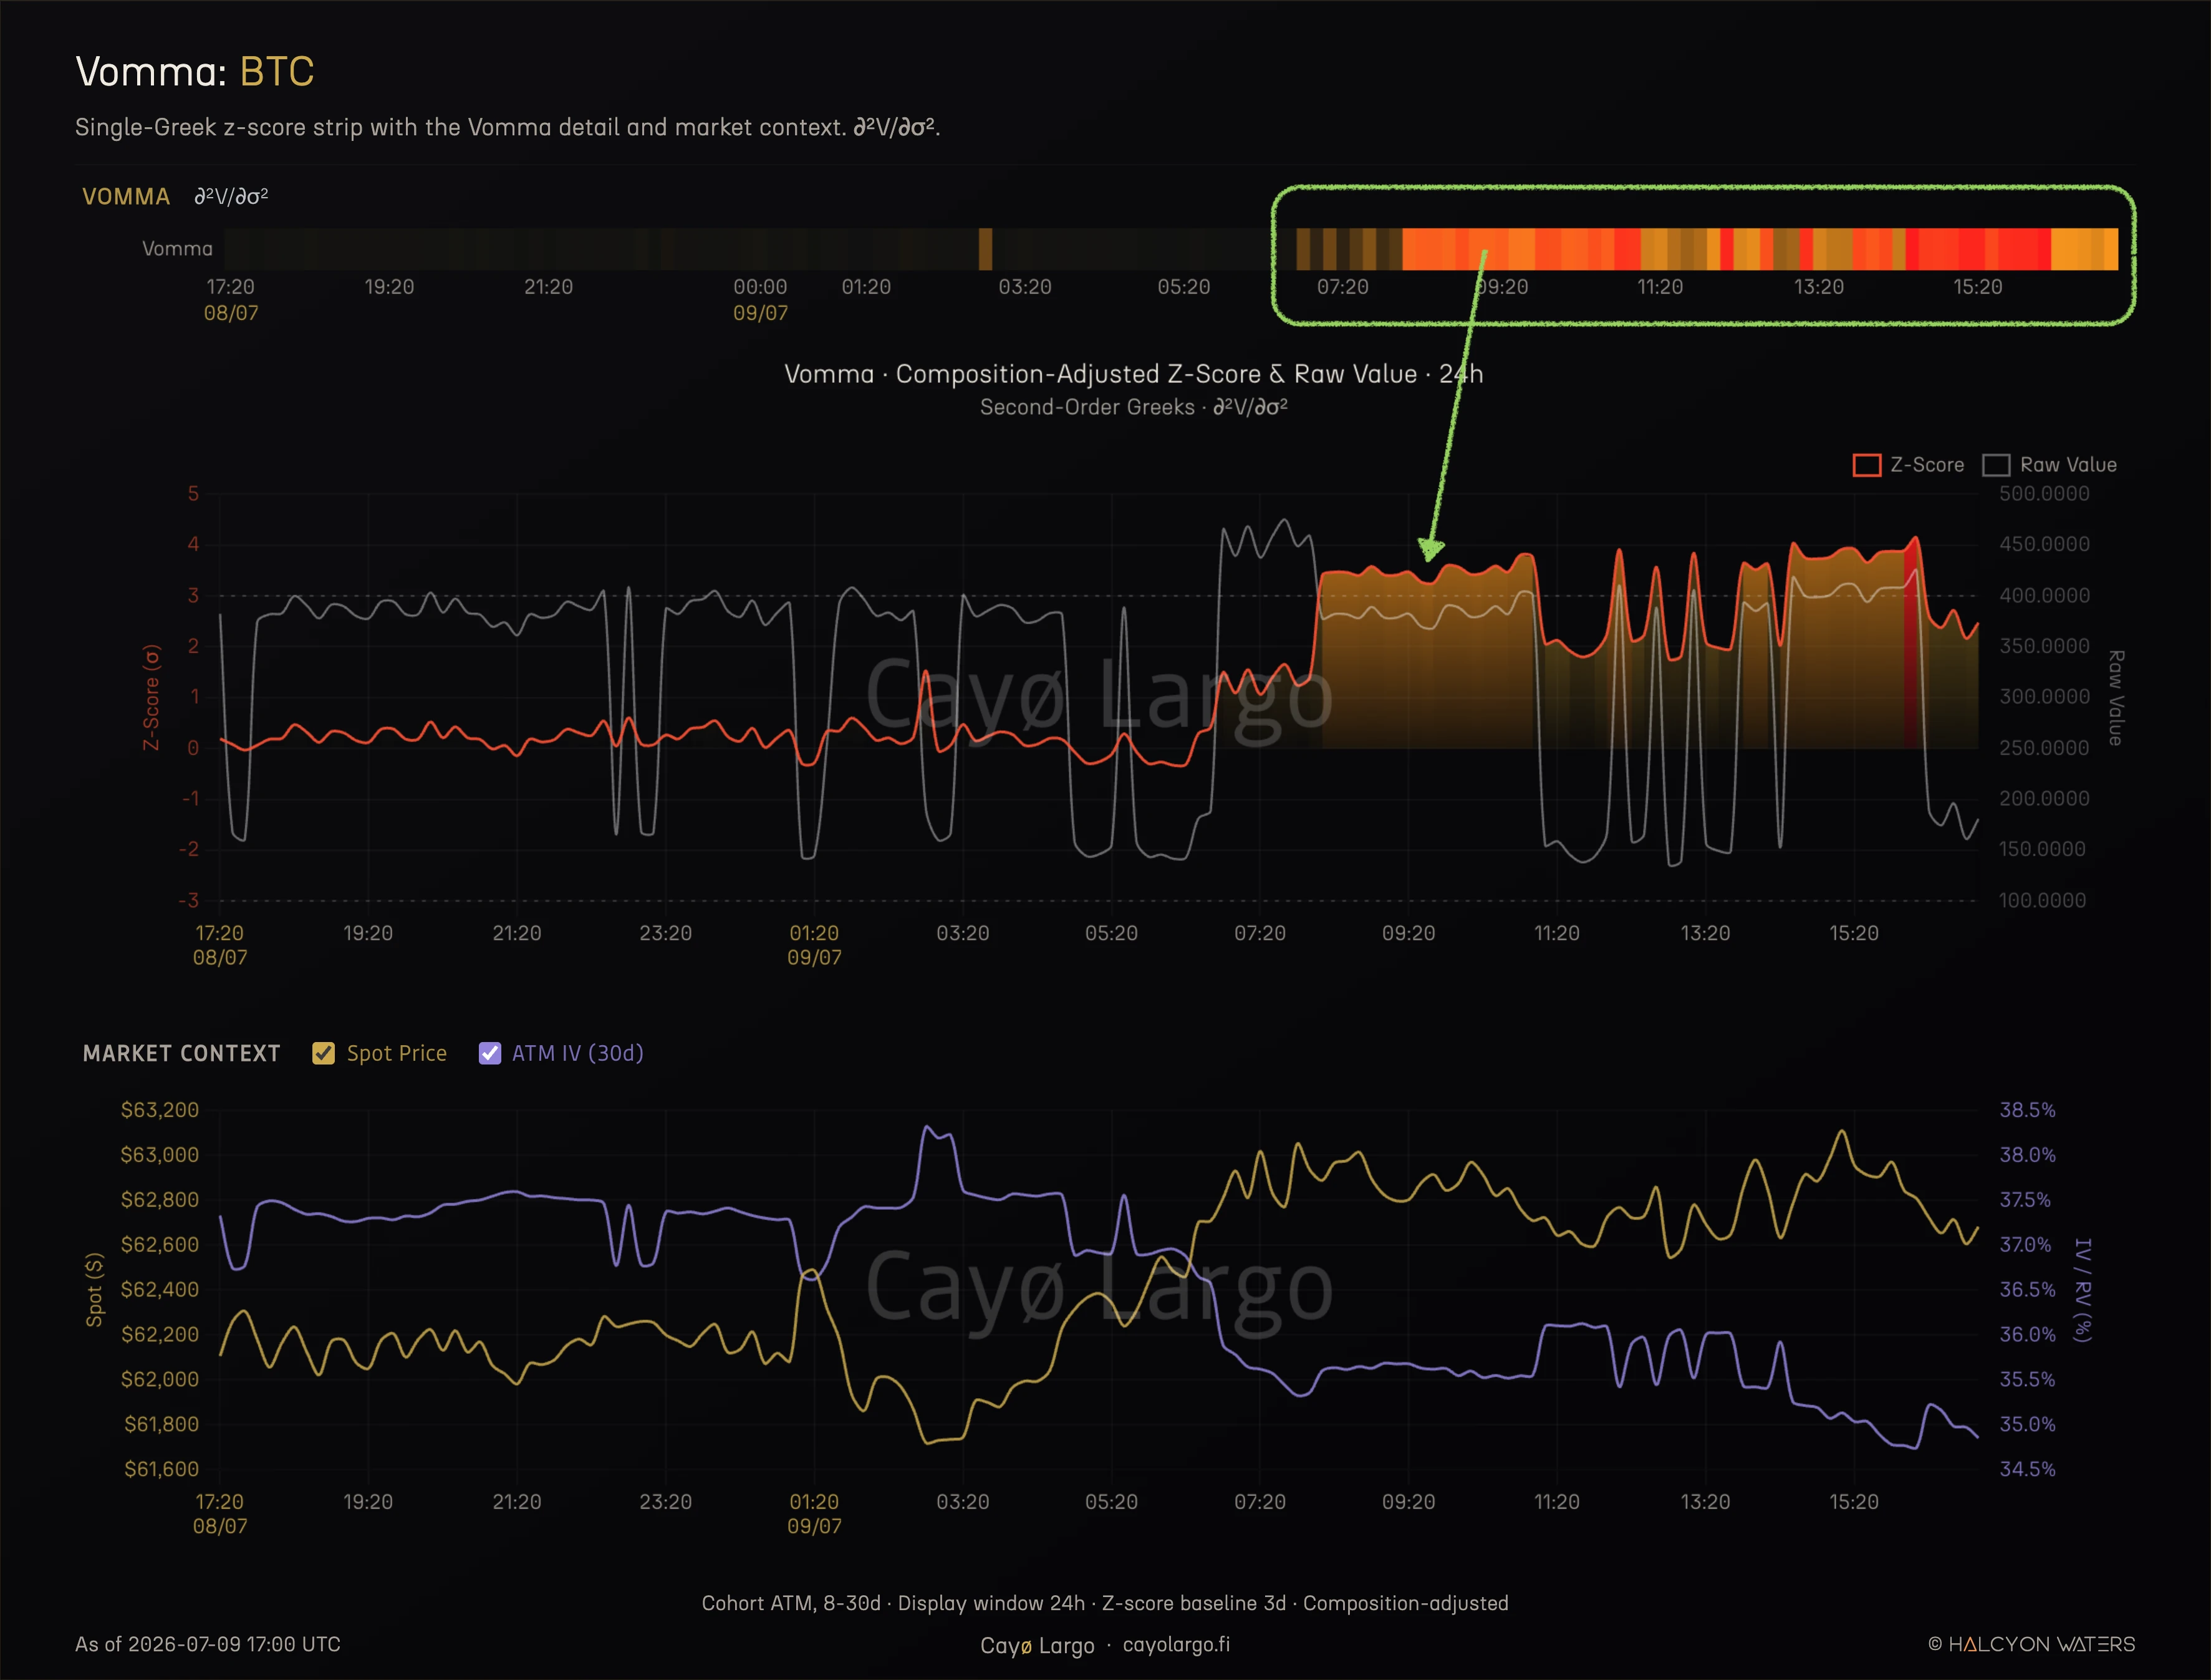
Figure 2: The Vomma drill-down for the same book. The z-score in red holds above three for eight hours and touches four. The raw value in grey whipsaws between 150 and 450. The market-context panel below shows spot walking up through the strike ladder while ATM implied vol drifts a couple of points lower. These are the hours the VommaEX row in Figure 1 sits dark.
BTC Vomma, composition-adjusted against a trailing three-day baseline, stepped from about zero to above three near 07:40 UTC and peaked close to +4.2, holding there for eight hours. On a second-order vol Greek that reads as a convexity regime change, someone loading up on exposure to large moves in volatility.
The repositioning channel disagreed. Across the same eight hours VommaEX was flat. No exposure added, none removed.
One of the two had to be wrong, so we fixed the instrument set and decomposed the move directly. Of the change, 97.8 percent came from spot walking away from the strike ladder and 0.1 percent from the 2.6 vol-point change in implied vol. There was no Vomma trade. The market-context panel had been saying so all along: across the window spot was climbing while implied vol fell. A genuine bid for vol-of-vol does not show up as vol drifting the other way.
The repositioning channel was right and it was right for the reason it was built. It stayed silent because silence was the correct answer and no amount of colour on a deterministic quantity could have produced that answer.
Does the Decomposition Hold
A measure that fails its own tests is worth less than no measure, so here are the tests, run on 14 days of consecutive ten-minute BTC snapshots across three cohorts, 5,971 bars in total.
The identity reconciles exactly. The three channels must sum to the change in exposure, because the split is algebra rather than a model. Computed independently on every bar, the residual is zero to floating point, on all 5,971. That is the check that the cohort membership logic and the snapshot join are right. Nothing else in this note would be worth reading without it.
The channel is not contaminated by market state. Regress the repositioning channel on changes in spot, vol and time, the same shape of test that killed the exposure level. It returns at the money, below it and above. Essentially nothing about this series is recoverable from the market. That is what a flow should look like and it is the strongest single result we have on it. Its lag-one autocorrelation is , memoryless and spiky, which is the profile of trade arrival rather than of a drifting level.
It is silent most of the time. On about 60 percent of ten-minute bars no continuing strike changed its open interest, so the channel is exactly zero. Aggregated to the hour the panel renders, roughly one hour in five carries enough to light a cell.
And revaluation dominates. This is the number that quantifies the whole argument. On a median active bar in the at-the-money cohort, trading accounts for 0.3 percent of the change in Vomma exposure. Revaluation accounts for essentially all of the rest. A panel that shows you the sum is showing you the market channel with a rounding error attached.
The tail is where the channel earns its place and the tail is not the same everywhere. The at-the-money curve sits lowest at every percentile we measured. Both wings run above it and below spot runs highest of all. Measured against revaluation on a median active bar, trading is about five times more material above the money than at it and about twelve times more below.
That ordering is worth stating as a finding rather than a footnote and it is not the finding we expected. Our first read on two cohorts looked like a below-spot effect. Adding the third makes the shape clearer: the at-the-money band is the trough, not one end of a slope. Trading is a small part of what moves at-the-money exposure and a much larger part of what moves exposure in either wing.
It also lines up with a result from a different test. The stability screen scores Vomma at 5.23 below the money against 1.25 at it, so the at-the-money band is both where the Greek is least well behaved and where trading explains least of the move. Two independent measurements point at the same place. The band traders watch most closely is the one that most needs a second instrument, which is the argument this whole note has been making, arrived at from the other direction.
Every number in this section comes from the same three runs, so here they are in one place rather than scattered through the prose.
| Measure | Below spot | At the money | Above spot |
|---|---|---|---|
| Does the decomposition hold | |||
| Bars tested | 1,990 | 1,991 | 1,990 |
| Max identity residual | 0.0000 | 0.0000 | 0.0000 |
| Contamination R² against state changes | 0.0030 | 0.0007 | 0.0050 |
| Autocorrelation, lag one | +0.037 | +0.050 | +0.019 |
| How often it has anything to say | |||
| Active bars, some strike changed OI | 39.9% | 41.2% | 37.9% |
| Hours lit on the rendered panel | 17.9% | 21.1% | 17.3% |
| Share of the move that is trading, active bars | |||
| Median | 2.6% | 0.2% | 1.2% |
| 90th percentile | 58.6% | 11.0% | 35.8% |
| 95th percentile | 77.8% | 26.6% | 56.5% |
| Trading over revaluation, median active bar | 0.032 | 0.003 | 0.015 |
| Bars where trading exceeds revaluation | 4.9% | 0.9% | 2.8% |
BTC, 8-30 day cohorts, 14 days of consecutive ten-minute snapshots to 19 July 2026, 5,971 bars. Identity residual is the reconciliation check on the three-channel split. Contamination is the repositioning channel regressed on changes in spot, implied vol and time. Percentile rows are computed over active bars only, so the median is the median busy bar rather than the median bar.
One limit, stated plainly. This covers three of 28 cohorts, one coin, one Greek, 14 days and the call-minus-put sign convention rather than the taker-flow dealer sign. It says nothing yet about the other 36 Greeks.
Two Traps the Channel Sidesteps
The Vomma case is not an isolated quirk. Two structural effects make averaged Greek panels hardest to read exactly where traders look most and the repositioning channel is immune to both by construction.
The vertex. Vomma carries a clean identity against vega,
which returned 1.000000 on every row of live data, calls and puts alike, as put-call parity requires. Writing the moneyness terms with and multiplying out gives
a parabola in . At the money, where , it sits near the bottom of that parabola. So an at-the-money cohort has a baseline pinned near a minimum and any normalized measure built on it will fly the moment moves off zero, because the term grows quadratically while the baseline had almost no location to begin with.
This is not special to Vomma. We ran the whole Greek set through a stability screen and 11 of the 19 Greeks predicted to be degenerate in the at-the-money cohort came back with no location at all, with a clean empty gap between them and the genuinely valid ones. The decisive check was the wings. Move the same Greeks into the below-spot cohort, away from the vertex. They recover a location almost across the board. Vanna, charm, surface charm and Vomma all find a footing off the money. A Greek can be degenerate at the money and perfectly readable in the wings, which is why any honest gate on that surface has to be computed per Greek and per cohort rather than once for the whole grid.
Composition. An averaged panel plots a weighted average over a cohort whose membership is not fixed. Options age in and out of the 8-30 day band, strikes drift across the moneyness boundary and the option count jumps between discrete regimes. In the at-the-money BTC cohort it was bimodal, sitting at 8 members on some bars and 12 on others, with an 18-member regime earlier in the window. When membership flips the average reshuffles even if not a single option repriced, because the off-money members that carry most of the Vomma enter or leave the basket.
The damage is quantitative. Over 714 hourly bars, regressing the liquidity-weighted average Vomma on spot, time and vol gave an of 0.50, when the deterministic argument says a fixed-composition aggregate should be near one. The missing variance was not positioning. It was composition and the average correlated with the raw option count at 0.46. Condition on fixed membership, the 8-member bars alone or the 12-member bars alone. climbs to 0.88. Most of the gap closes, which is the composition effect made visible. The part that does not close is worth naming rather than hiding: at 0.88 the average is still not the near-deterministic object the theory describes, so something beyond spot, vol, time and cohort size is moving it. The three-channel split exists to say what.
The repositioning channel never meets either trap. It sums over continuing strikes only, so membership cannot enter and it multiplies by the change in open interest, so a degenerate baseline has nothing to inflate.
What Each View Sees and What It Misses
Three questions, three instruments and the honest move is to keep all three and read each for what it does well.
| • | Repositioning is strong at isolating trading. It measures the open-interest change on continuing strikes, so revaluation and calendar rolls are removed by construction. It is silent when nothing traded, it survives the vertex and the composition trap and it carries a dealer sign checked against an independent pipeline. |
| • | Repositioning has its own limits. It needs open interest at a real intraday cadence, it reports the change and not the standing level, an hourly display averages over sub-hour detail and the dealer sign is an estimate from taker flow rather than a settled fact. It tells you where the desk moved, not where the desk sits. |
| • | The z-score heatmap is strong at anomaly detection. It scans all 37 Greeks at once and flags the moment any one of them leaves its recent history. When you want to know that the surface has entered an unusual state and which order of Greek feels it first, it is the right instrument and it needs no open-interest data to work. |
| • | The z-score heatmap is weak as a positioning read. Its quantity is deterministic in spot, time and vol, so it responds to market drift rather than trading. A bright cell is a true statement about market state and a poor proxy for what anyone did. |
The Vomma row that would not cool down was not a mistake in the data or the maths. It was a correct answer to the question a z-score asks, read as an answer to a question it cannot ask. Once you write the change in exposure as revaluation plus repositioning plus membership, the confusion resolves into arithmetic. The part that lit the heatmap sits in the market channel. The part a trader wants sits in the repositioning channel and on 09 July that channel said nothing happened, which is what had happened.
The repositioning view runs live across coins and cohorts. For the standing level of exposure by strike and how it decays into expiry, the surface view is the companion piece. For the price levels where dealer hedging flips, the Greek exposure projection is the third lens. Level, flow and hedge response, three readings of the same book, each honest about what it measures. The wider point, that knowing your Greeks is not the same as knowing the positioning behind them, we take up separately.
Frequently Asked Questions
What is options repositioning and how is it computed?
Repositioning is the part of the change in a cohort's Greek exposure that comes from open-interest changes on strikes present in both snapshots, weighted by open interest. It is the sum over continuing strikes of the sign times the current Greek times the change in open interest. It excludes revaluation, the exposure moving because spot and vol moved with no trade. It excludes membership, options ageing into or out of the cohort.
Why can a Greek panel not show positioning on its own?
A Black-Scholes Greek is a deterministic function of spot, strike, time to expiry and implied vol. Aggregate it over a fixed set of options and the aggregate is still deterministic in those inputs. Trading is not one of the inputs, so no transformation of the Greek alone, including a z-score, has a channel through which a trade can enter. To read positioning you have to bring in open interest, which is a record of what the market did rather than a function of market state.
Why weight by open interest instead of by liquidity?
Liquidity weighting answers a data-quality question, how much to trust each quote. Open-interest weighting answers a positioning question, how much size sits behind each strike. One caveat from our own testing: the open-interest-weighted exposure level is not itself a positioning measure. Tested across 28 cohorts it proved as mechanical as the liquidity-weighted average. What carries positioning is the change in open interest on continuing strikes, the repositioning channel, not the level.
What is the difference between the net and dealer sign?
Net counts calls as plus one and puts as minus one, the textbook call-minus-put convention. Dealer signs each strike from live Deribit taker flow, so it reflects the market-maker side actually observed rather than an assumption and falls back to the net convention where flow is thin. On the reconciliation test the dealer-signed gamma matched the GEX pipeline to correlation one.
Is the z-score Greek heatmap useless then?
No. Z-score normalization across the Greek set is a sound way to flag temporal anomalies, moments when a Greek's value is far from its own recent history. That is a legitimate and useful question. The point is narrower. The answer to that question is dominated by market state, not by trading, so the heatmap is a market-state anomaly detector rather than a positioning tool. The two answer different questions and are best read side by side.
Why did BTC Vomma read +4 sigma without a Vomma trade behind it?
At the money, Vomma sits near the vertex of its own parabola in moneyness, so its baseline mean is small and its z-score denominator is small. When spot walks away from the strike ladder the moneyness term grows fast and the ratio jumps. In the case we decompose, 97.8 percent of the move came from spot leaving the strikes and 0.1 percent from a 2.6 vol-point IV change. The repositioning channel stayed flat across the same hours, which is the reading that matched the tape.
How do you know the three-channel split is correct?
The split is algebra, not a model, so the three channels must sum exactly to the change in exposure. We compute each independently and check the residual on every bar. Across 5,971 consecutive ten-minute BTC snapshots in three cohorts the residual is zero to floating point. Separately, the repositioning channel regressed on changes in spot, vol and time returns an R-squared of 0.0007 at the money, 0.0030 below it and 0.0050 above, so almost nothing in it is recoverable from market state. Its lag-one autocorrelation is 0.05, which is the profile of trade arrival rather than of a drifting level.
How much of a Greek exposure move is actually trading?
Less than most people expect. On a median active bar in the BTC at-the-money 8-30 day cohort, trading accounts for about 0.3 percent of the change in Vomma exposure and revaluation accounts for the rest. It is heavily tailed, reaching 26.6 percent at the 95th percentile of active bars. Both wings run higher, about five times more material above the money and twelve times below, with the below-spot cohort carrying 77.8 percent of the move at the 95th percentile.
Can you use one Greek to confirm another?
No. Second and higher Greeks share the same d1 and d2 building blocks, so ratios between them are algebraic identities. In our data the correlation between Vomma-over-vega and ultima-over-vega was minus 0.997, which is not evidence of anything. It is the same deterministic function seen twice. Confirmation has to come from open interest and trades, not from a second deterministic Greek.
Related Articles
4 Traps Between a Crypto-Options Backtest and a Profit
Four crypto-options signals that shine in backtest and die at real fills. What the spread, the wrong vehicle, overlapping windows and a trending coin cost you.
Dealer Greek Exposure: GEX, Charm and Vanna, With the Maths
How dealer gamma exposure (GEX), charm and vanna are actually built, formula by formula and how the order-flow sign is set. Computed on live Deribit options data.
Why Knowing Your Greeks Won't Save You on Deribit
You learned Delta, Gamma, Theta. You can explain Black-Scholes over coffee. Then you open Deribit's options page and none of it helps. Here's why options theory breaks down on a live screen.
Why Deep-OTM IV Momentum Is Noise, Not Signal
A stable IV smile but wild IV momentum at deep-OTM strikes. Why thin-strike microstructure is noise, not repricing, shown live on Deribit multi-coin data.