Why Deep-OTM IV Momentum Is Noise, Not Signal
A stable IV smile but wild IV momentum at deep-OTM strikes. Why thin-strike microstructure is noise, not repricing, shown live on Deribit multi-coin data.
A reading guide from Cayø Research. A thin strike far from spot can hold its vol still while the momentum panel screams and the scream is mostly noise. Every desk knows it, few dashboards admit it. Here is how to see it yourself, using Cayø Largo's Volatility Explorer and why the simple explanation is the right one.
Two Panels, One Strike, Opposite Stories
Open the ETH vol surface explorer and the first thing that moves is the IV momentum map. The whole strike ladder flickers, red where vol is falling and blue where it is rising and the 3000 row an hour above spot keeps lighting up in both, hour after hour. It reads like a strike being repriced hard.
Flip the same surface to its liquidity-weighted IV smile and the 3000 row goes quiet. A calm, near-uniform band that barely changes shade across three days. Same strike, same window, same underlying data, opposite character:
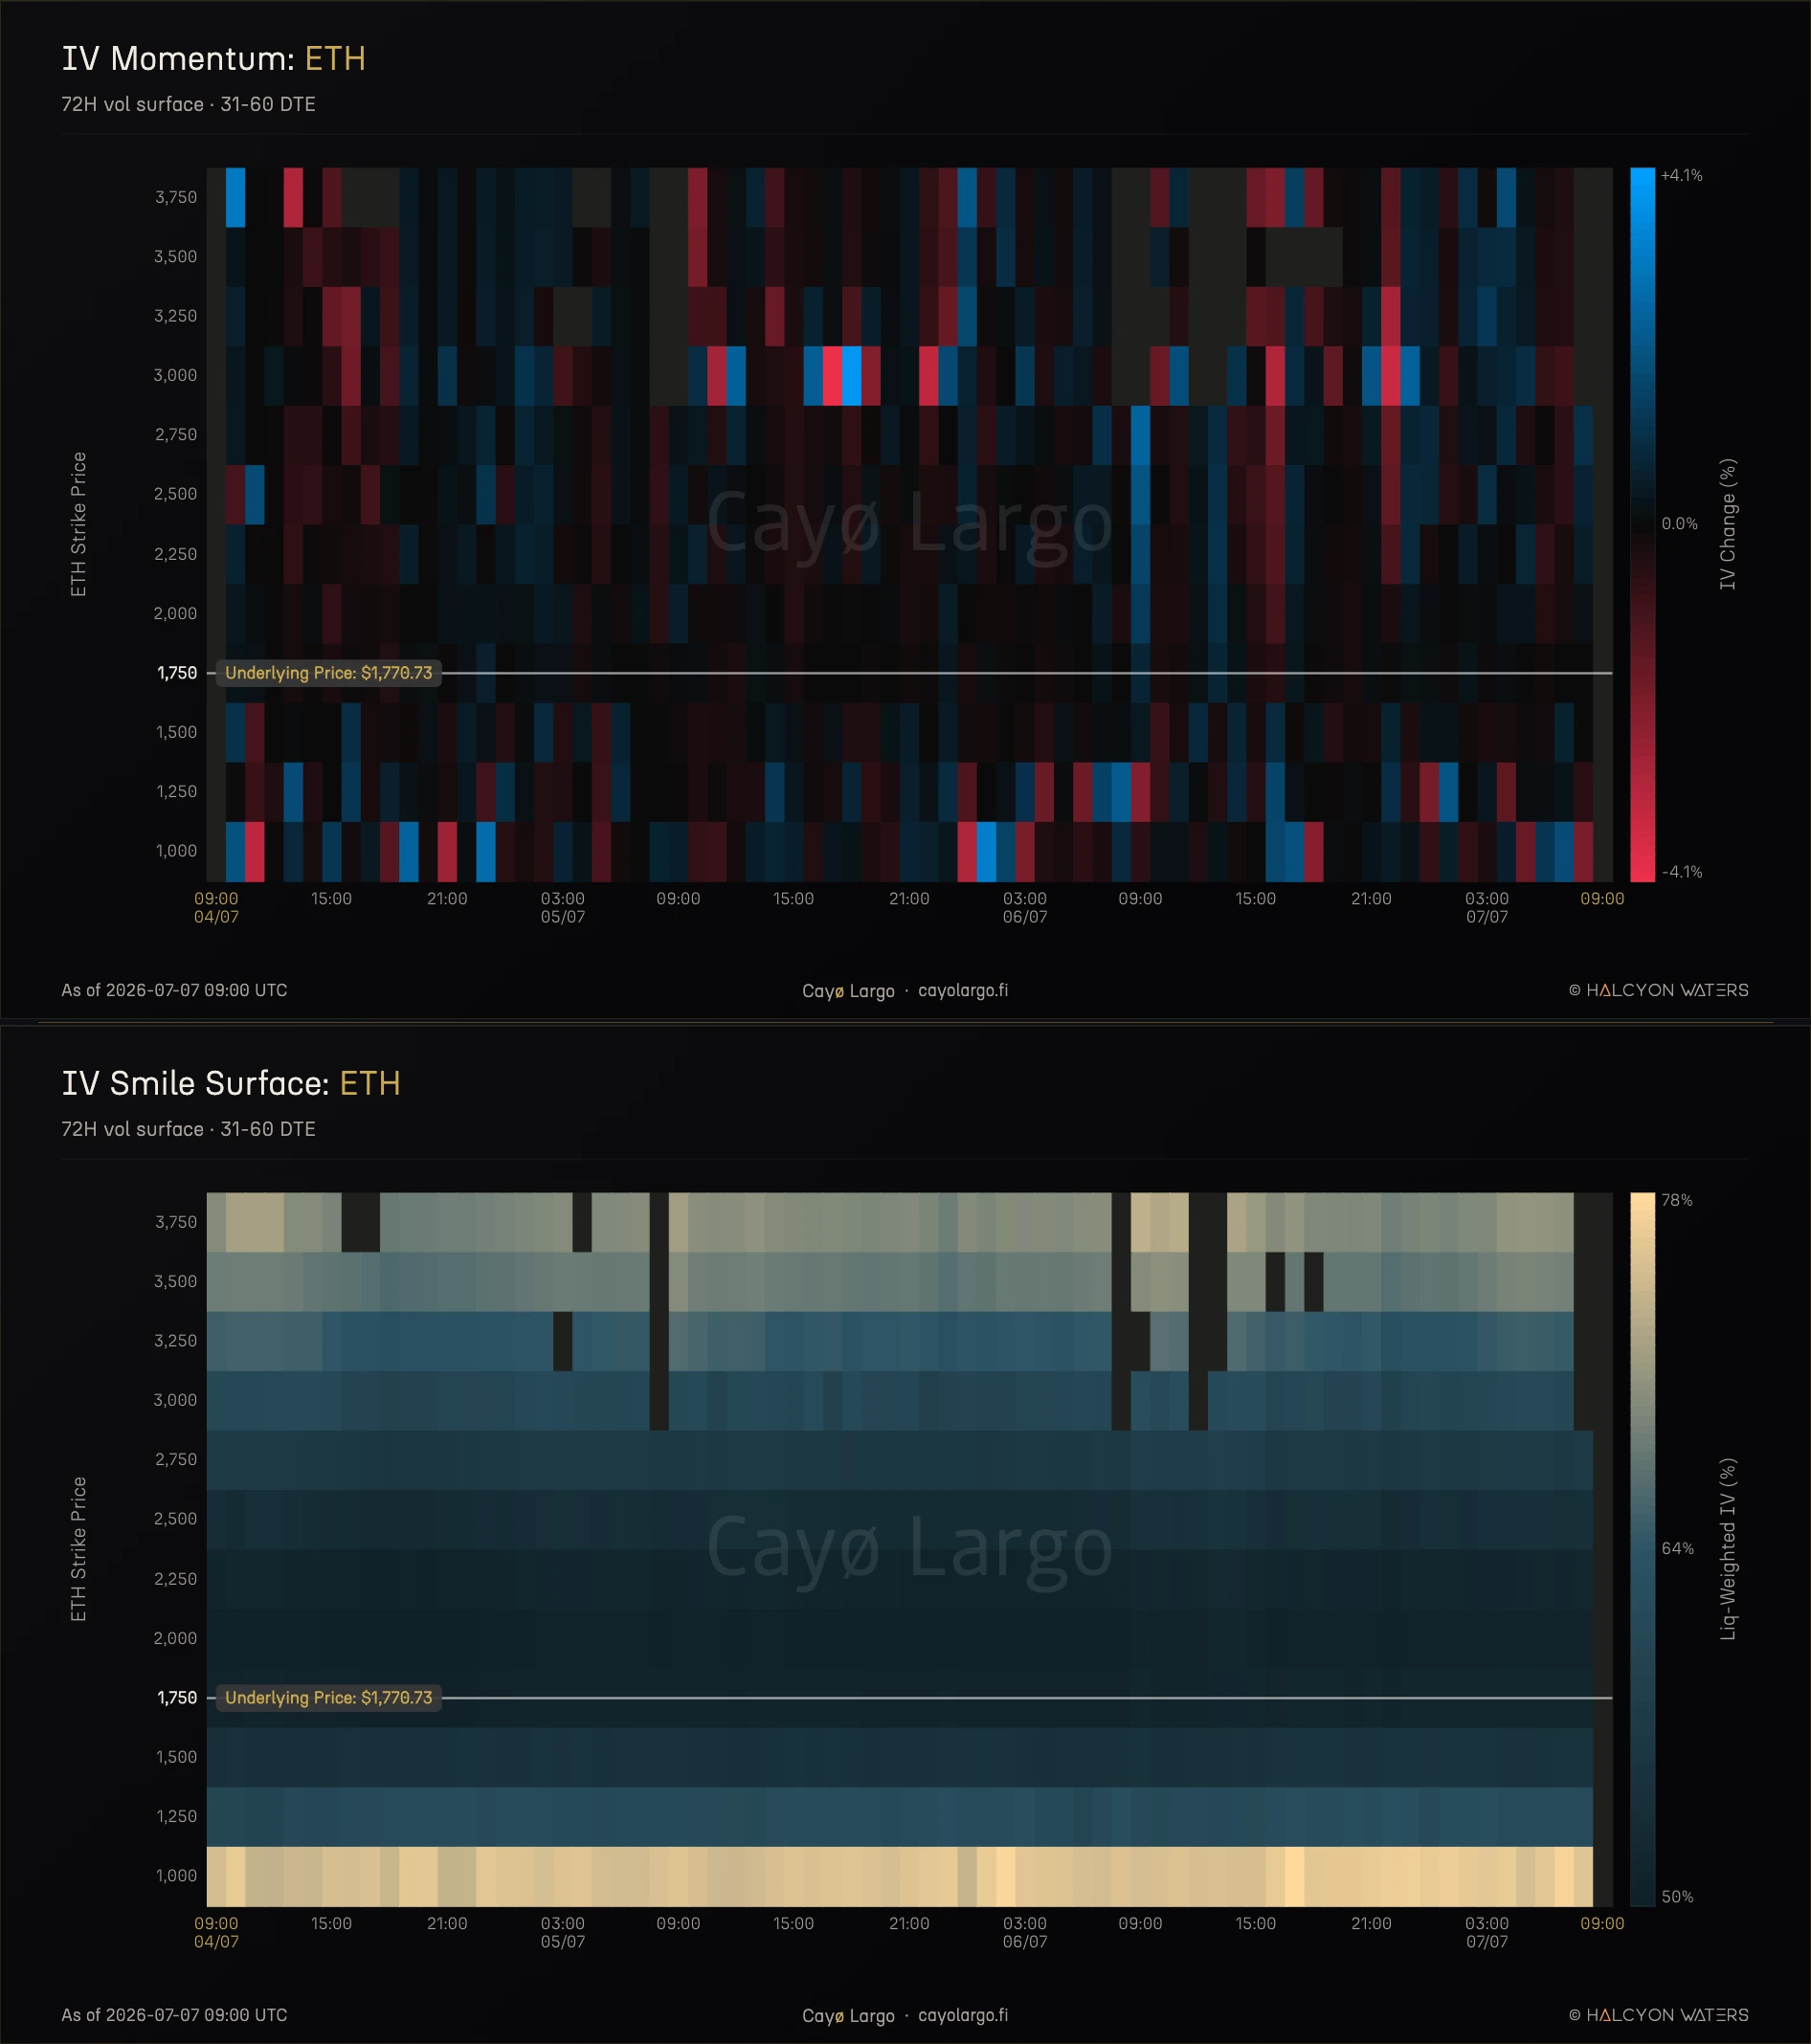
Figure 1: ETH, 31 to 60 DTE, 72 hours to 07 Jul 2026. Top, the IV momentum surface, one-hour IV change at every strike. The 3000 row flickers red and blue all week. Bottom, the liquidity-weighted IV smile over the identical window. The 3000 row is a calm, even band. The loud panel and the quiet panel are the same strike.
The natural move is to trust the loud panel and we made it ourselves the first time. Surely something is stirring under that calm smile. Nothing is. The reason is the whole point of this piece. In what follows we take the two panels apart with two diagnostics, test them against the one honest alternative and finish on the traded surface, where the storm has to show up or admit it was never there. The two panels do not actually contradict each other. One draws the level of implied vol, the other draws how much that level moved in the last hour and on a strike this thin the hourly move is almost pure noise.
A Strike 70 Percent Above Spot
It helps to fix where 3000 actually sits. Over these three days ETH traded between 1756 and 1813 and was near 1770 when we pulled the data, so a 3000 strike is about 70% above spot. In volatility terms that is a long way out. At 60% annualized vol over 45 days a one-sigma move in log price is roughly and the log distance to 3000 is , which puts the strike about 2.5 sigma away. Far out, though not absurd. The market keeps a quote on it without ever really trading it.
That distance is exactly why the level holds still. A 2.5-sigma call lives on the wing of the smile and the wing is held in place by no-arbitrage against the strikes on either side and by the slow drift of the surface as a whole. Nothing forces it to jump, because almost no fresh order flow arrives at 3000 to push it. Across the full 72 hours its mean implied vol was 60.1%, with a standard deviation of just 0.78 points. That steadiness is the real signal and the smile panel reports it faithfully.
The trouble only begins when you stop watching the level and start watching its change.
Momentum Is the Derivative of a Pinned Level
The momentum panel does not show implied vol at all. It shows how much the IV changed from one hour to the next, as a percent move. That sounds harmless and it is anything but. Taking the hourly change of a calm line does something violent to it. It keeps the jitter and throws the calm away.
Picture a nearly flat line at 60% with a small random wobble riding on top. The line itself barely moves, so the level looks stable. The hour-to-hour change, though, is nothing but that wobble, magnified to fill the whole chart. Engineers have a name for this, a high-pass filter. It flattens the slow, steady part and amplifies the fast, random part. The calm 60% the smile panel shows you is the very thing the momentum panel throws out.
There is a simple way to measure how bad it gets. Put the size of the hourly swings over the size of the level's own moves.
where is the bucket's implied volatility at hour , its change from the hour before and the standard deviation of each series across the window.
When the level trends smoothly, this ratio sits well below one and the momentum is real. When the level is just noise around a fixed mean, the ratio climbs toward one and past it and the momentum is that noise magnified.
At 3000 the ratio came out at 1.15. The hourly change swings wider than the level it is built from. The strike is a steady average with random noise sitting on top and the momentum panel is turning that noise up to full volume.
Open the drill-down for the 3000 bucket and the four little panels all tell the same story:
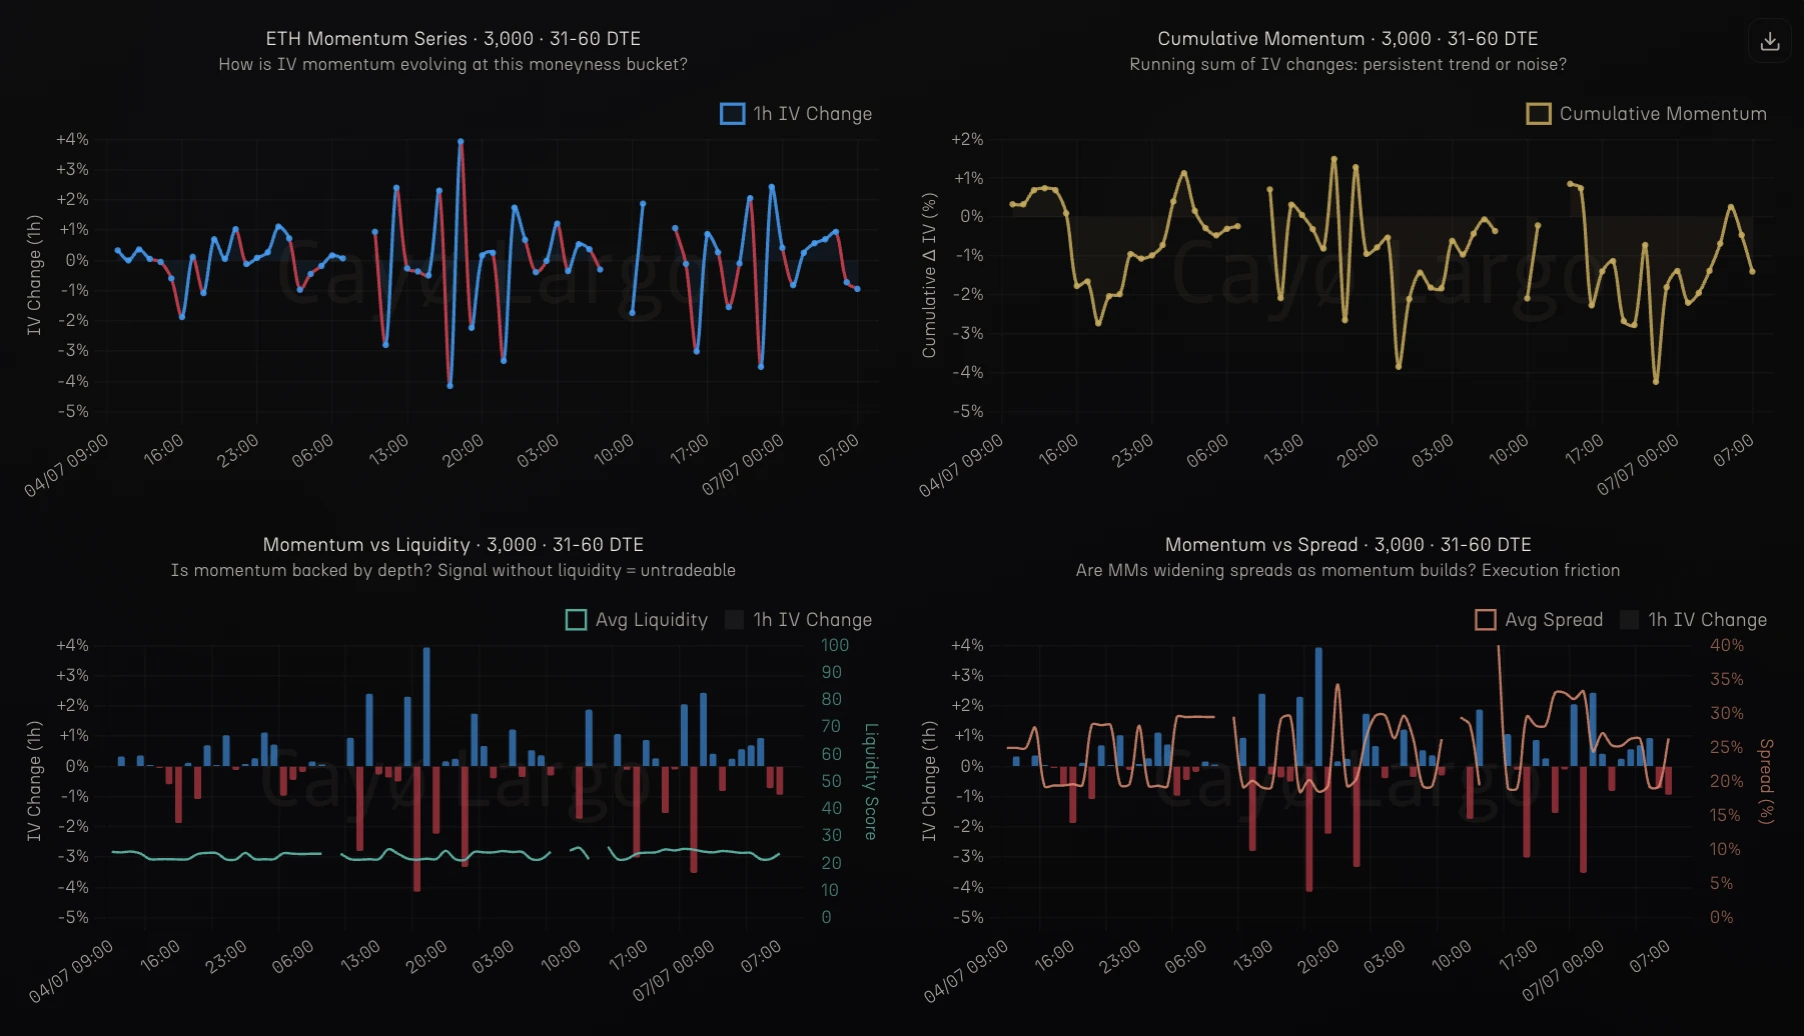
Figure 2: The 3000 momentum drill-down. The one-hour change is all reversals. Cumulative momentum, the running sum of those changes, wanders a few points and keeps returning toward zero, which is what a sum of mean-reverting noise does rather than a trend. The liquidity and spread overlays show the loudest changes land where depth is thinnest and spreads widest.
The Whipsaw Fingerprint
There is one clean way to tell noise apart from a genuine position being built. When someone builds a position, the moves trend, each hour nudging vol the same way. Noise does the opposite. A random jump up is just as likely to be followed by a jump down. So the useful question for any momentum series is whether its consecutive changes reinforce one another or cancel out and the lag-one autocorrelation answers it in a single number, positive for a trend and sharply negative for a whipsaw.
where is the correlation between each hourly change and the one before it. A trend gives and a whipsaw gives . Differencing a purely random level pins it near whatever the market is doing, which is the floor this next number has to be read against.
At 3000 that number was about minus 0.58, which sits right up against that floor. Difference a purely random series and its autocorrelation lands near minus one half by construction, because every blip shows up in two neighbouring changes with opposite signs. Landing just past minus one half says the level is not only memoryless but actively tugged back toward its anchor. Either way the conclusion is the same. Almost every move at 3000 was reversed within the hour. Nobody was building a position. The number was simply falling back to where it had started.
A single three-hour window on 05 July makes this concrete and it also kills the one alternative that would have been reasonable. Implied vol on a fixed out-of-the-money strike can genuinely move when spot moves, since a shift in spot slides the strike to a new point on the smile. Traders call this the sticky-strike rule, one of the regimes Emanuel Derman set out for how a skew travels with the market. So the honest thing to do is watch spot while the vol whipsaws:
| 05 Jul 2026, UTC | IV level | 1h change | ETH spot | Options in bucket |
|---|---|---|---|---|
| 15:00 | 59.96% | –0.68% | 1,769.92 | 3 |
| 16:00 | 61.28% | +2.21% | 1,773.49 | 1 |
| 17:00 | 58.74% | –4.15% | 1,772.61 | 1 |
| 18:00 | 61.05% | +3.93% | 1,777.72 | 1 |
| 19:00 | 59.68% | –2.24% | 1,779.59 | 2 |
Table 1: The ETH 3000 bucket over five hours on 05 Jul. IV round-trips from 61.3 down to 58.7 and back to 61.1, a four-point swing each way, while spot barely moves from 1773 to 1778. Each of the loud hours holds a single option. Spot did not reprice the strike. The bucket reshuffled its one quote.
Spot moved a quarter of a percent across the whole round trip. The vol moved four points down, then four points back. Sticky-strike repricing needs spot to travel and here it barely did. What actually changed was the contents of the bucket, one option at 16:00, a different single option at 17:00, another at 18:00. The average simply followed whichever lone quote happened to qualify that hour. Nothing was being repriced. We were watching the average of a set that kept swapping out its only member.
Why the Basket Is Noisy
Three things conspire to turn the 3000 bucket into a noise machine and the drill-down shows all of them at once.
The first and biggest is that there is barely anything in the bucket to average. It holds about two options at a time, sometimes just one, against roughly ten at the money. Which options clear the liquidity filter changes from hour to hour, so the average lurches whenever the membership changes, even when not a single option has actually repriced. That churn is the main culprit and it explains why the whipsaw peaks right here rather than further out. Push deeper into the wing and the bucket freezes onto one fixed quote, with nothing left to reshuffle.
The second is vega, which out here is roughly twelve times smaller than at the money. Vega is just how much an option's price moves for each point of implied vol, so when it is tiny the arithmetic runs the wrong way. A one-tick nudge in a cheap wing option, the sort of nudge that means nothing at the money, comes out as a large jump in implied vol. Small prices, coarse ticks, jumpy vol.
The third is the spread. Bid to ask at 3000 runs near 25% of the option's price, against 4 to 5% at the money. The mark can drift anywhere inside that wide band with no trade behind it at all and the vol computed from that mark drifts right along with it.
All three sit on one screen in the drill-down:
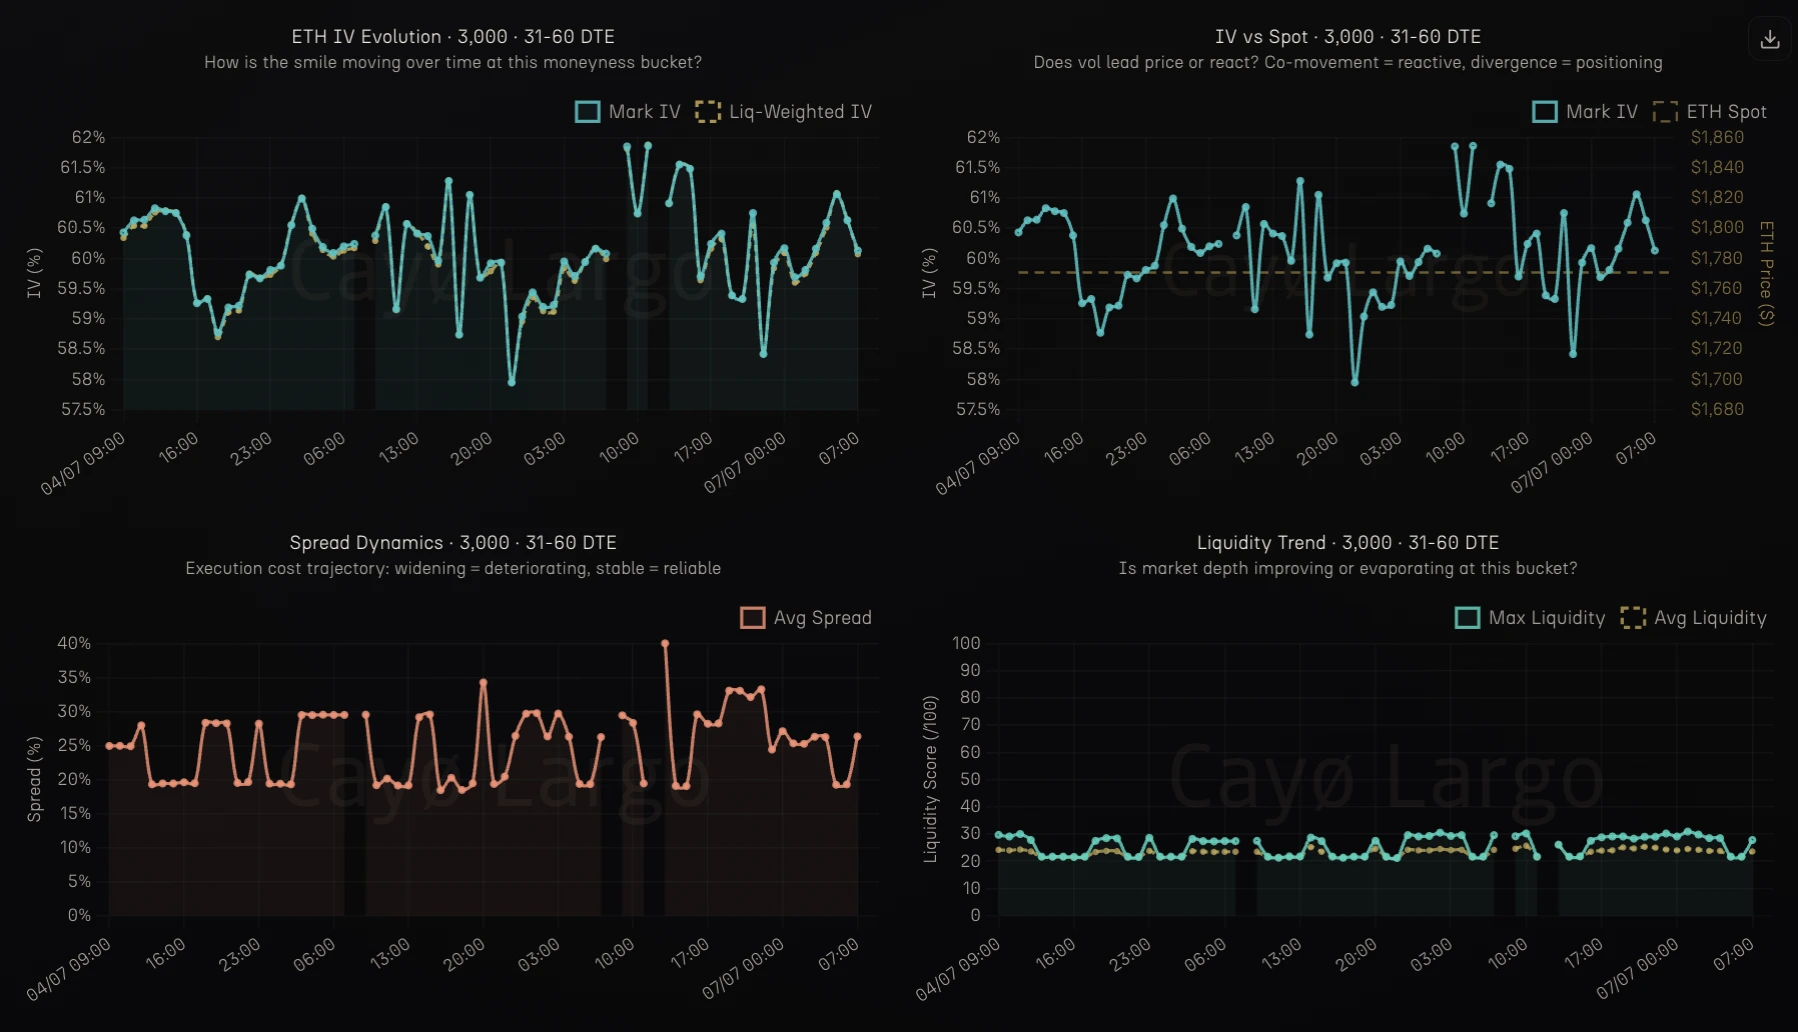
Figure 3: The 3000 smile drill-down. The level top left holds its band near 60%. Spread dynamics bottom left run a 20 to 40% execution cost the whole window. The liquidity trend bottom right stays pinned near 20 to 30 out of 100. A stable level sitting on a wide, shallow, barely-there market.
There is a fourth possible source, the sticky-strike effect from a moment ago and it is real enough in principle. Here it plays only a minor part. The loudest hours in Table 1 came while spot sat almost still, so spot cannot be the engine. When spot does move it adds a little to the noise but nowhere near enough to explain a panel that looks like a storm.
It Is the Thinness, Not the Market
If the turbulence at 3000 were a genuine, market-wide move in volatility, the busy at-the-money strikes would have to carry it too, in the same market and the same hours. They do not. Take 1750, which sat a tenth of a percent from spot through the very same 72 hours. Set it beside 3000:
| Metric, 31 to 60 DTE, 72h | 1750 (at the money) | 3000 (2.5 sigma out) |
|---|---|---|
| IV level, mean | 50.6% | 60.1% |
| Level std | 0.26 | 0.78 |
| 1h change std, points | 0.11 | 0.90 |
| Change std over level std | 0.42 | 1.15 |
| 1h change lag-1 autocorr | +0.01 | –0.58 |
| Mean spread | 4.5% | 25.0% |
| Mean vega | 2.64 | 0.21 |
| Options per snapshot | 9.6 | 2.4 |
Table 2: Same market, same window, two strikes. At the money the change disperses less than the level, ratio 0.42. Its autocorrelation is essentially zero, a level that trends and reprices smoothly. At 3000 the change disperses more than the level, ratio 1.15. Its autocorrelation is minus 0.58, a pinned mean with memoryless noise on top.
The at-the-money change was about eight times quieter in raw terms but the more telling thing is that the two diagnostics swap meaning between the strikes. At the money the level trends, so taking its change shrinks the spread of values, ratio 0.42 and an autocorrelation near zero. At 3000 the level is noise, so taking its change inflates it, ratio 1.15 and an autocorrelation of minus 0.58. No market event singled out the wing and spared the core. The wing was louder for one reason and one reason only. It is thin.
A single pair of strikes could still be a fluke, so it is worth running the same split of level against change across every ETH strike in the band. The pattern holds as a smooth gradient. The thinner the strike, the wilder its measured velocity and that wildness tracks the market's microstructure rather than any information. Across the twelve buckets the size of the hourly change correlated minus 0.72 with liquidity, plus 0.61 with the inverse of vega and a weaker plus 0.45 with the spread. Real volatility information would not fall into line with depth and vega so obediently. It falls into line because depth and vega are what create it.
The summary figures for each strike come straight off the live liquidity table, with no precompute and no smoothing. Open the query to see how the level and its change drop out of the same rows and swap the one strike line to print the at-the-money control instead:
-- Level vs velocity at one ETH strike bucket, 31-60 DTE, 72h hourly grid.
-- Swap the strike range to compare 1750 (ATM) against 3000 (deep OTM).
-- Source: deribit_options_liquidity, the same table the surface API reads.

WITH grid AS (
    SELECT generate_series(
        date_trunc('hour', NOW() - INTERVAL '72 hours'),
        date_trunc('hour', NOW()),
        INTERVAL '1 hour'
    ) AS ts
),
snap AS (
    SELECT l._timestamp AS ts,
           AVG(l.mark_iv)            AS iv,
           AVG(l.spread_percent)     AS spread,
           AVG(l.vega)               AS vega,
           COUNT(*)                  AS n_opts
    FROM deribit_options_liquidity l
    WHERE l.coin = 'ETH'
      AND l._timestamp >= date_trunc('hour', NOW() - INTERVAL '72 hours')
      AND l._timestamp <= NOW()
      AND l._timestamp IN (SELECT ts FROM grid)
      AND l.days_to_expiry BETWEEN 31 AND 60
      AND l.strike >= 3000 AND l.strike < 3250     -- ATM control: 1750 .. 2000
      AND l.mark_iv IS NOT NULL AND l.mark_iv > 0
    GROUP BY l._timestamp
),
diffs AS (
    SELECT ts, iv, spread, vega, n_opts,
           iv - LAG(iv) OVER (ORDER BY ts) AS d_iv
    FROM snap
),
lagged AS (
    -- window functions cannot be nested, so lag the change in its own step
    SELECT ts, iv, spread, vega, n_opts, d_iv,
           LAG(d_iv) OVER (ORDER BY ts) AS d_iv_lag1
    FROM diffs
)
SELECT ROUND(AVG(iv)::NUMERIC, 2)                                   AS iv_mean,
       ROUND(STDDEV_SAMP(iv)::NUMERIC, 3)                           AS level_std,
       ROUND(STDDEV_SAMP(d_iv)::NUMERIC, 3)                         AS velocity_std,
       ROUND((STDDEV_SAMP(d_iv)/NULLIF(STDDEV_SAMP(iv),0))::NUMERIC, 2) AS vel_to_level,
       ROUND(CORR(d_iv, d_iv_lag1)::NUMERIC, 3)                     AS div_lag1_autocorr,
       ROUND(AVG(spread)::NUMERIC, 2)                               AS spread_mean,
       ROUND(AVG(vega)::NUMERIC, 4)                                 AS vega_mean,
       ROUND(AVG(n_opts)::NUMERIC, 1)                               AS opts_per_snap
FROM lagged;Where People Actually Traded
Everything so far has read the quoted surface, the prices market makers are willing to show. There is a stricter test than that. Throw away every cell that did not actually trade and keep only the strikes and hours with real volume behind them. That is what the thermography footprint does. It colors a cell only where contracts genuinely changed hands, so it shows the vol the market paid rather than the vol a model quoted into an empty book:
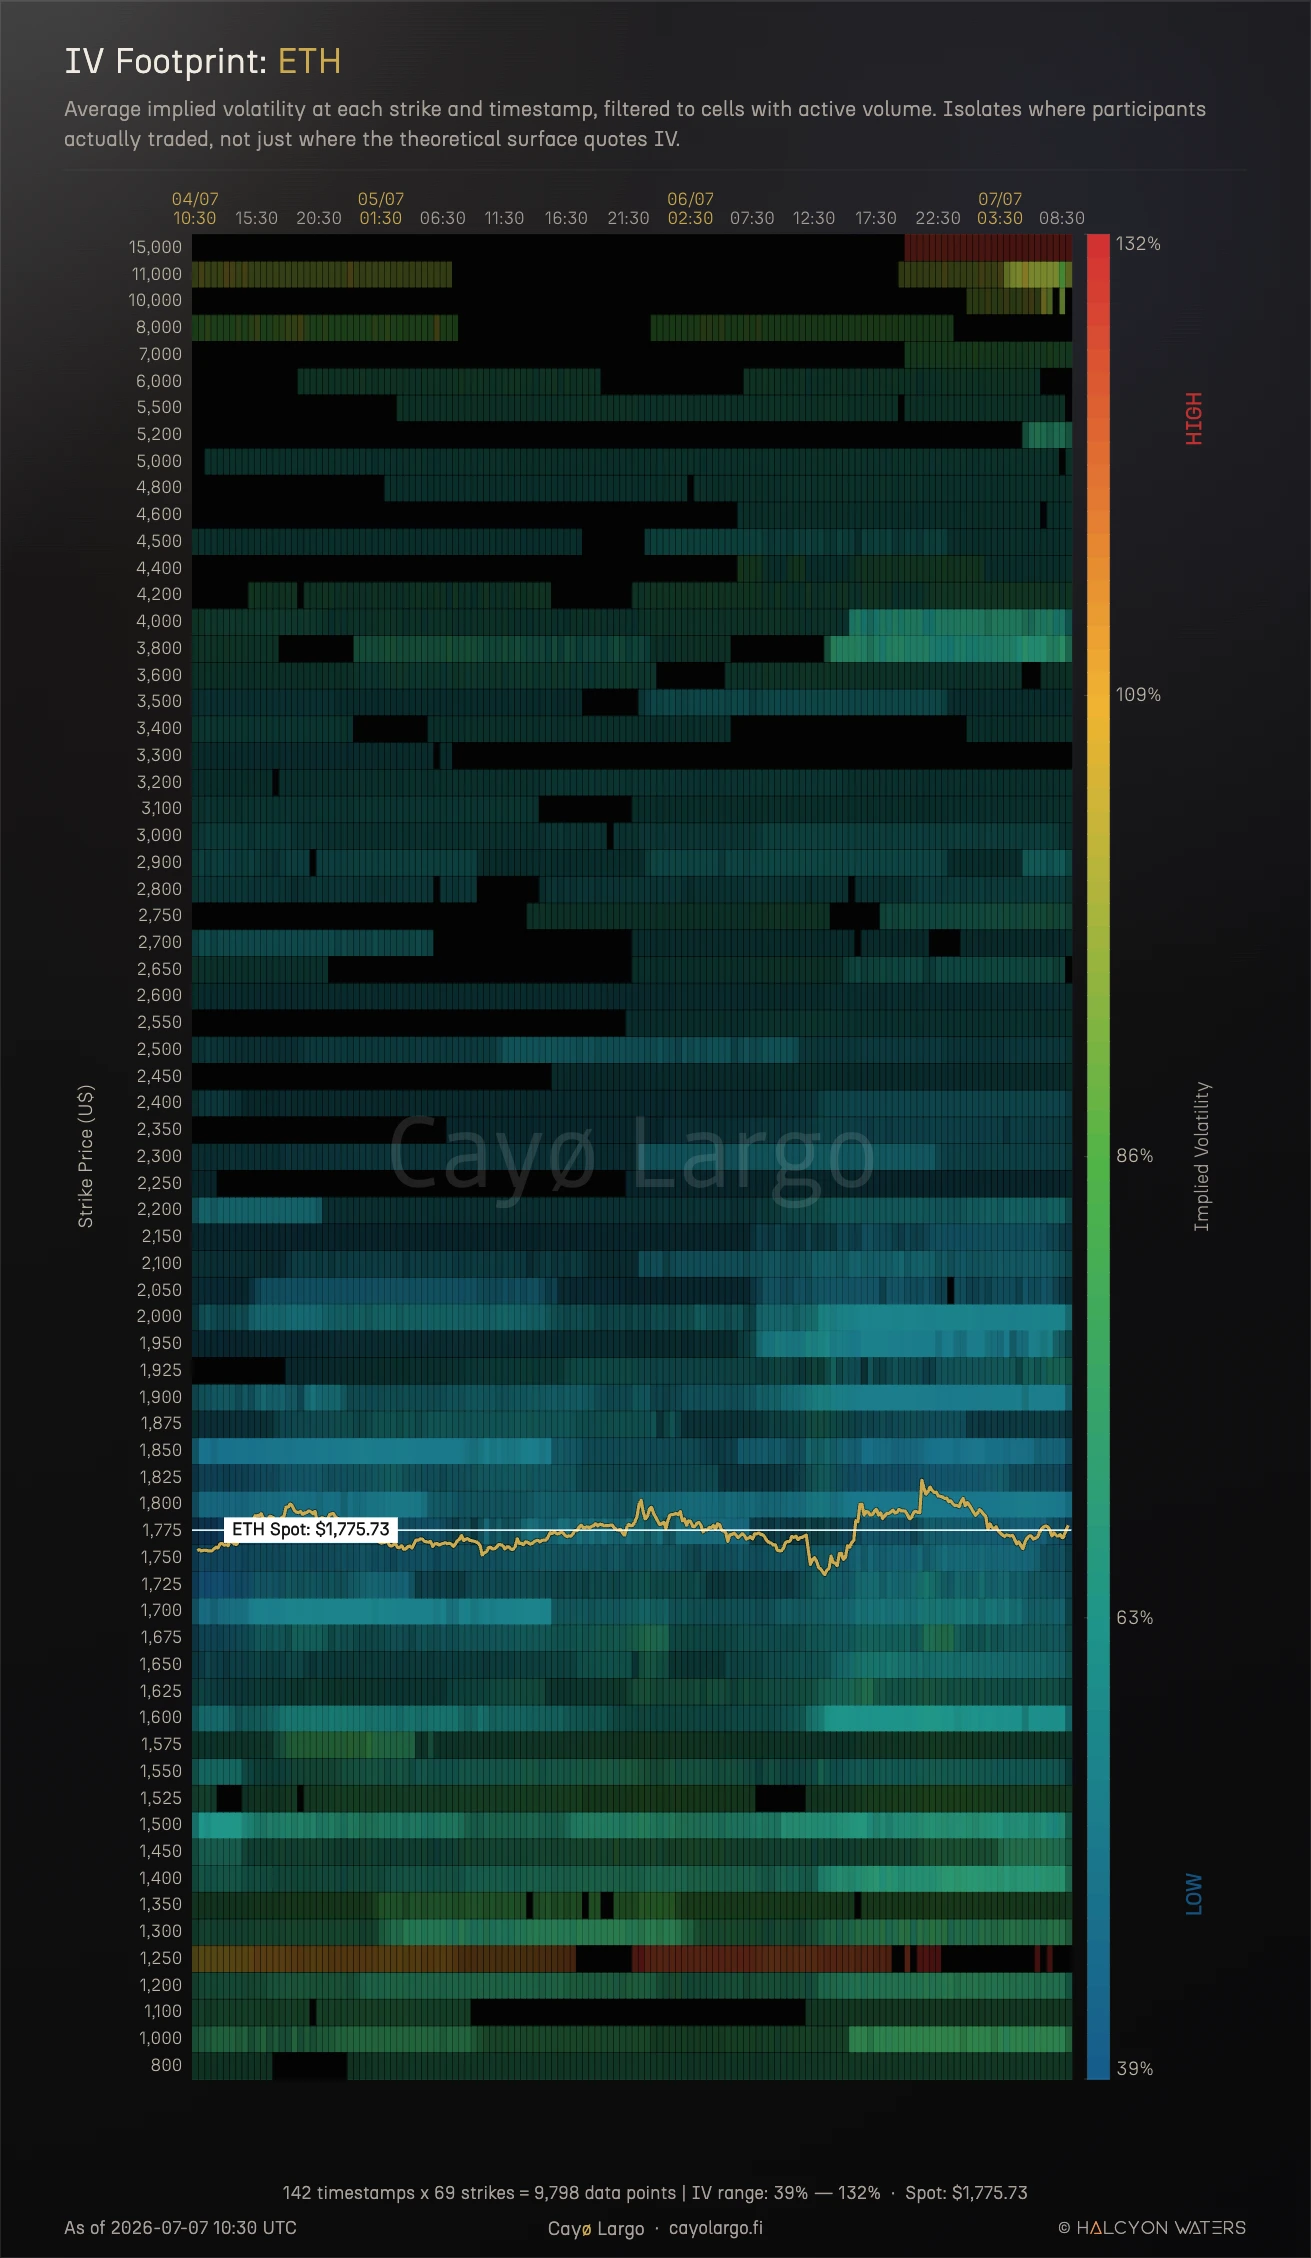
Figure 4: The thermography IV footprint, traded cells only, all expiries pooled. Around 3000, an hour above spot, the row is dim and even. None of the red-and-blue storm the momentum map drew at the same strike survives the trade filter.
At 3000 the footprint is dim and flat. Nothing lights up, nothing goes cold and none of the red-and-blue storm the momentum map painted at this strike survives. That is because almost nothing traded here in the first place. A 2.5-sigma strike on Deribit catches only a trickle of prints and even after pooling every expiry the row stays thin and even. All the momentum panel ever had to work with were quotes on a strike the market was barely touching. Filter down to where money actually moved and the turbulence does not merely quieten, it disappears. There was never a trade underneath it.
Reading a Thin Strike Without Getting Faked Out
The momentum panel is not useless, only conditional. Near the money its hourly change is real; out on a thin wing it mostly draws its own noise, so read the level there and distrust any loud print resting on one or two quotes. The 3000 strike was never in a storm. Its vol held near 60% for three days while the panel simply did what differencing does to a calm, thinly quoted line. Learn to tell the two apart and you can read every strike and coin the vol surface explorer shows.
Frequently Asked Questions
Can a stable IV smile show wild IV momentum at the same time?
Yes and it is common at deep out-of-the-money strikes. The momentum panel plots the change in implied vol from one hour to the next, not the level itself. At a thin strike the level is pinned near a fixed anchor and only jitters around it, so the level looks calm while its hourly change looks violent. They are the same data seen through a first difference, which behaves like a high-pass filter and magnifies the jitter.
What is the difference between IV level and IV momentum?
The level is the implied vol itself, the height of the smile at a strike. IV momentum is its rate of change, the one-hour percent move a momentum panel shows. At a liquid at-the-money strike the level trends and the momentum is small and meaningful. At a thin deep out-of-the-money strike the level barely moves while the momentum swings hard, because differencing a pinned, noisy series amplifies the noise.
Why is deep out-of-the-money implied volatility so noisy on crypto options?
Three things stack. Vega is roughly twelve times smaller than at the money, so a one-tick price wiggle maps to a large move in implied vol. Bid-ask spreads run near 25% versus 4 to 5% at the money, so the mark drifts with no trade behind it. And the strike bucket holds only one or two options whose membership changes each hour, so the average reshuffles even when nothing actually reprices.
Is IV momentum a real signal or just microstructure noise?
It depends on the strike. Near the money, where vega is large and spreads are tight, IV momentum carries real information and a run of same-direction moves is a position being built. On a thin wing it is mostly microstructure noise. The tell is whether the moves trend or reverse. On a deep out-of-the-money ETH strike consecutive hourly changes had a lag-one autocorrelation near minus 0.58, meaning almost every move was undone the next hour, the fingerprint of noise.
How do bid-ask spreads affect implied volatility at thin strikes?
A wide spread lets the mark price float anywhere between bid and ask with no trade behind it and implied vol is computed from that mark. At a deep out-of-the-money crypto strike the spread can run near 25% of the option price, against 4 to 5% at the money, so the implied vol can move a full point hour to hour on spread drift alone, before any real repricing has happened.
What is a sticky strike and does it explain deep-OTM IV moves?
Sticky strike is one of the regimes Emanuel Derman described for how a volatility skew moves with spot. Under it a fixed strike keeps its implied vol as spot shifts, so its moneyness changes and it slides to a new point on the smile. It can move a fixed out-of-the-money strike's IV when spot travels but it is minor for deep-OTM momentum noise. In the ETH example the loudest swings happened while spot sat almost still.
How do you tell IV momentum noise from a real move?
Read the level rather than the hourly change out on the wings. Check how many options sit in the bucket and distrust any reading built on one or two quotes. Ask whether the move trends or snaps back, since a whipsaw that reverses each hour is noise. And compare the strike against a liquid at-the-money strike over the same hours. If the wing is loud while the core stays calm, it is microstructure at the wing, not a market-wide vol move.
Related Articles
Why Crypto IV Spikes Before Expiry: The Bow Shock
Why does crypto implied volatility spike before expiry? An IV Footprint heatmap shows a bow-shaped front flaring at the wings before each Deribit settlement.
Crypto Variance Risk Premium: Live IV vs RV on Six Coins
How to read IV vs RV charts and the variance risk premium to figure out whether crypto options are overpriced, underpriced, or fairly valued. Live AVAX example from Deribit.
Why Knowing Your Greeks Won't Save You on Deribit
You learned Delta, Gamma, Theta. You can explain Black-Scholes over coffee. Then you open Deribit's options page and none of it helps. Here's why options theory breaks down on a live screen.