Lightning Greek BTC Options Trading Strategy
Short-dated BTC options pay sellers when the market overprices a move, though not at every strike or on every morning. We combined Cayø Largo's Lightning Greek map with a calm-morning check into six rules. They made money from March to October 2026 and we show where they break.
At 04:00 UTC on Monday, 26 October 2026, BTC traded at 79,475 USD and the day's options had four hours left before their 08:00 settlement. The call one strike above spot, at 79,500, was bid at about 199 USD. Nothing about the price warned a seller off it. Two things did. The open interest at that strike was 266 puts against 7 calls, the puts just in the money. The last four hours had also run hotter than the options priced. By 08:00 BTC had settled at 79,945 and the call had cost its seller 282 USD.
Both warnings are visible in advance. The first sits on a map few traders have looked at, the Lightning Greek exposure of Cayø Largo's Greek Exposure Surface. The second is a one-line comparison of recent and implied volatility. Put together, they make six rules for selling BTC options in the last four hours before expiry. On 212 Deribit daily expiries from late March to October 2026, those rules made money in six months out of eight and won four mornings in five. This note explains the map, the rules, how they work on one morning and how they did across seven months, including where they break. Readers who know the Greek can start at section 2.
1. What does Lightning Greek measure on a strike?
Most Greeks measure how an option's value changes with spot, time or volatility. A small family measures how it changes with the strike . The second strike derivative is the risk-neutral density of where the coin settles, scaled by the discount factor (Breeden and Litzenberger, 1978). Lightning Greek is one step further: the slope of that density across strikes. Under Black-Scholes it has a closed form, which we derived in an earlier note on Lightning Greek and Dual Gamma:
Here is the option value, the standard normal density, the implied volatility, the time to expiry in years, the interest rate and the usual Black-Scholes term. Nothing in the formula depends on whether the option is a call or a put, so the two carry the same Lightning Greek at one strike. The bracket changes sign at the density's peak. For an expiry hours away that peak sits practically at spot, so Lightning Greek is negative on strikes above spot and positive below it.
The map adds the open interest. For each strike and each ten-minute snapshot it sums Lightning Greek over the contracts outstanding, calls minus puts:
where is open interest in contracts. Blue marks negative exposure, orange positive. This is not a dealer position. It weights open interest by a Greek and says nothing about who is long or short.
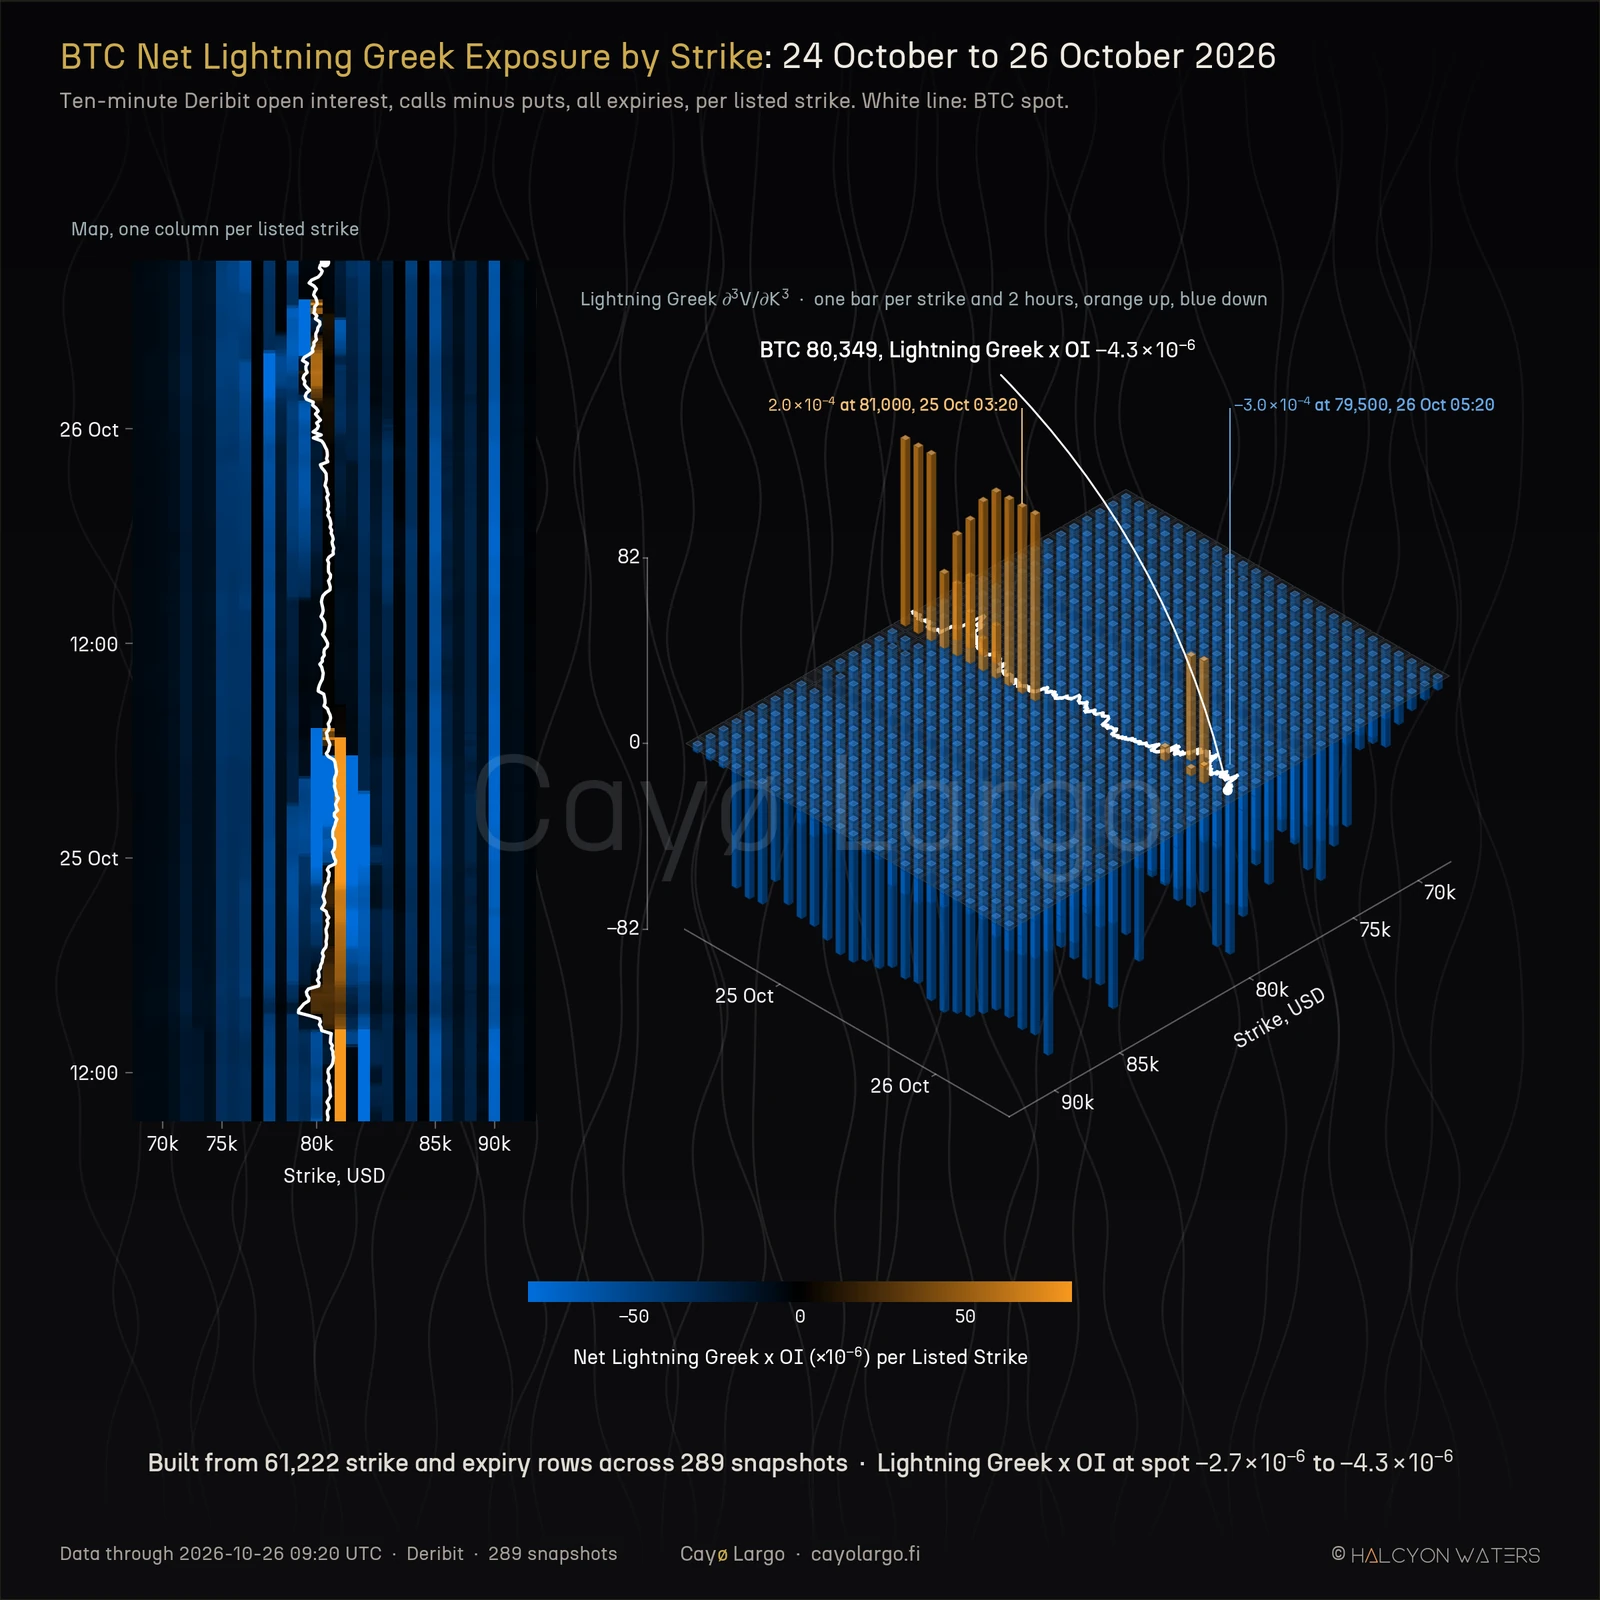
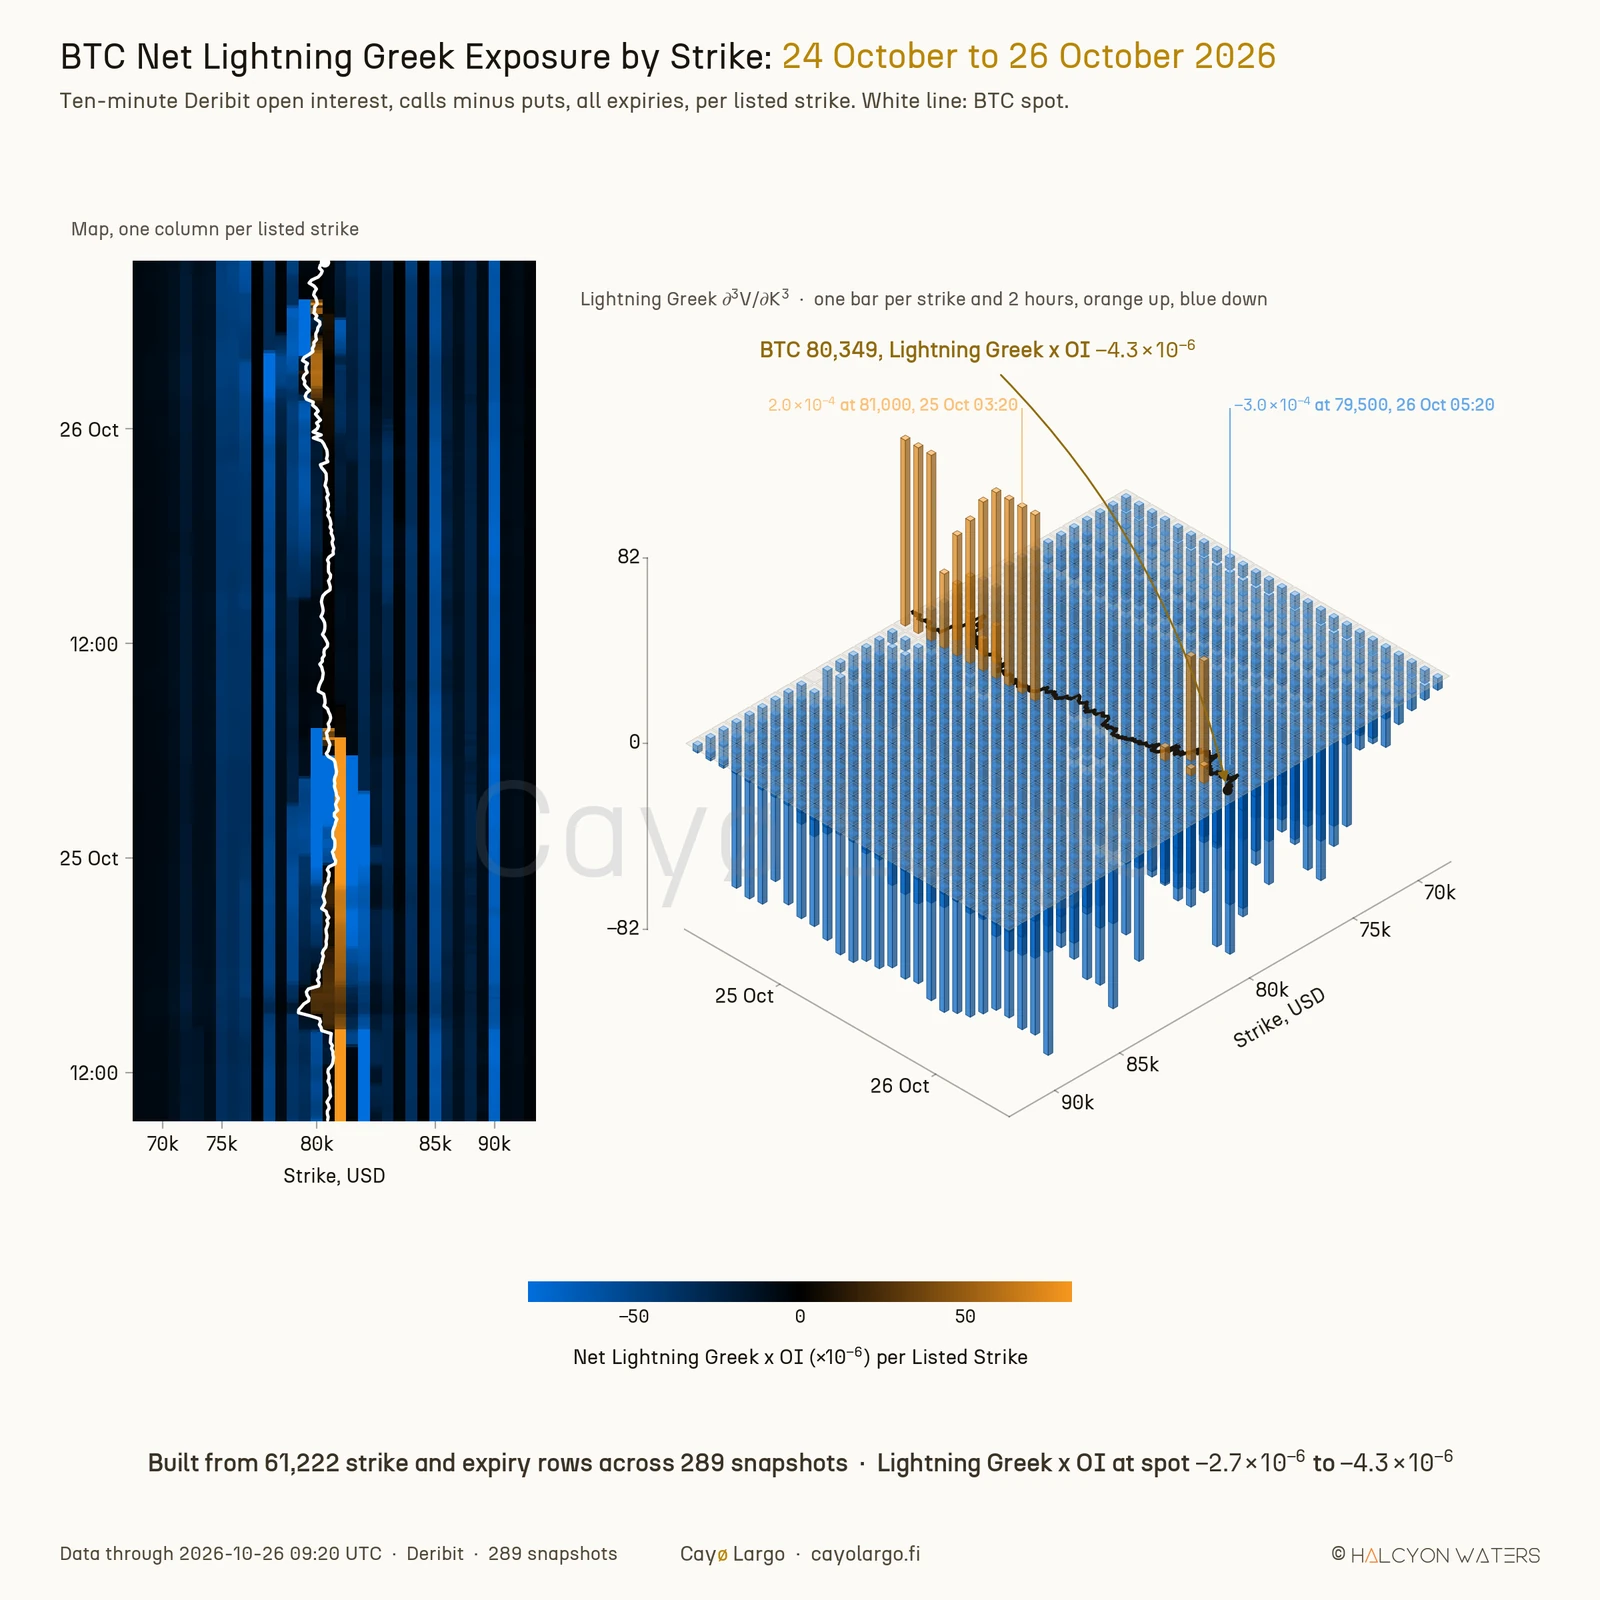
Figure 1: BTC Lightning Greek exposure, all expiries summed, every ten minutes from 24 to 26 October 2026. The map on the left is the panel on the Greeks Tectonics Laboratory page with one column per listed strike. The right-hand view draws each strike and two-hour bin as a bar, orange rising above the floor and blue hanging below it. 97% of the bars are blue. The orange ones all sit within a strike or two of spot.
2. What does the colour tell an option seller?
Put the two pieces together. Above spot Lightning Greek per contract is negative, so a strike turns orange only when put open interest exceeds call open interest. Those puts are in the money. Below spot Lightning Greek is positive, so orange needs more calls than puts. Those calls are in the money. Either way orange marks a strike where the in-the-money side holds more contracts than the out-of-the-money side. We call it a contested strike. Blue is the ordinary book, where out-of-the-money contracts dominate.
We checked the reading rather than assuming it. On every near-money strike of 212 BTC daily expiries the colour agreed with the open-interest comparison on 99.3 to 99.4% of strikes, at two, four and six hours before settlement. No chart a trader commonly uses shows this, because it needs open interest strike by strike for one expiry, every ten minutes, with the Greek computed on each contract.
3. Why do the last four hours before expiry pay a seller?
An option a few hours from expiry is cheap in dollars and expensive in odds. Its price reflects how likely the market thinks it is that spot crosses the strike before settlement. If that likelihood is set too high, a seller who collects the premium on many such options earns the difference over time. Academic work on zero-day equity index options has made this market a research subject of its own, with closed-form pricing and estimates of the risk premia they carry (Bandi, Fusari and Renò, 2024).
Deribit's BTC dailies carry that cushion. We compared, for every strike near spot, how often settlement actually finished beyond it with the probability the option's own implied volatility gave it:
with the standard normal distribution and the Black-Scholes term built from the series' forward, the strike's mark IV and the time left. On blue strikes read four hours before settlement, BTC finished on the far side 7.7% of the time against 12.4% priced. That gap is the seller's edge, measured in percentage points (pp). On orange strikes it is gone:
| BTC, read before settlement | Blue strikes, crossed minus priced | Orange strikes, crossed minus priced | Orange minus blue |
|---|---|---|---|
| 2 hours | -7.1 pp | -4.9 pp | +2.3 pp |
| 4 hours | -8.2 pp | +3.8 pp | +12.1 pp |
| 6 hours | -6.5 pp | +3.5 pp | +10.0 pp |
Strikes the market gave at least a 15% chance of being crossed, 212 expiries, 27 March to 26 October 2026, in percentage points. The near-money strikes show a wider gap than all blue strikes together. A negative number means the strike was crossed less often than priced, which is what a seller wants.
Four hours out the two colours part most clearly: blue strikes were crossed 8.2 percentage points less often than priced, orange strikes 3.8 points more often. The colour tells a seller where the edge is and where it has already been spent.
The second ingredient is the morning itself. Implied volatility is the market's forecast of the next four hours. Realised volatility over the last four hours is what the market has actually been doing. When the recent past has been calmer than the forecast, the options are priced for more movement than the tape is showing. That is the moment to sell. When the last four hours ran hotter than implied, the seller is being paid too little for the risk on the screen.
4. The calm-morning Lightning Greek rules.
Six rules, fixed before testing and unchanged since:
- Trade the BTC 08:00 UTC daily expiry. Decide at 04:00 UTC. Four hours out is where the colours separate most clearly.
- Check the morning. Compare the realised volatility of the last four hours with the at-the-money implied volatility of that expiry. If realised is higher, do not trade today. A hot morning is one the options have not priced.
- Read the Lightning Greek map of the expiring series only. The contracts settling at 08:00 decide who gets paid, so their colour is the one that matters.
- Sell the first out-of-the-money call above spot and the first out-of-the-money put below it, if the strike is blue. If it is orange, step one listed strike further out, at most twice. Sell the strike reached whatever its colour. Skip a side that has no bid there.
- One contract per leg, sold at the bid. One Deribit BTC option contract is an option on one BTC. Four hours before settlement the books are thin, so check that the bid holds your size.
- Hold to settlement. Deribit settles on the average of its index from 07:30 to 08:00 UTC (Deribit Insights, 2020). In our tests, buying the options back before then at the ask cost more than it saved.
The legs are sold uncovered, so the loss on a single morning has no ceiling. The worst in the measured period was 980 USD per contract per leg, on 23 June 2026. Section 9 shows why we did not cap it: the protecting options cost more than they saved.
Every result below pays Deribit's taker fee of 0.03% of the underlying, capped at 12.5% of the option price, plus the 0.015% settlement fee on options that finish in the money. Rule 2 was chosen on February to June and then checked, unchanged, on July to October.
5. The rules applied step by step: 23 September 2026.
The rules of section 4, applied to one real morning in the order a trader meets them. 23 September 2026 was an ordinary calm morning, neither the best nor the worst of the period.
- Check the morning. At 04:00 BTC traded at 86,678 USD. Over the previous four hours it had moved at 30.3% annualised, below the 31.1% at-the-money implied volatility of the 08:00 series. Rule 2 says trade.
- Read the map of the expiring series. Figure 2 shows the Lightning Greek colour of each strike near spot at 04:00 with its open interest. Above spot, 87,000 holds 133 calls against 9 puts: the out-of-the-money calls dominate and the strike is blue. Below spot, 86,500, 86,000 and 85,500 each hold more calls than puts, calls already in the money, so all three are orange. Blue returns at 85,000, where 278 puts outweigh 28 calls.
- Sell the call. 87,000 is blue, so the rule sells it at the bid: BTC-23SEP26-87000-C for 0.0011 BTC, 95 USD, with 33.6 BTC resting at that price.
- Step past orange on the put side. 86,500 is orange, so the rule moves to 86,000. That strike is orange too, so it moves once more, to 85,500. Two steps is the most it allows, so it sells that strike whatever its colour: BTC-23SEP26-85500-P for 0.0002 BTC, 17 USD. The 86,500 put it walked past was bid at 0.0016 BTC, eight times as much. The rules give that premium up because the strike is contested.
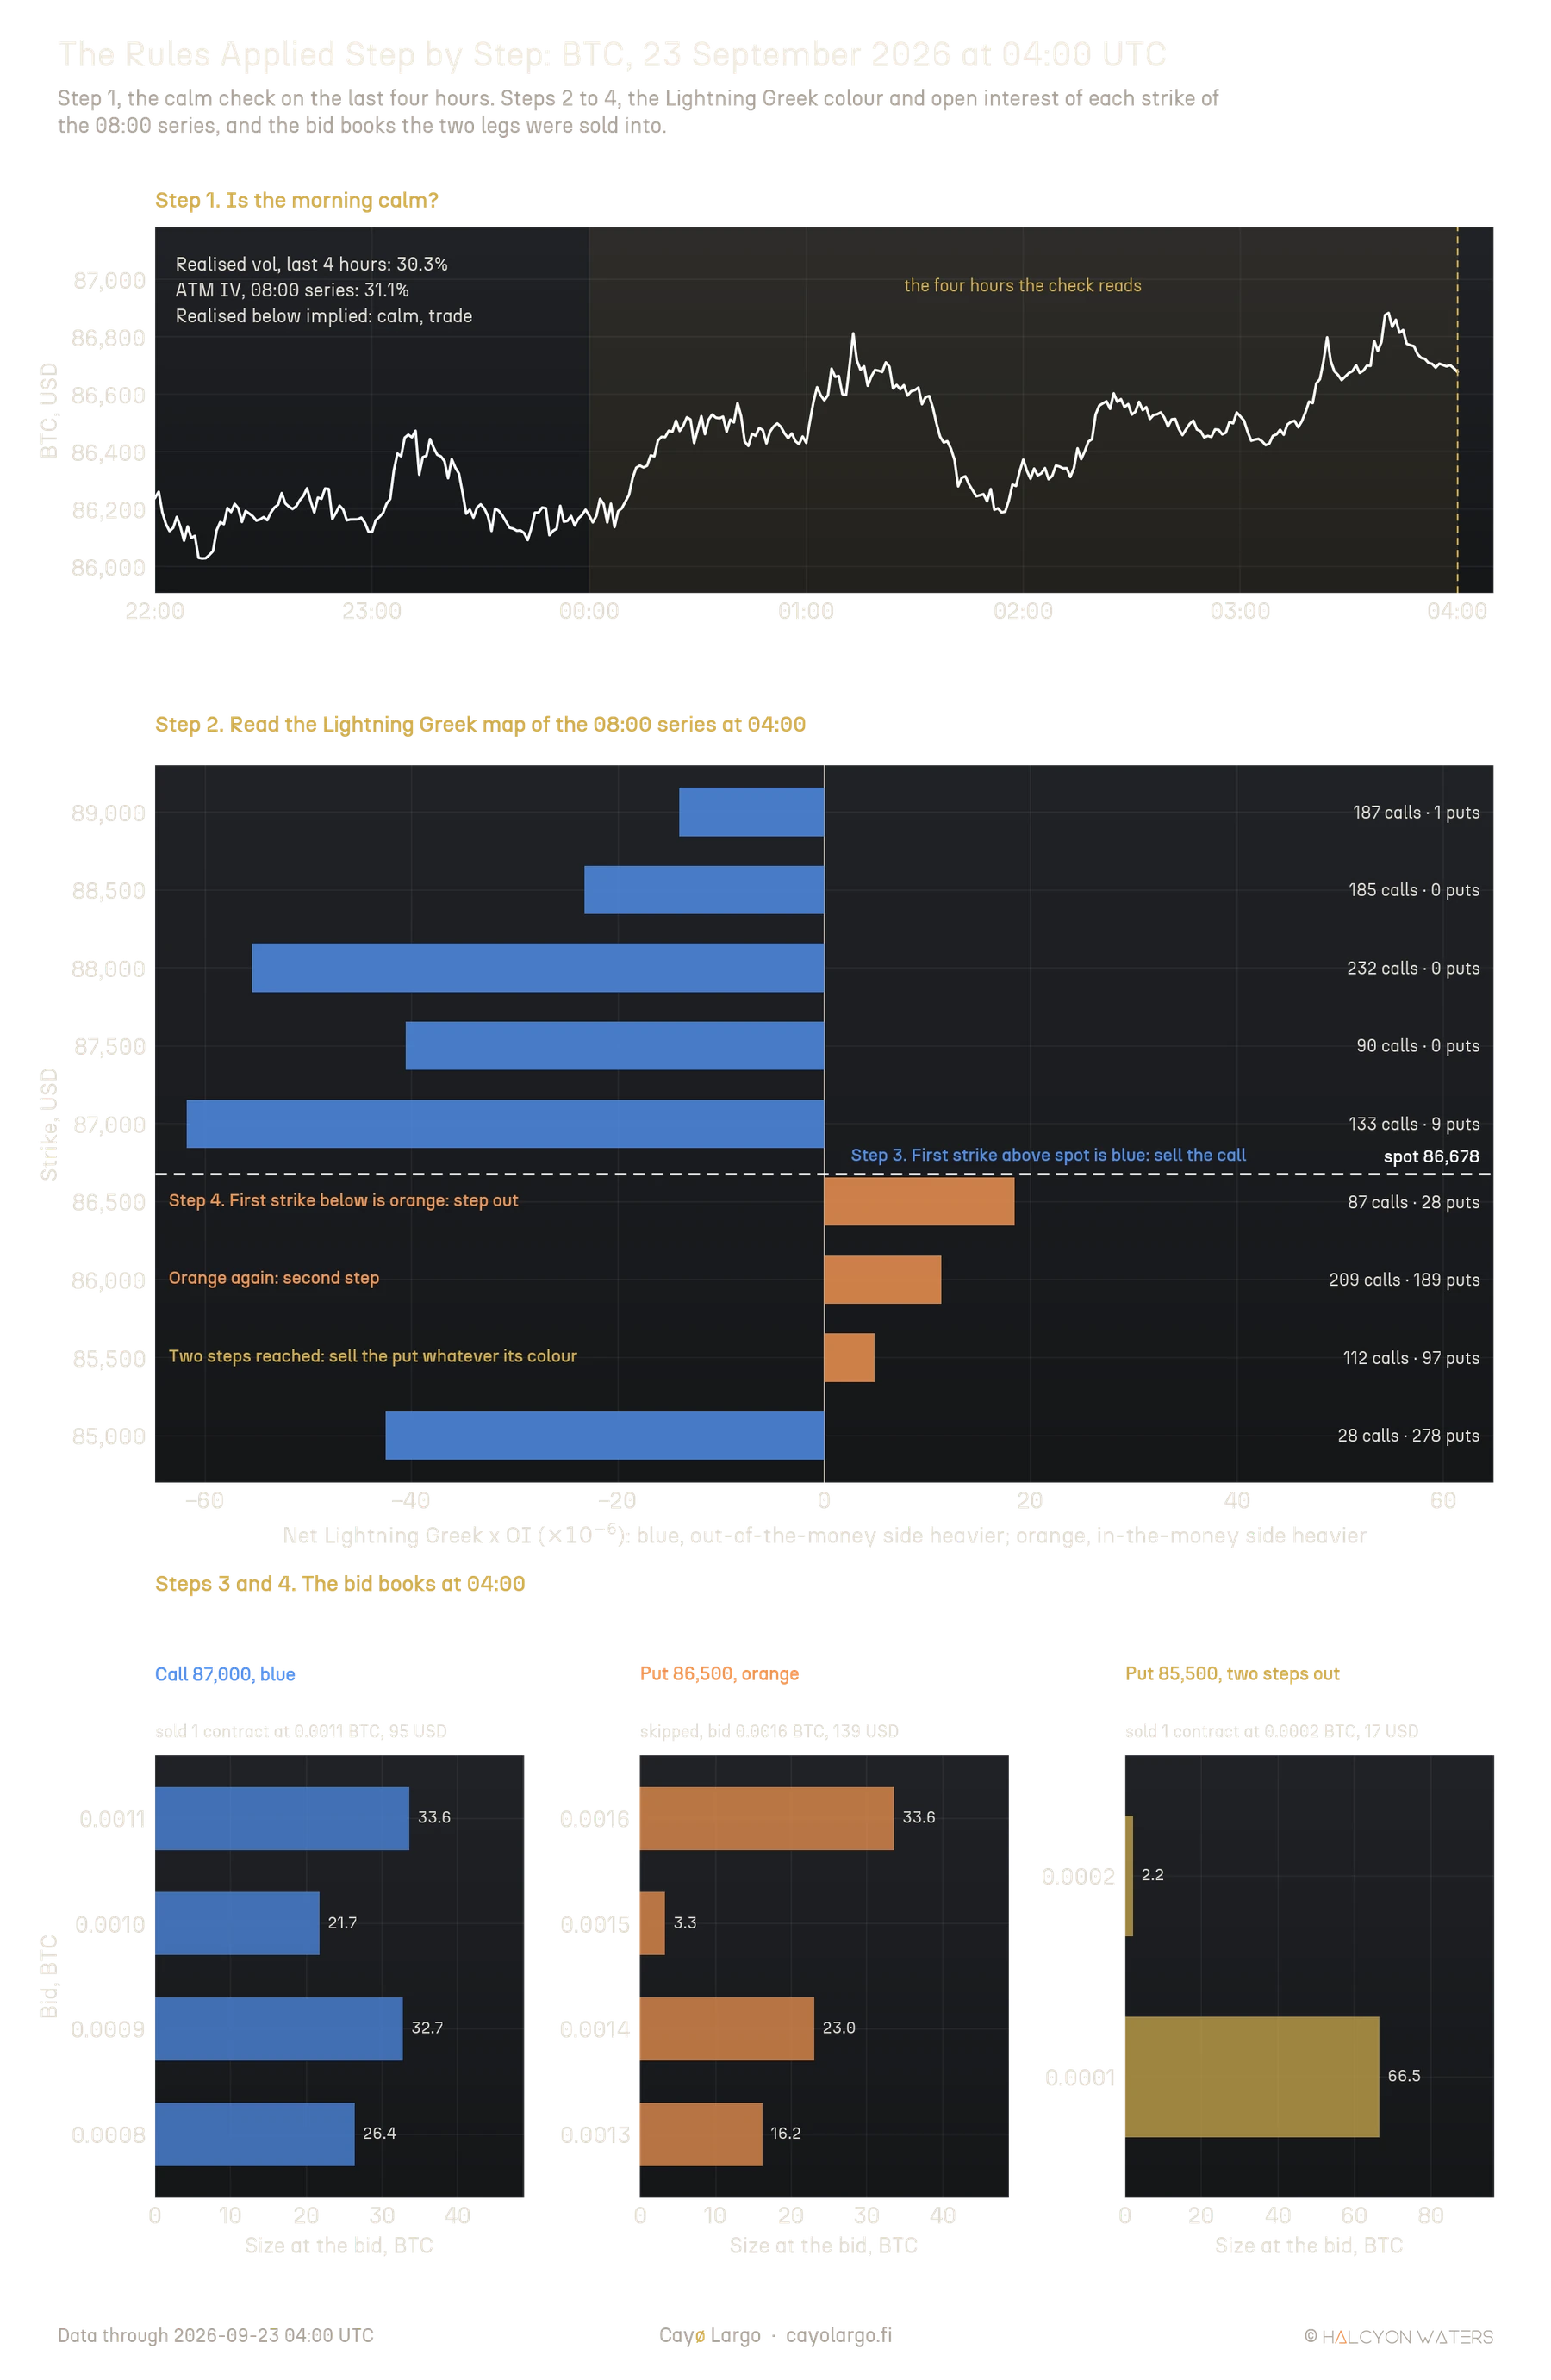
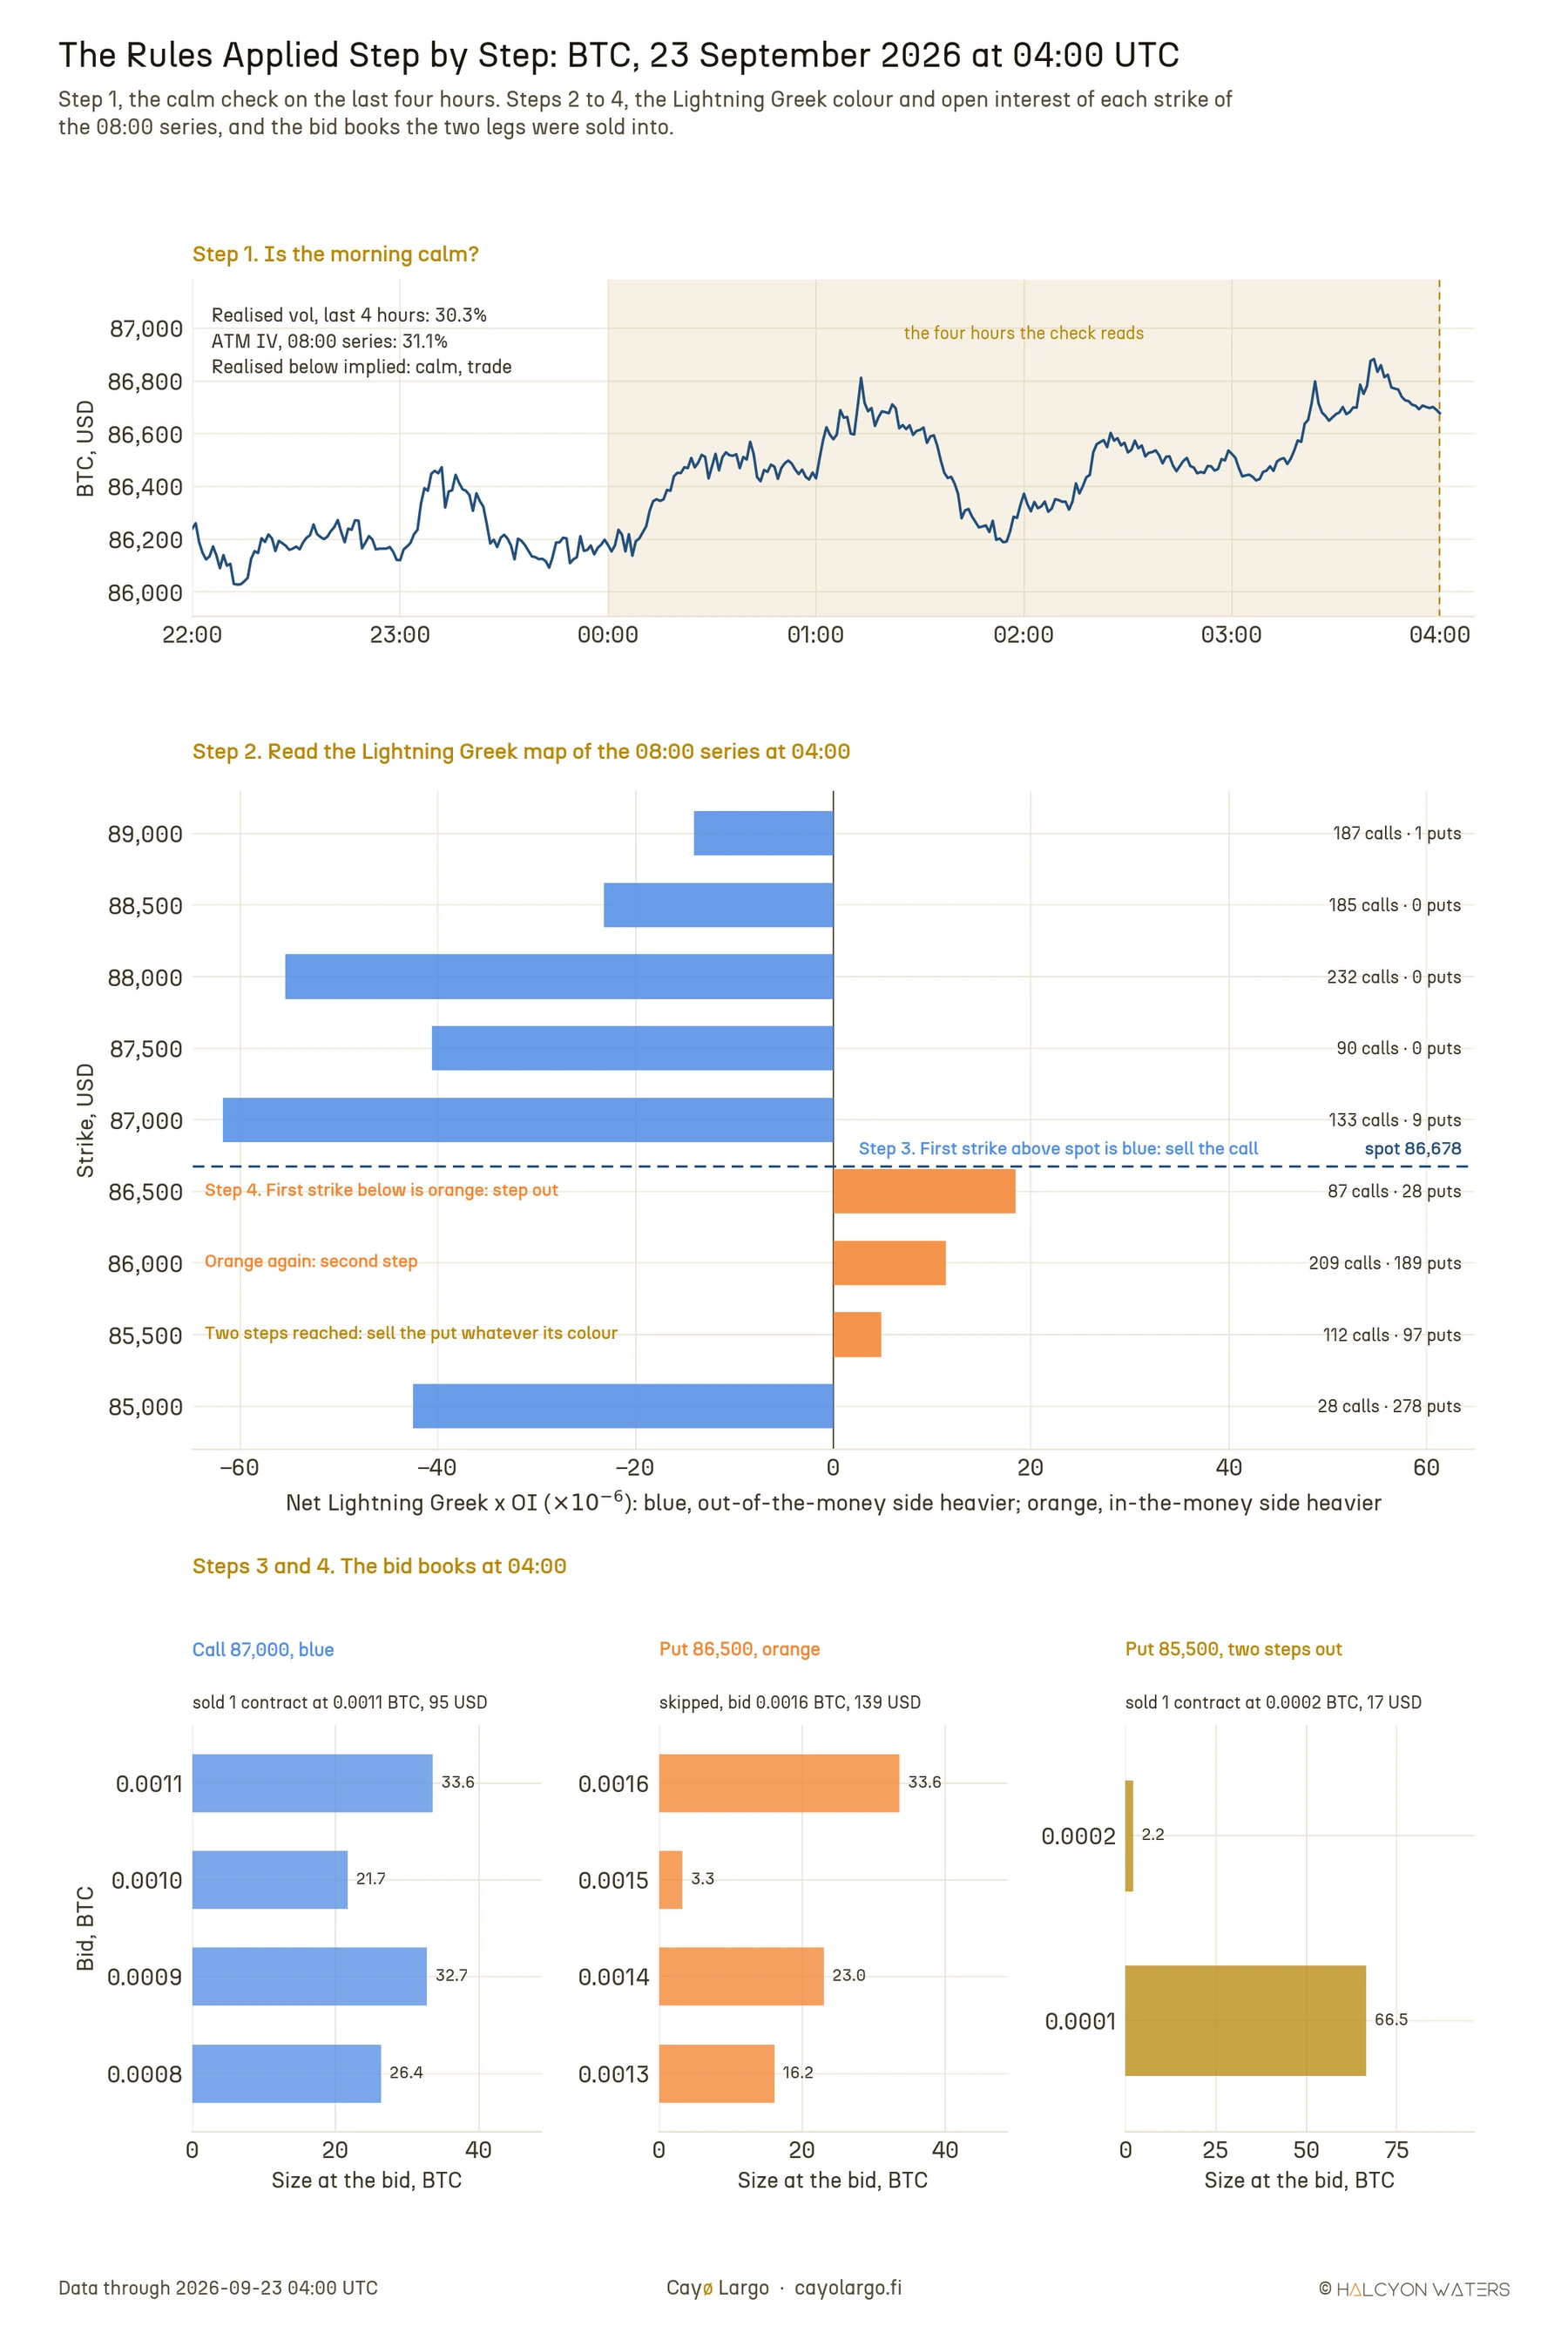
Figure 2: The rules applied to 23 September 2026 at 04:00 UTC. Top, BTC over the six hours to 04:00 and the four hours the calm check reads. Middle, net Lightning Greek x open interest and the open interest of each strike of the 08:00 series. Bottom, the 04:00 bid books of the sold call, the skipped orange put and the sold put.
- Know what the position risks. Figure 3 draws the pair the way traders usually draw an options trade, as profit and loss at settlement against the settlement price. Beside it sits the pair a textbook seller would have chosen, the nearest call and put. Underneath is what a payoff diagram never shows, the Lightning Greek profile of the strikes.
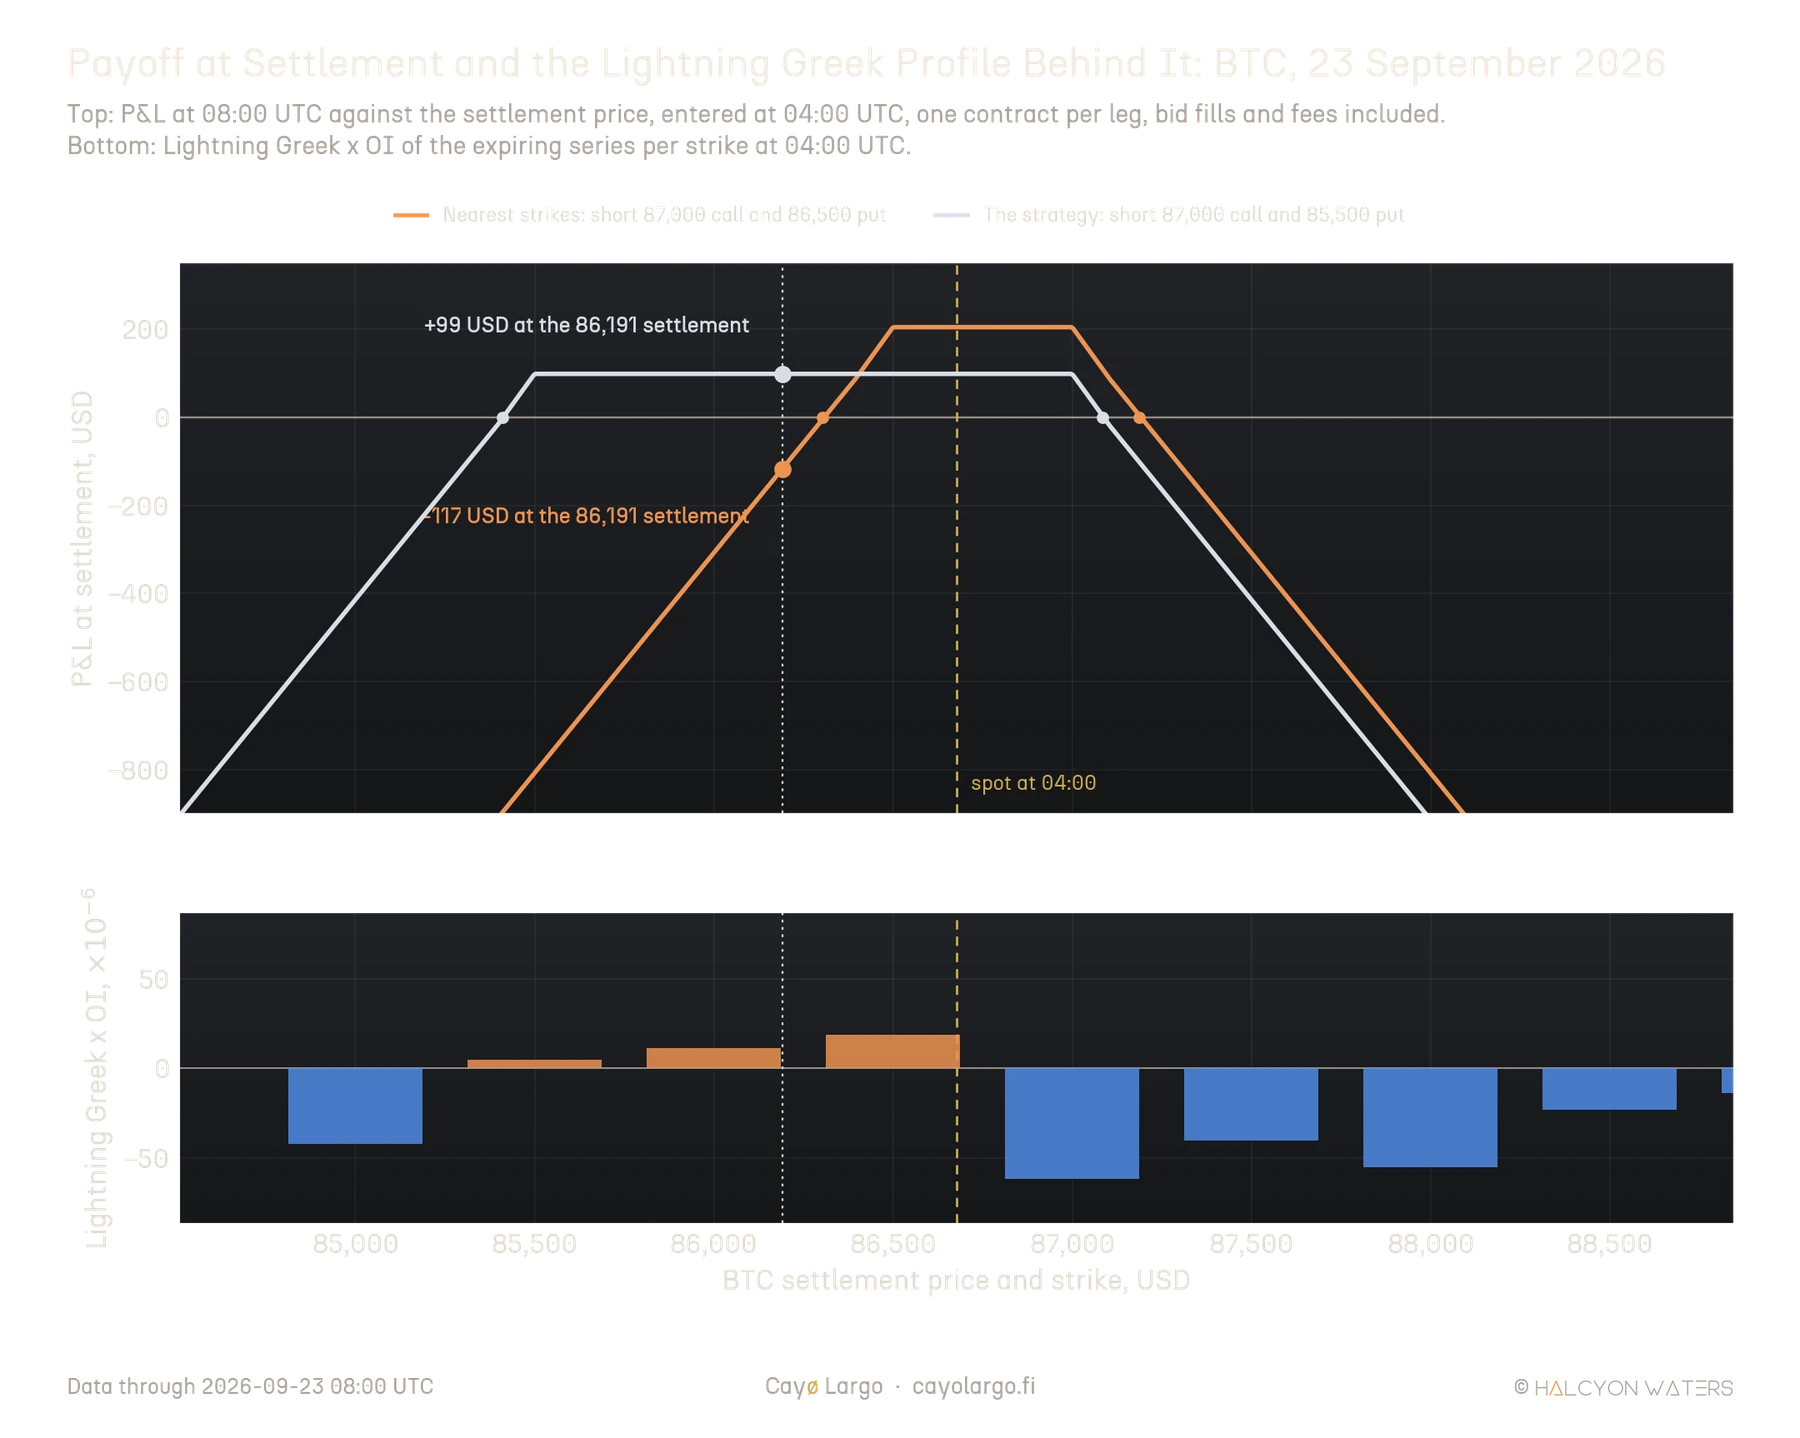
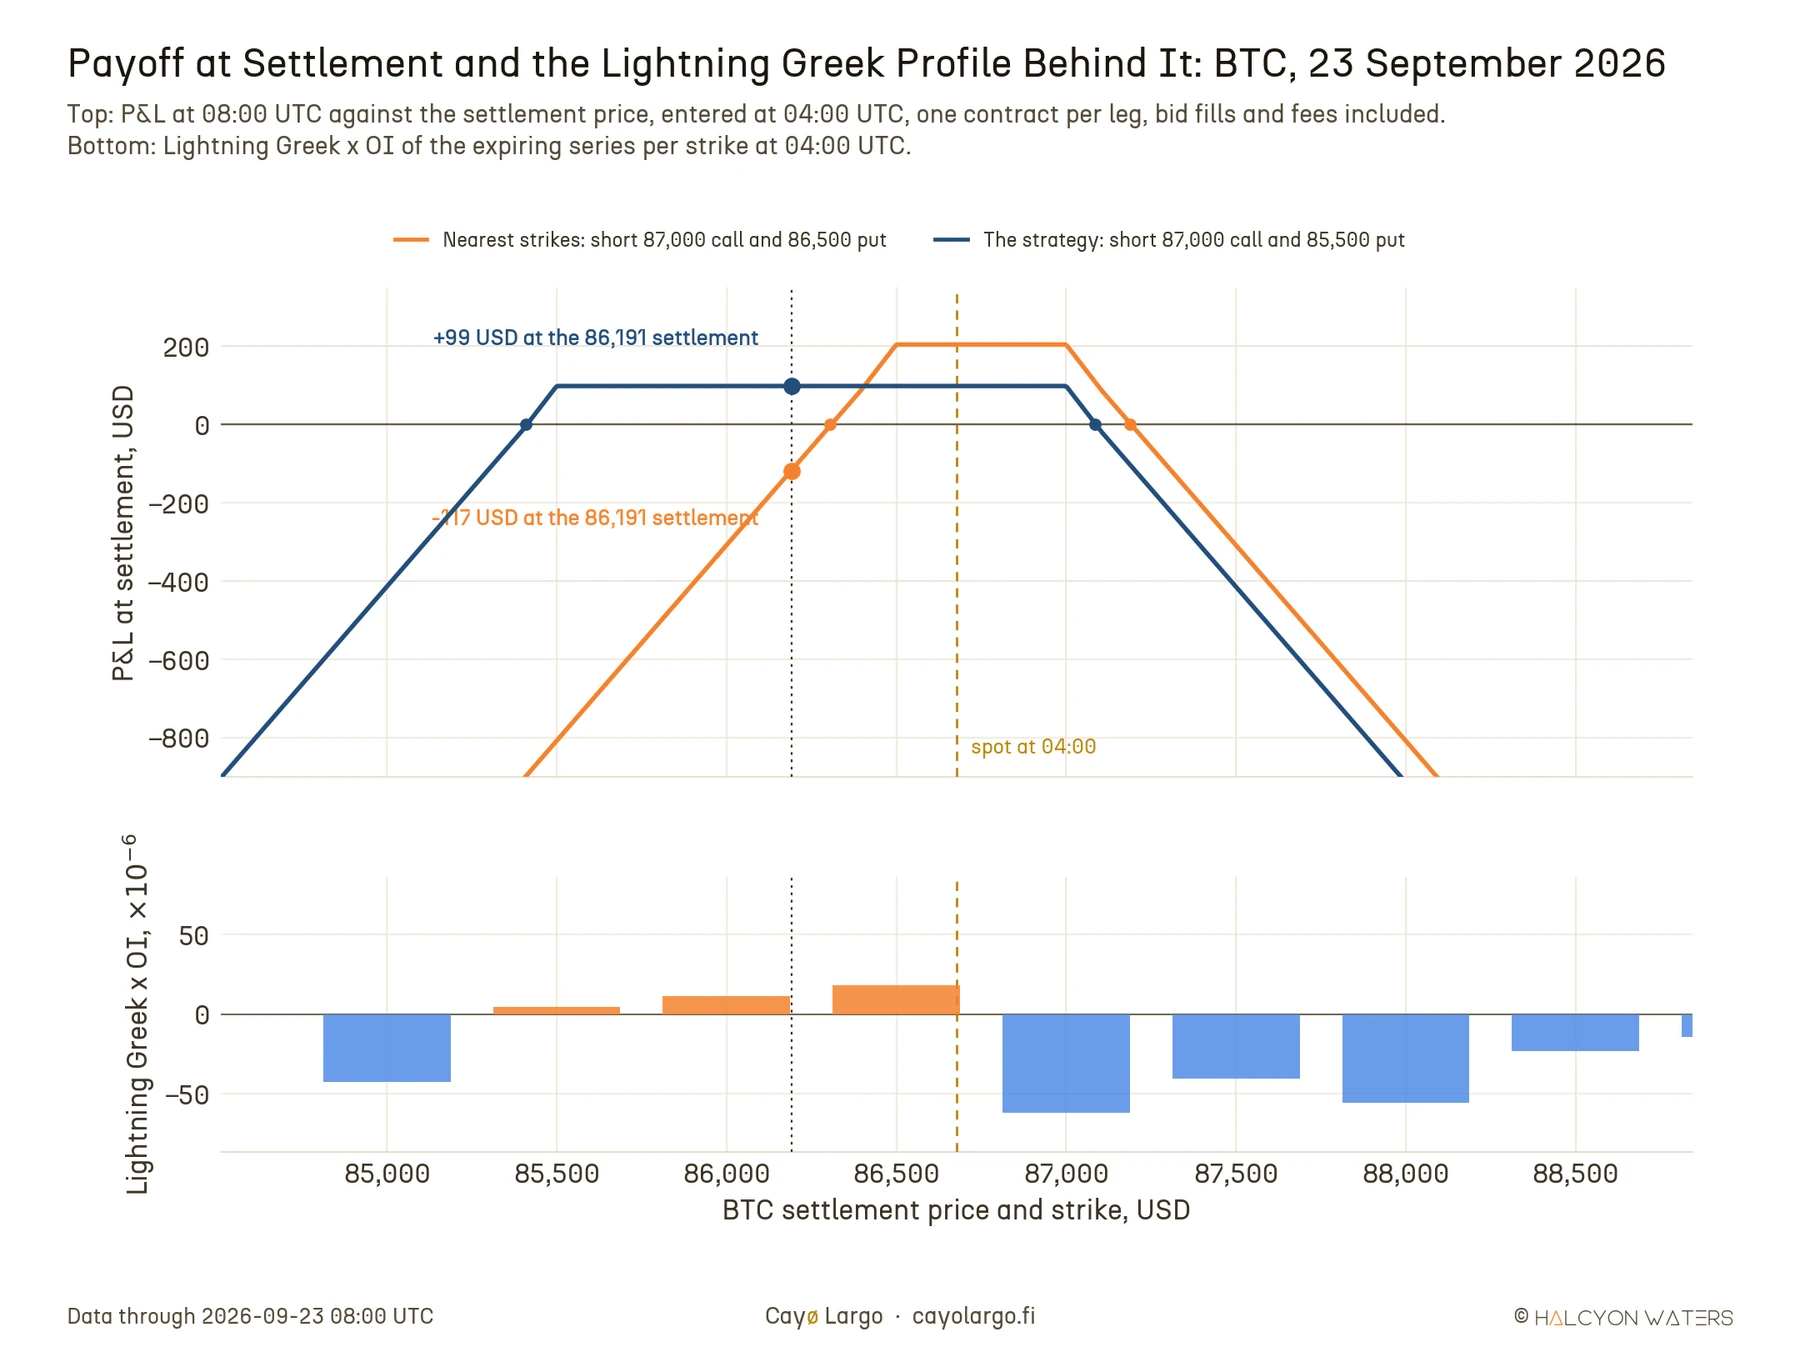
Figure 3: Payoff at settlement on 23 September 2026, one contract per leg, entered at 04:00 UTC at the fills the test used, fees included. The dots on the zero line are break-evens. Below, the Lightning Greek profile of the expiring series that chose the strikes.
The nearest pair offered twice the premium and a tidy peak of 205 USD. Its lower break-even, 86,304, sat in the middle of the orange strikes, exactly where the in-the-money calls had piled up. The strategy gave up half the premium to move that break-even to 85,410, below the orange band. Its profit zone ran 1,674 USD wide against 883 USD for the nearest pair.
- Hold to settlement. Figure 4 follows the morning to 08:00. The pair was about 230 USD down at 04:50 as the options repriced and recovered from there. BTC touched 86,038 at 07:44, still above the put. It settled at 86,191, between the two strikes and inside the wide profit zone. The pair kept 99 USD. A seller who took the nearest put at 86,500 would have lost 201 USD on it and 118 USD on the day.
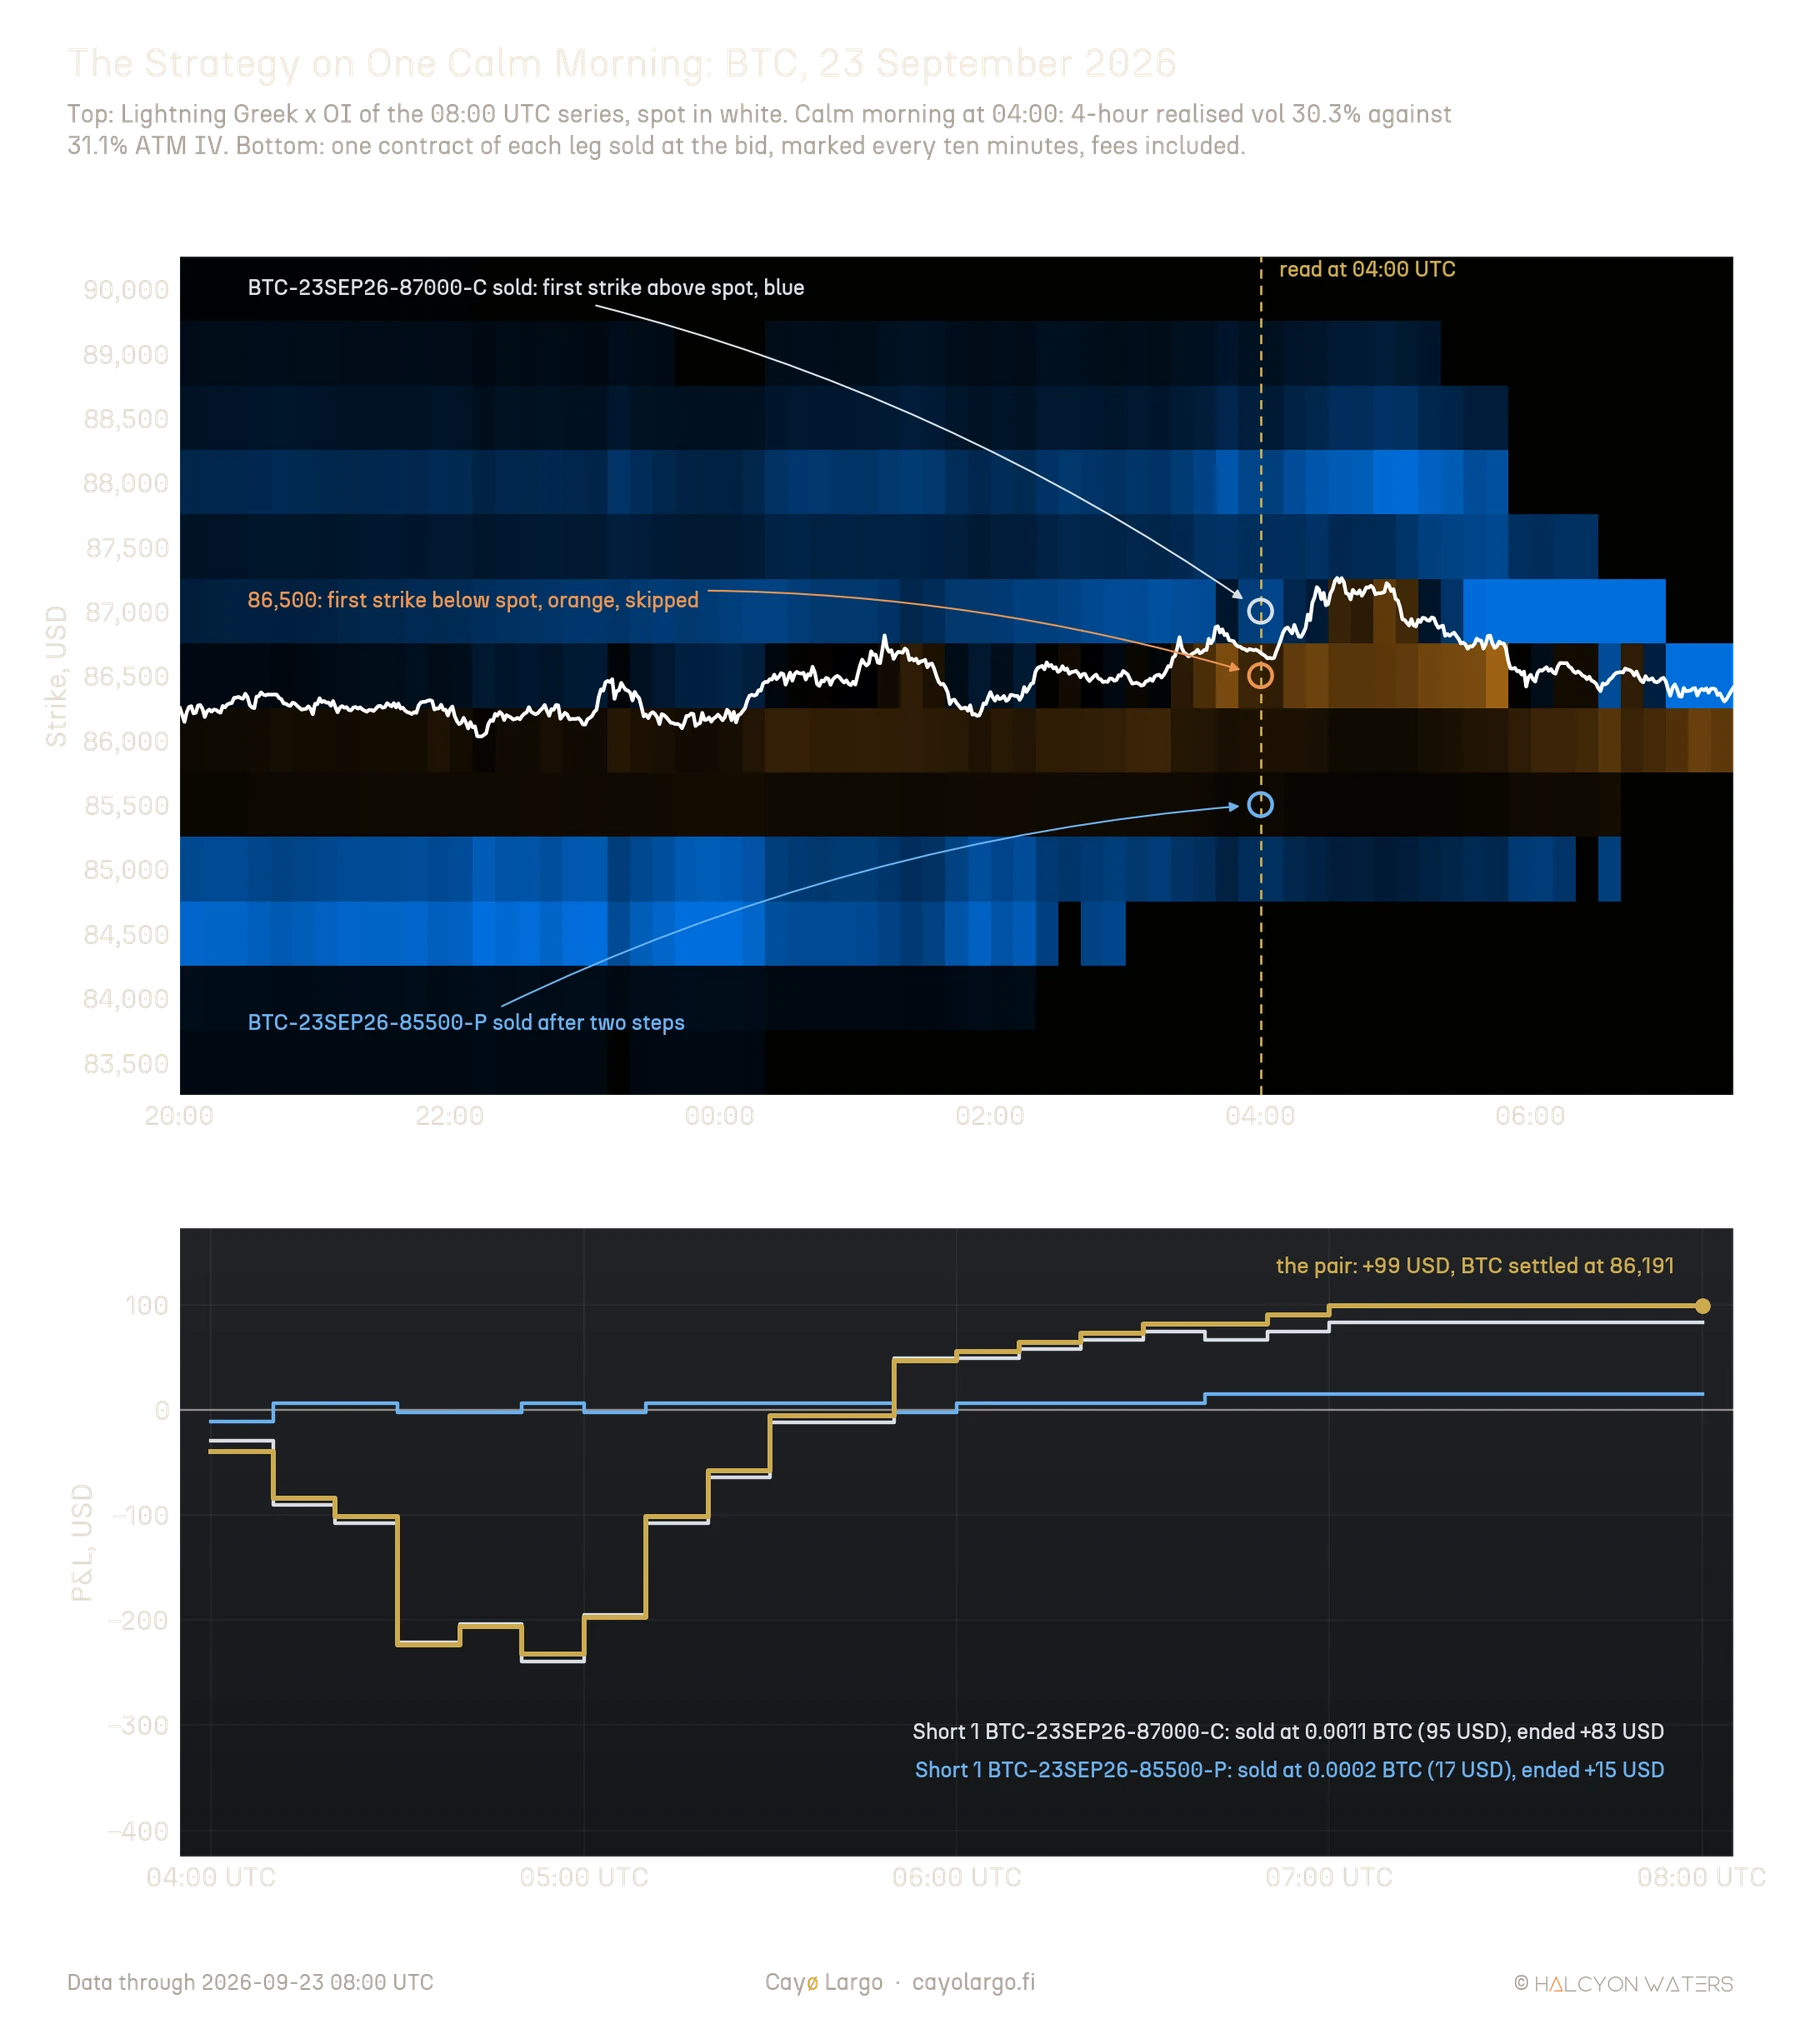
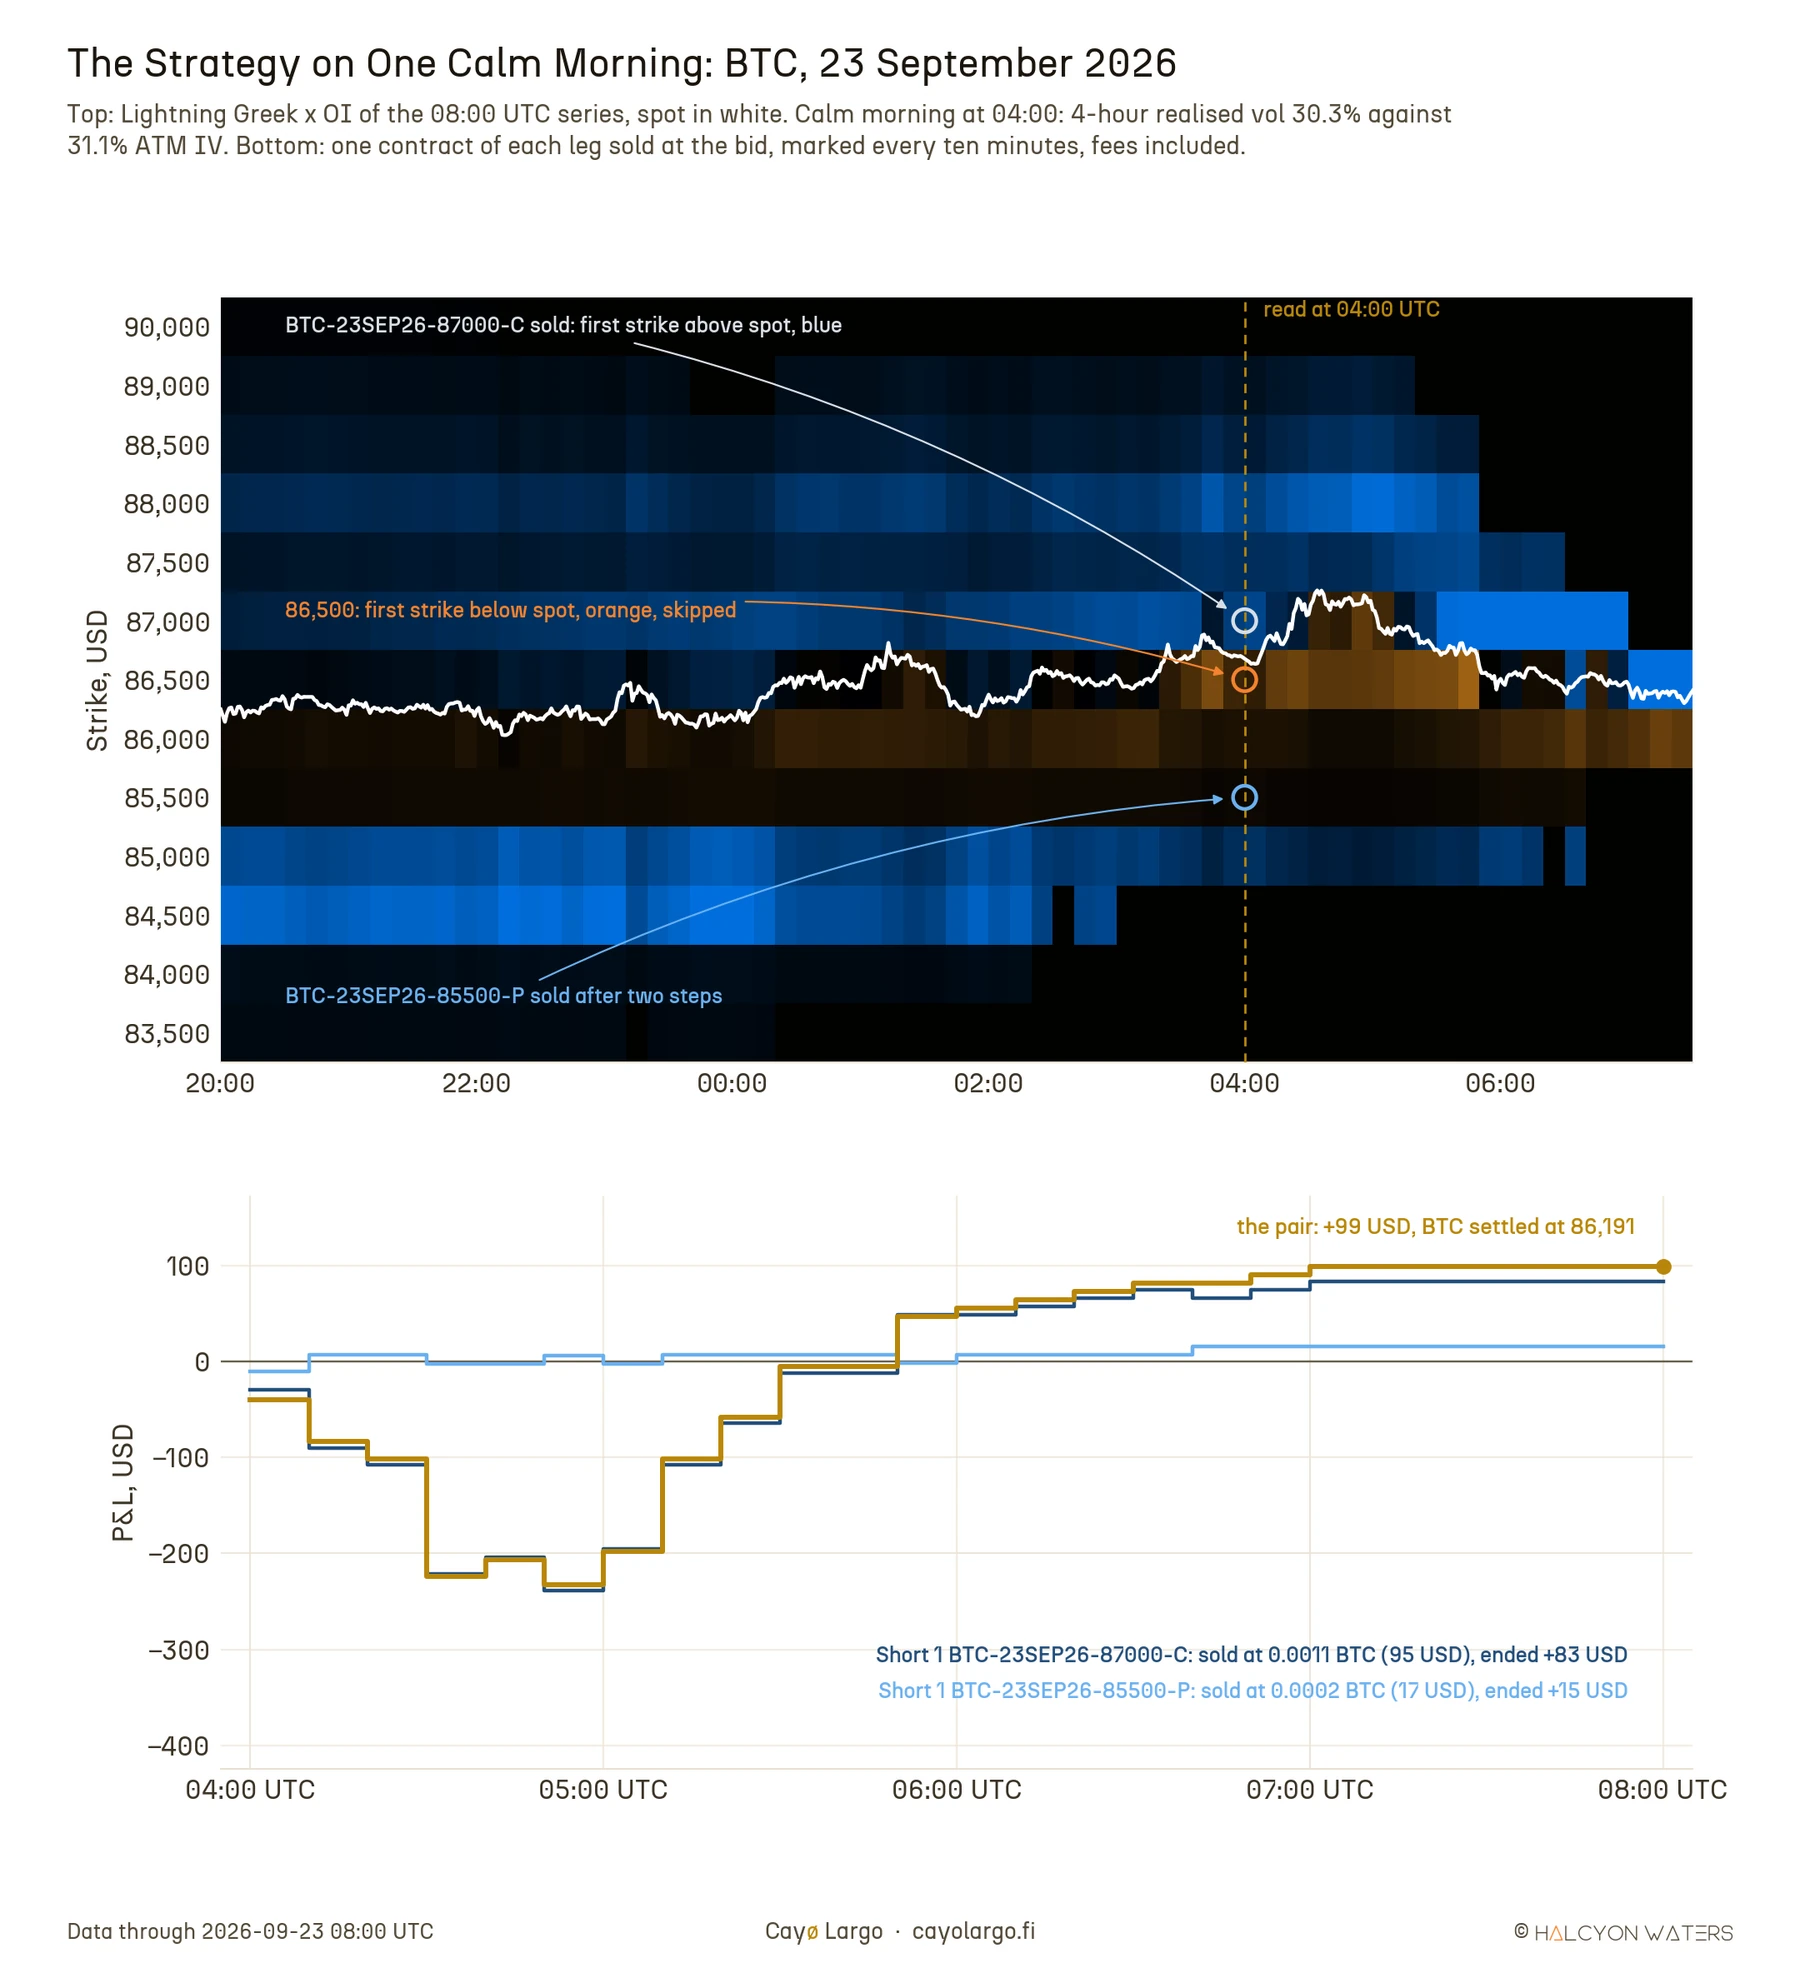
Figure 4: The strategy on 23 September 2026. Each leg is entered at the price the test filled one contract at, marked every ten minutes at Deribit's mark price and closed at settlement, fees included. The map ends at the series' last snapshot, 07:20 UTC.
6. The 04:00 decision across every expiry.
Figure 5 puts every BTC daily expiry of 2026 on one picture, the way a trader meets it at 04:00. Across is the calm check of rule 2, recent realised volatility over implied. Up is how close to spot the nearest strike the rules would sell sat, in units of the move the options priced for the next four hours. Each bubble is what selling that day returned.
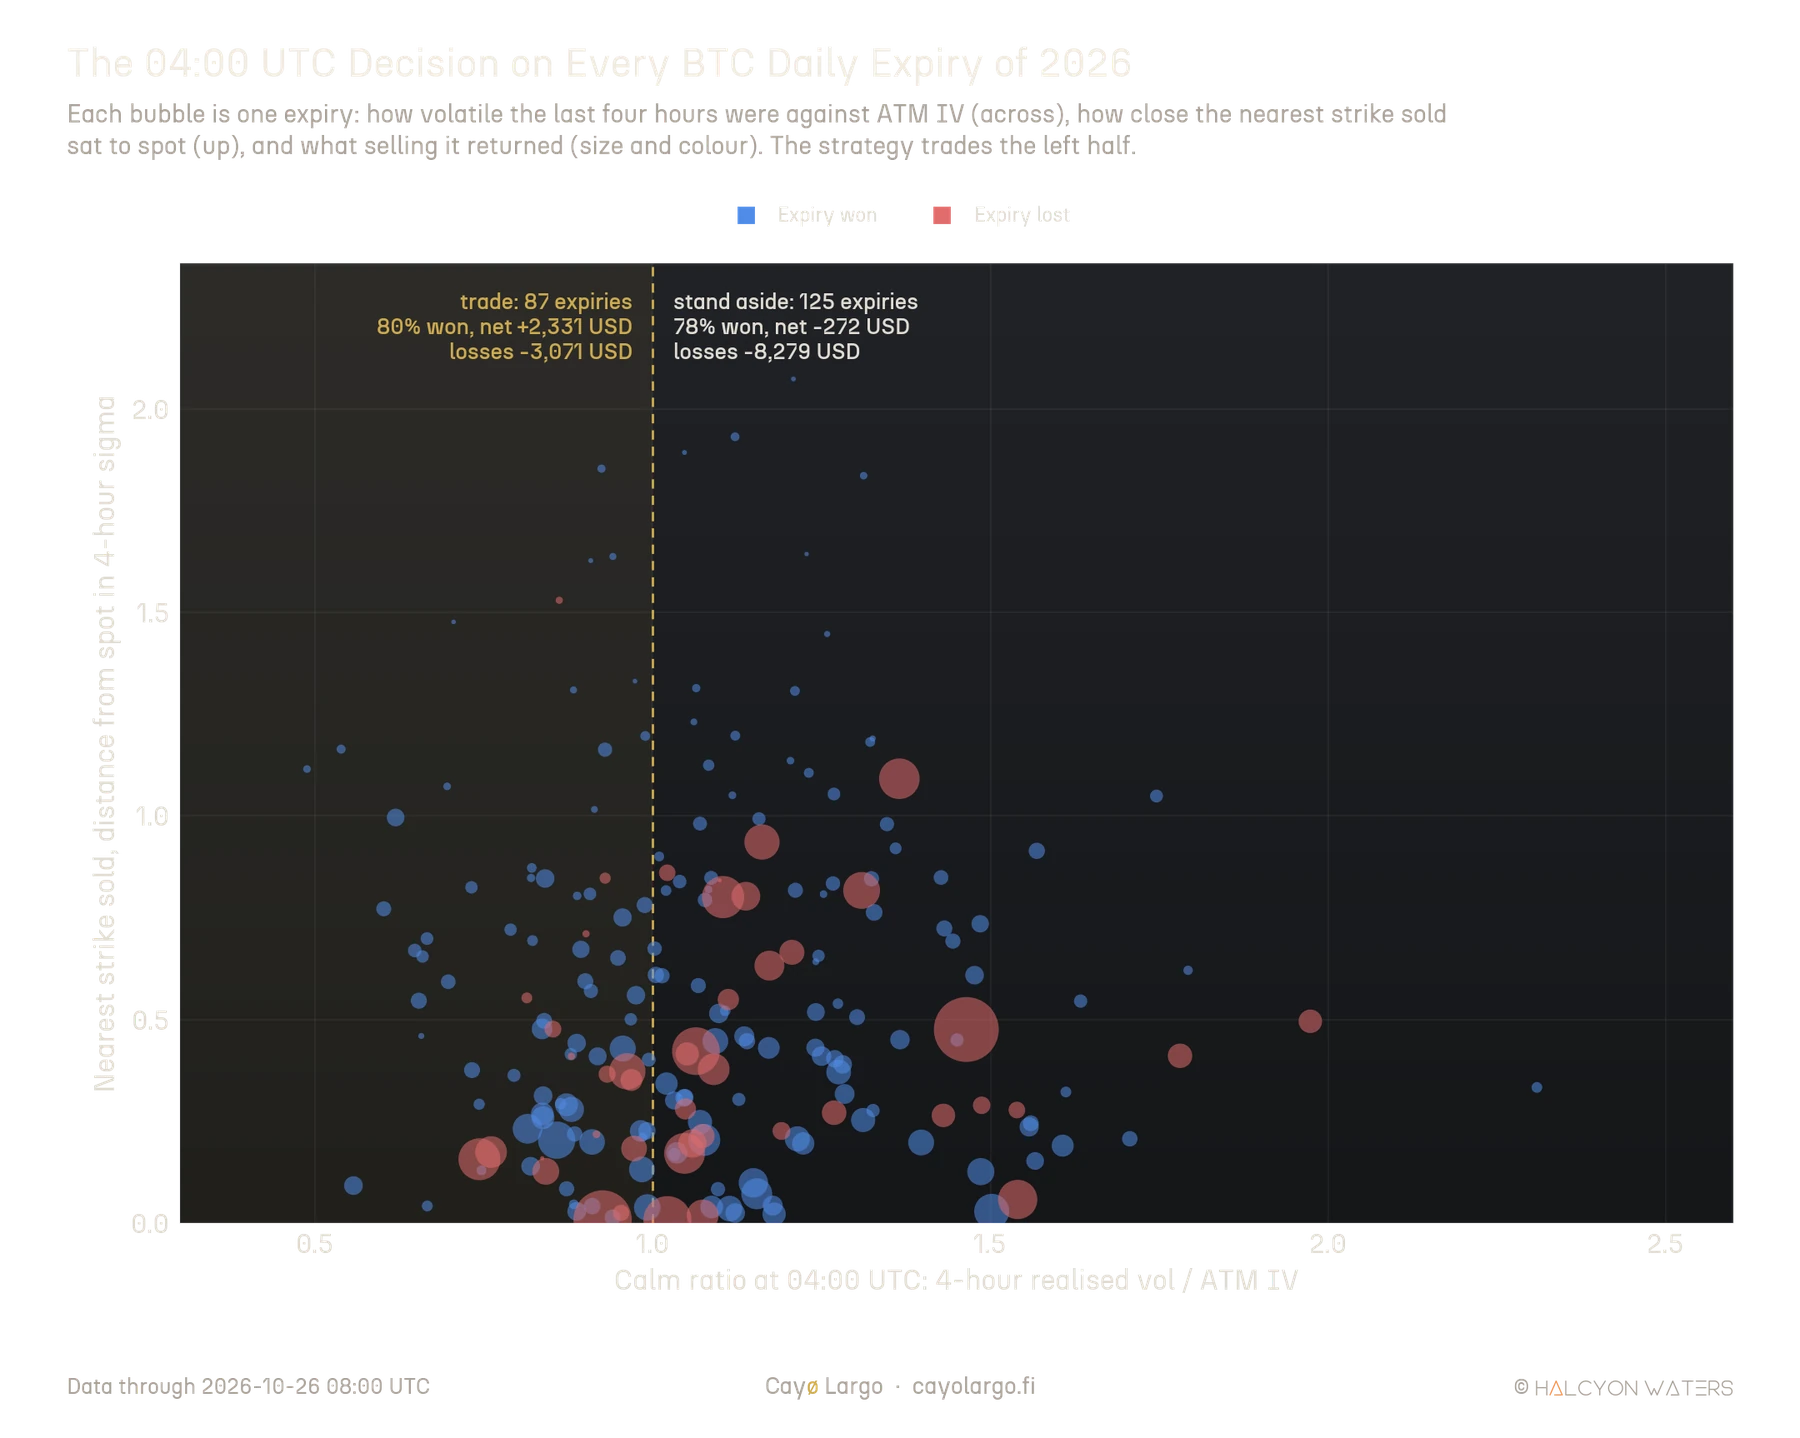
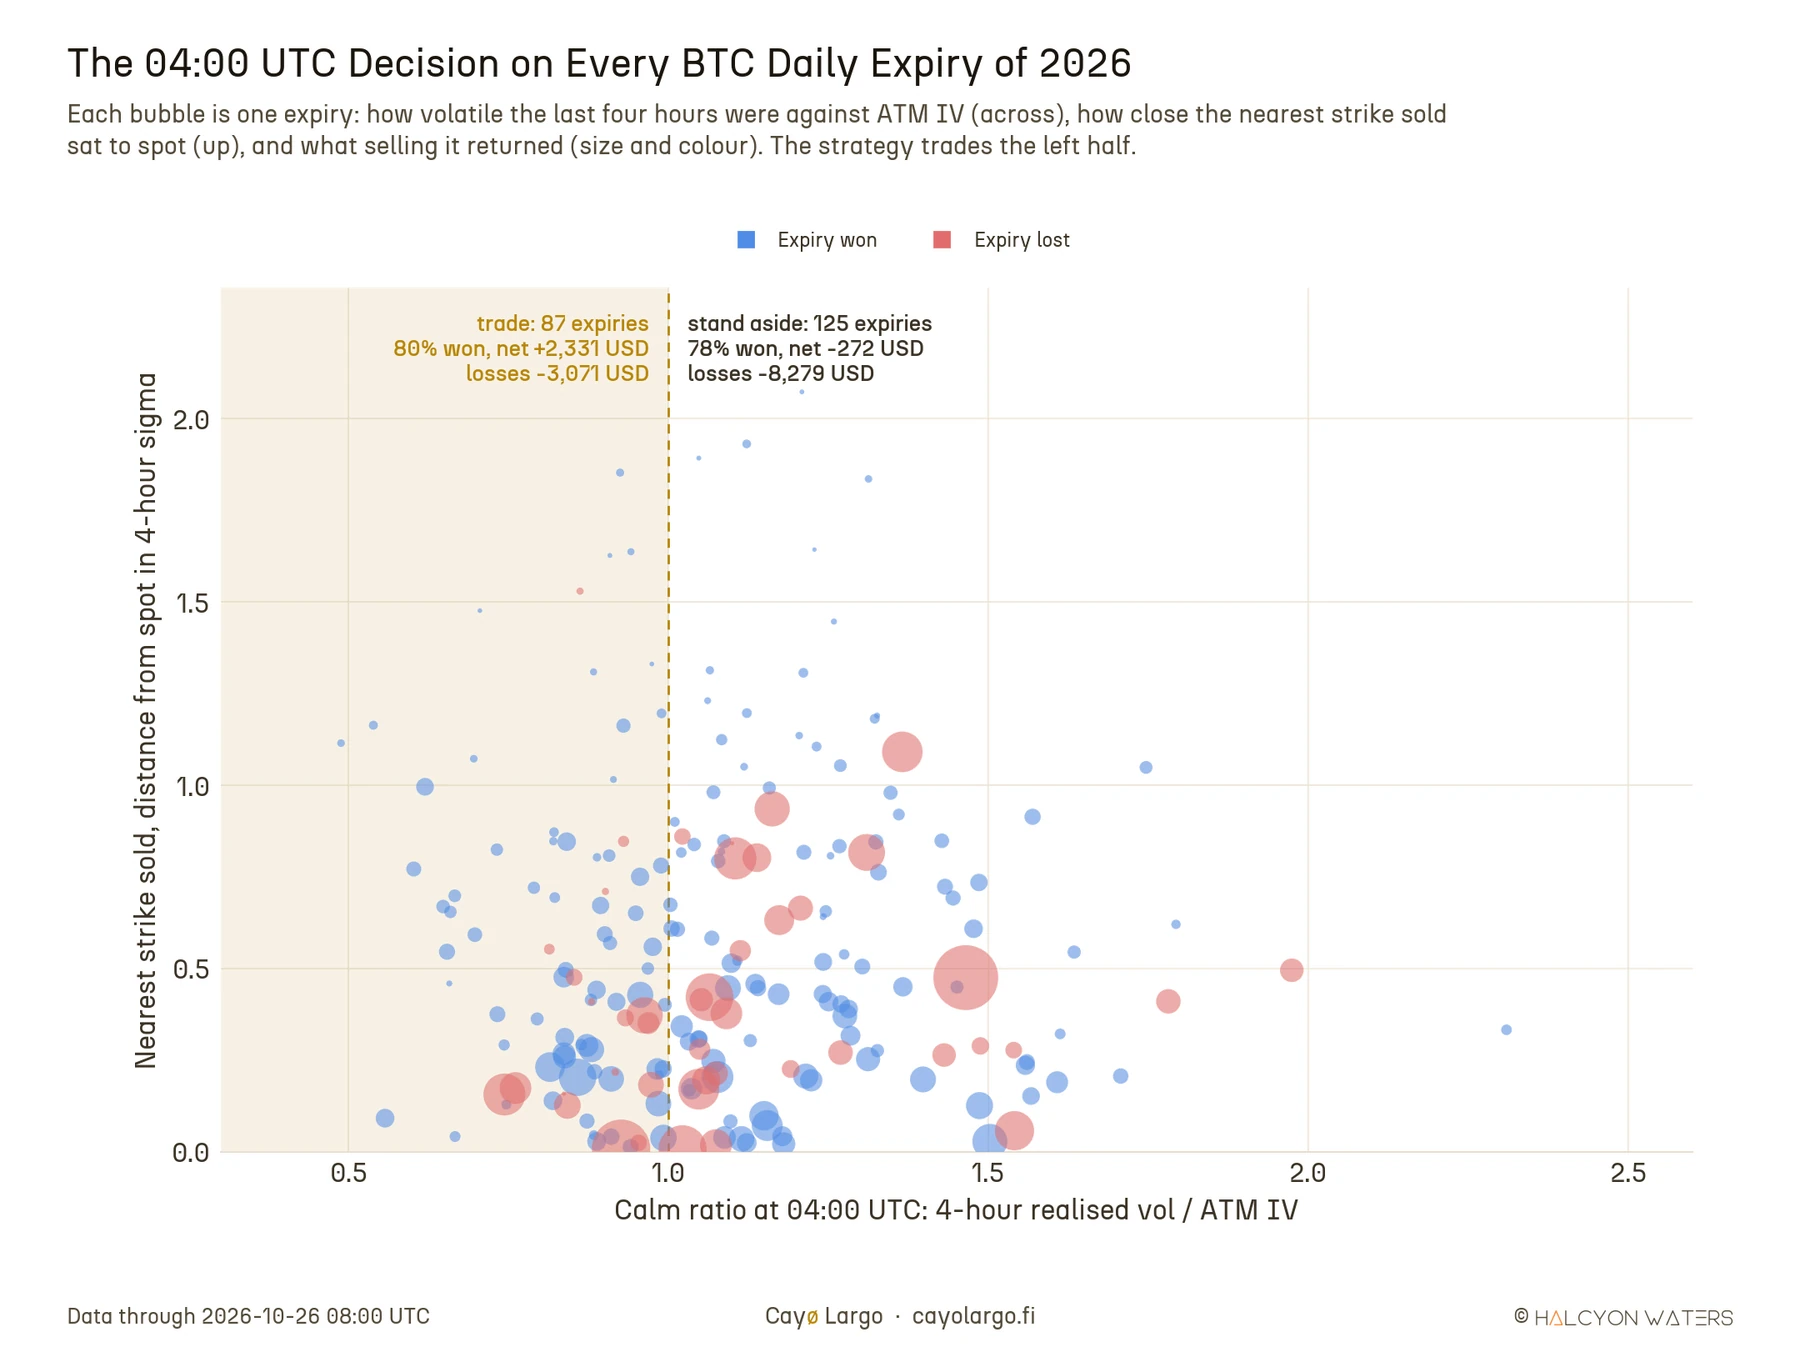
Figure 5: The 04:00 UTC decision on 212 BTC daily expiries. Bubbles show what the Lightning Greek step returned on each day, one contract per leg, fees included. The strategy trades only the shaded half.
The picture explains the strategy better than any table. Hot mornings and calm mornings win about as often, 78% and 80% of days. They do not lose the same way. On the 125 hot mornings the losing days added up to 8,279 USD and swallowed every gain, leaving the seller 272 USD in the red. On the 87 calm mornings the losing days cost 3,071 USD and the strategy finished 2,331 USD ahead. The big red bubbles sit to the right of the line: a morning that is already moving more than the options price tends to keep moving through the strikes sold.
7. How was the backtest built?
The backtest covers the 212 BTC daily expiries from 27 March to 26 October 2026, of which the rules traded 87. Each traded morning sells one Deribit BTC option per leg at 04:00 UTC, filled at the bid by walking the order book as it stood. It holds them to the 08:00 settlement. One contract covers 1 BTC of the underlying. On 65 mornings that meant a call and a put. On the other 22 it meant one leg, because one side had no blue strike with a bid. Deribit's fees are paid on entry and on settlement.
The money sits in a BTC account that opens with 1 BTC. Deribit's BTC options are inverse, with premium, settlement and fees all paid in BTC, so that is the natural unit. Each morning's result is added to the account. A loss that left less than 1 BTC would be topped back up by a deposit before the next morning. Only one leg of a pair can finish in the money, so 1 BTC covers the risk of a morning many times over. Deribit itself asks for less: its standard initial margin for a short option is 10% to 15% of a BTC plus the option's price (Deribit, 2026b), about 0.3 BTC for the pair. Every ratio below is measured on this account.
8. Strategy Backtesting Results (March to October 2026).
We report the results at one contract per leg first, the size every number in this note uses unless stated otherwise, then at two, three and five.
8.1. One contract per leg.
At one contract per leg the rules traded 87 of the 212 mornings, a call and a put on most of them. Figure 6 follows the strategy morning by morning: the running profit and loss above, the result of each traded expiry below.
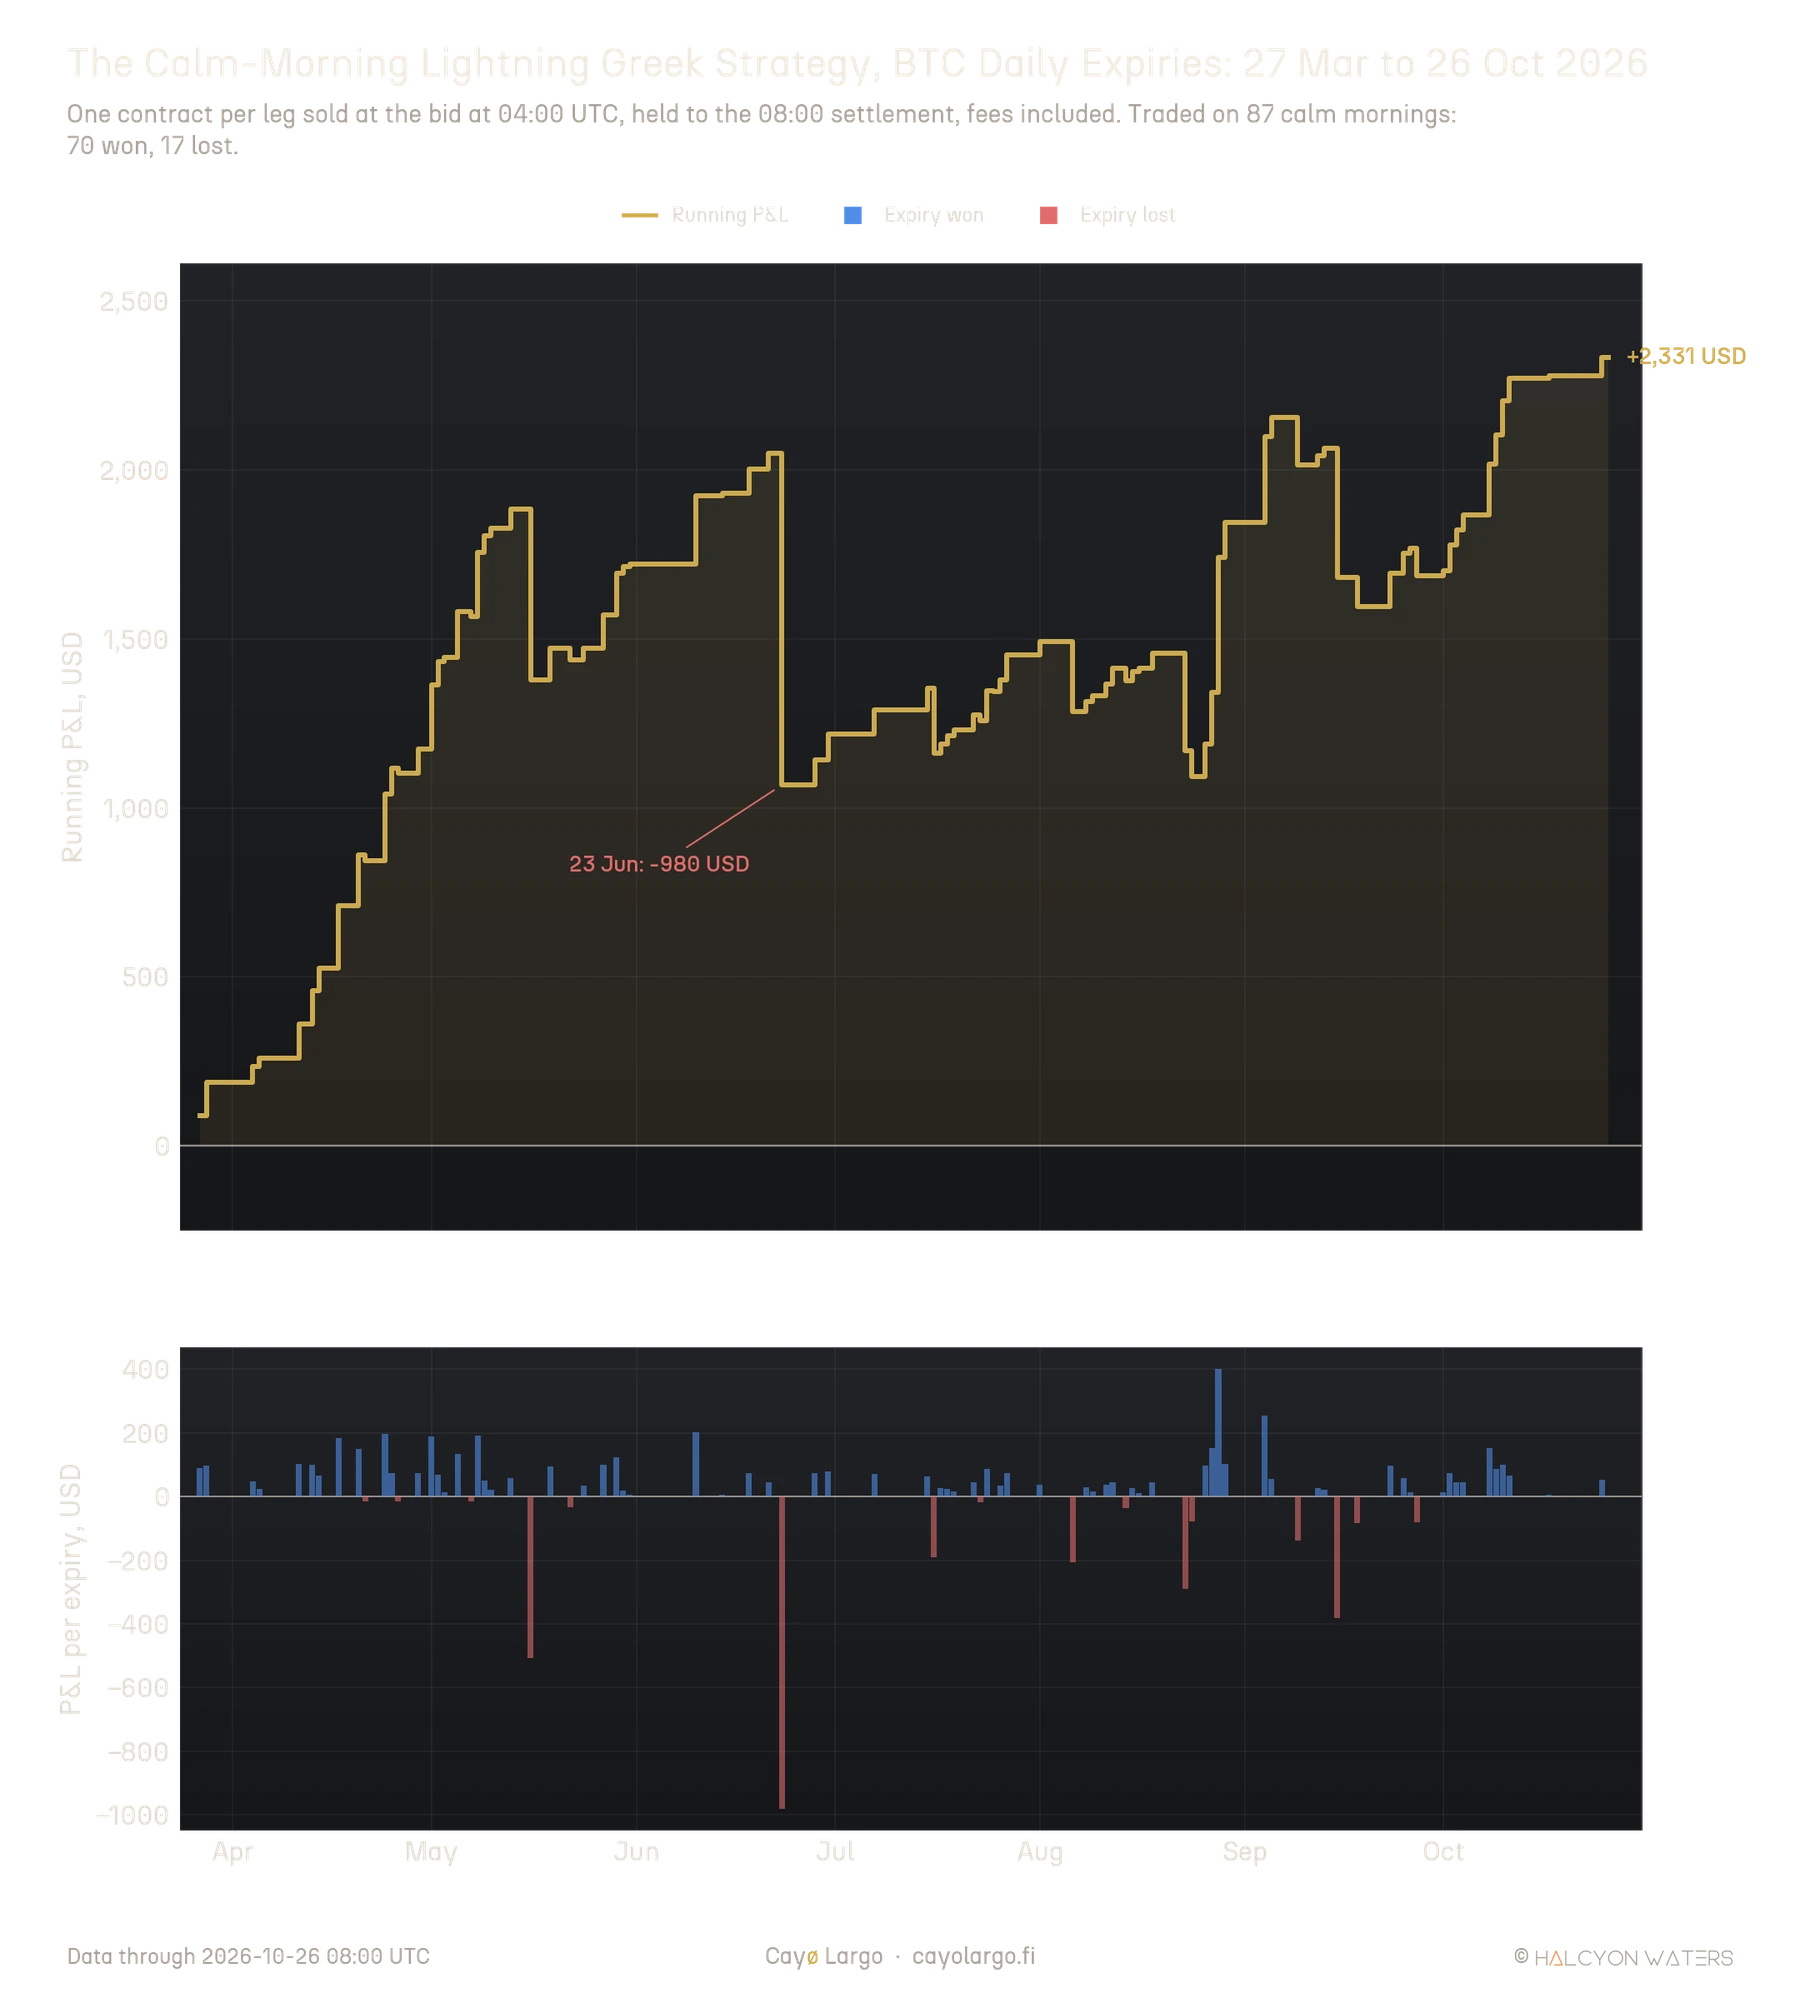
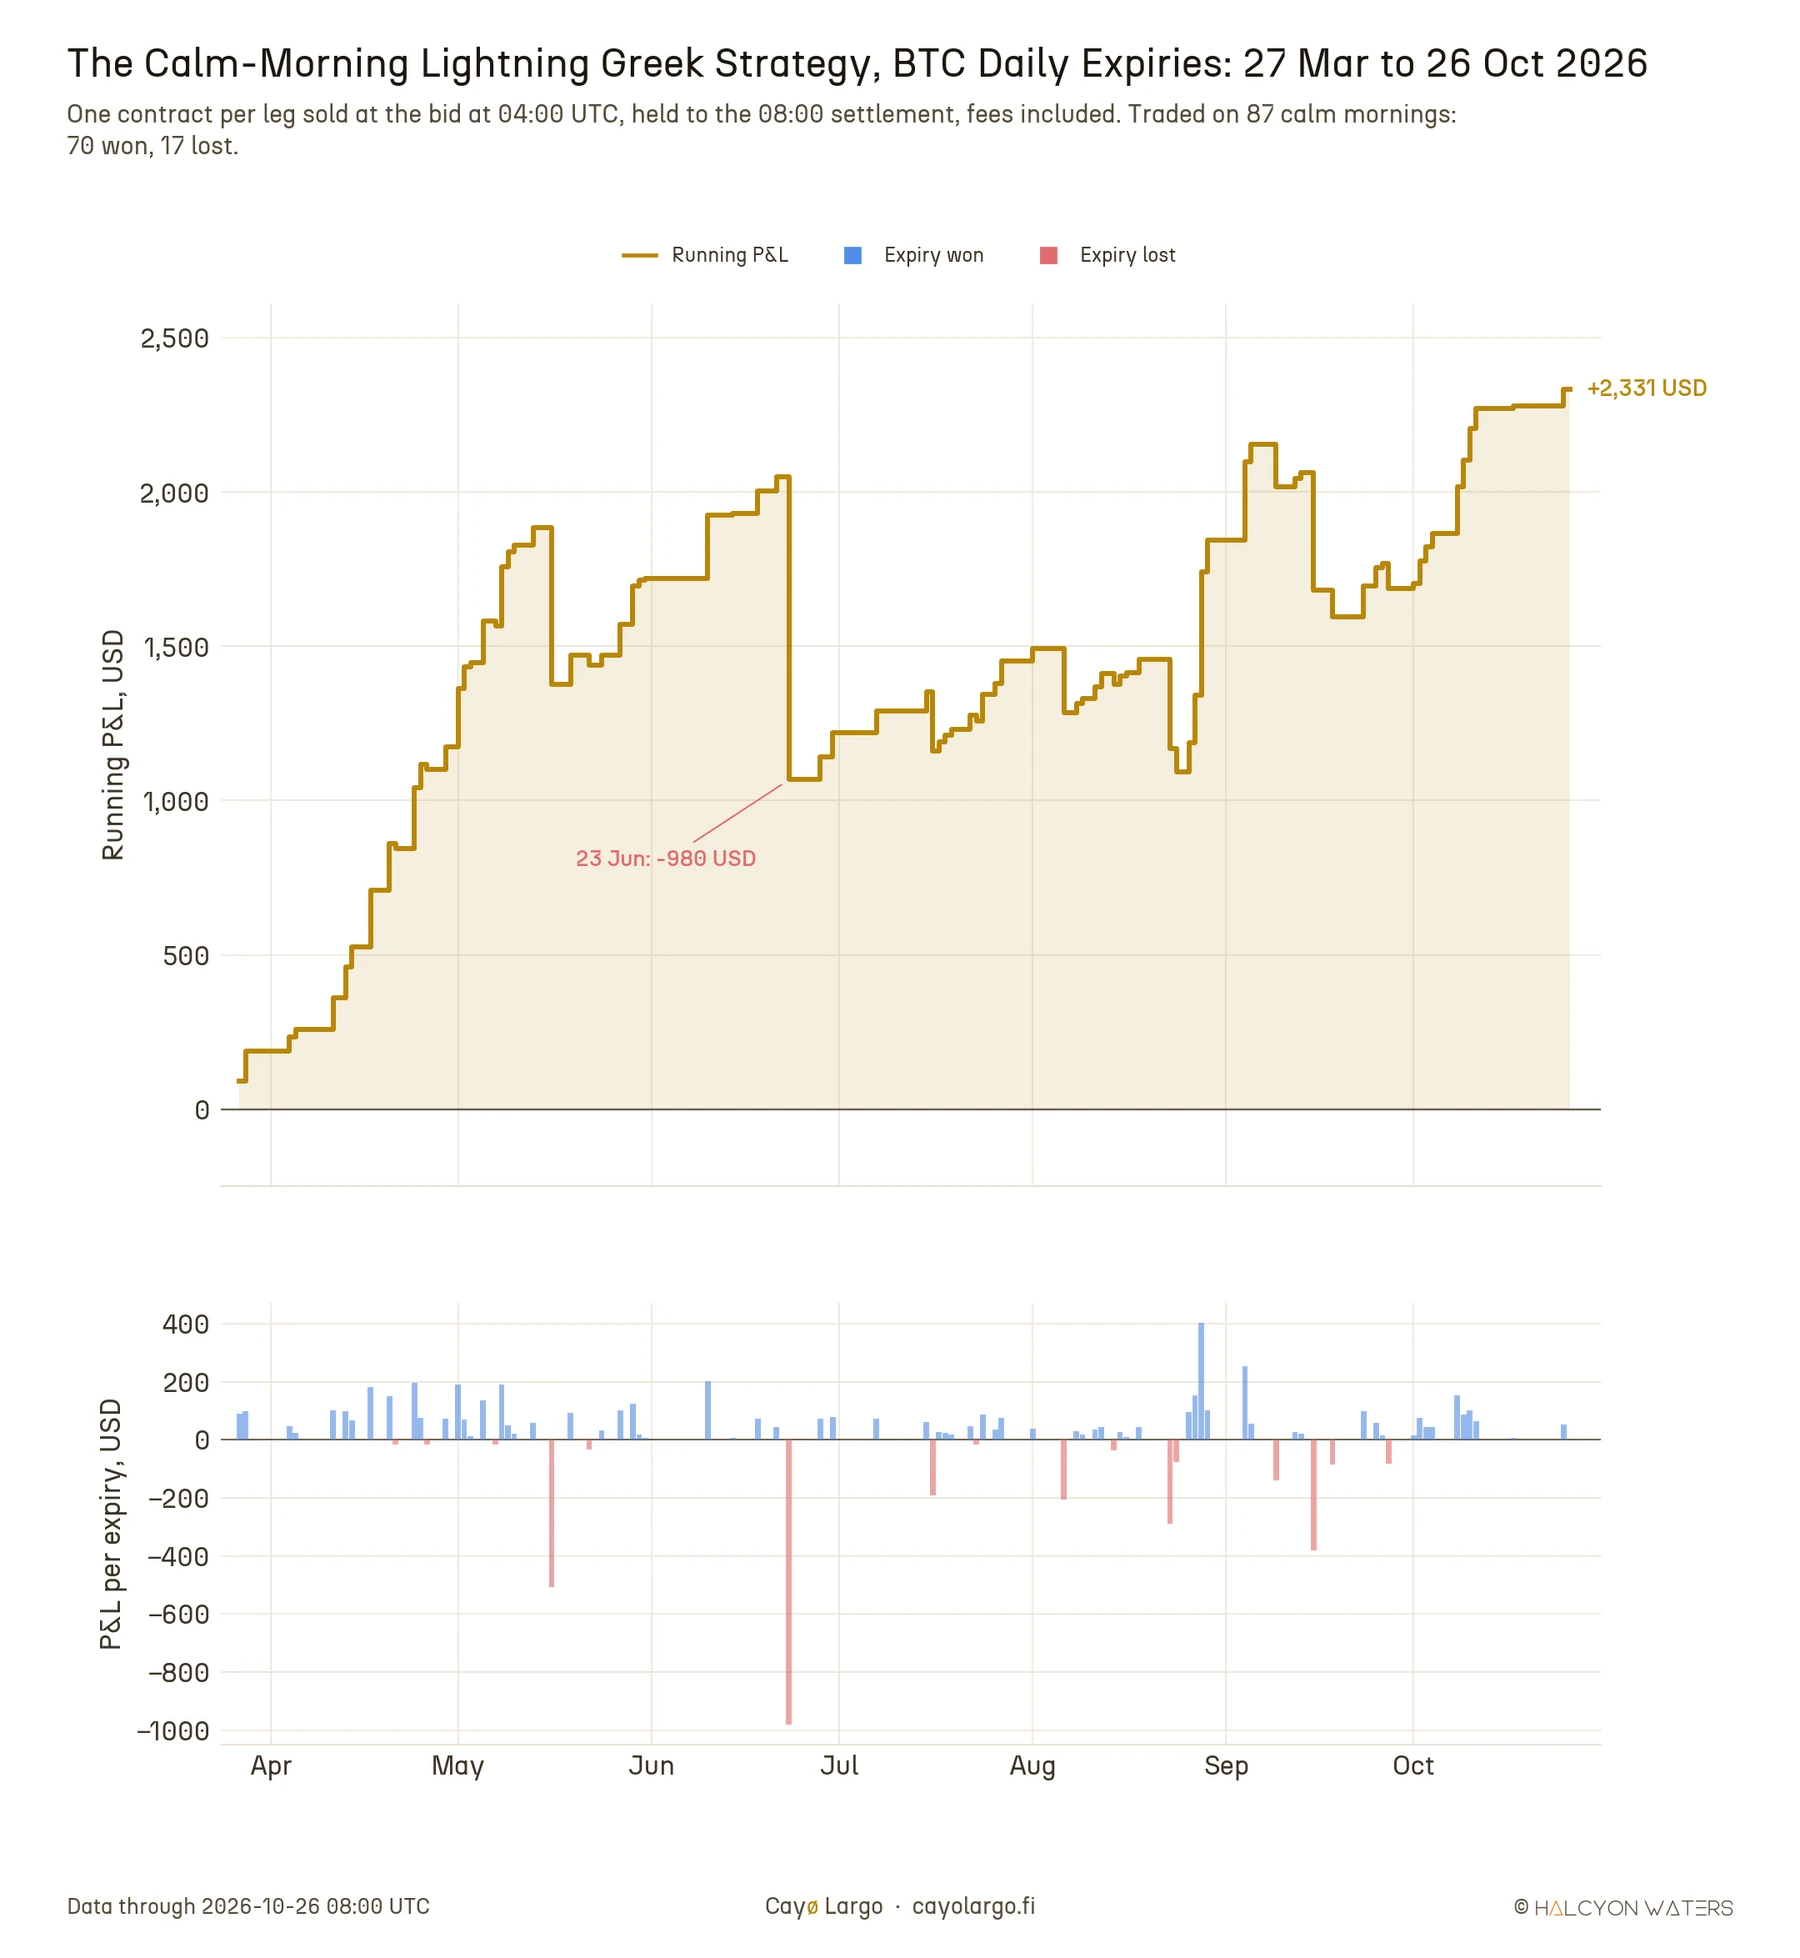
Figure 6: The calm-morning Lightning Greek strategy, BTC daily expiries from 27 March to 26 October 2026: running profit and loss above, each traded expiry below. One contract per leg, fees included.
| BTC, one contract per leg, 27 Mar to 26 Oct 2026 | Calm-morning Lightning Greek strategy |
|---|---|
| Expiries traded | 87 of 212 |
| Total P&L | +2,331 USD, +0.0292 BTC |
| Premium collected | 8,541 USD |
| Expiries won | 70 of 87, 80% |
| Worst expiry | -980 USD, 23 June |
| Worst drawdown | -980 USD |
| Deposits to keep 1 BTC in the account | none |
| Months in profit | 6 of 8 |
The strategy made 2,331 USD on one contract per leg, won 70 of its 87 expiries and never fell more than 980 USD below its previous high. It kept 27% of the 8,541 USD of premium it collected. April was the best month at +986 USD. June and September closed in the red, at -501 and -156 USD.
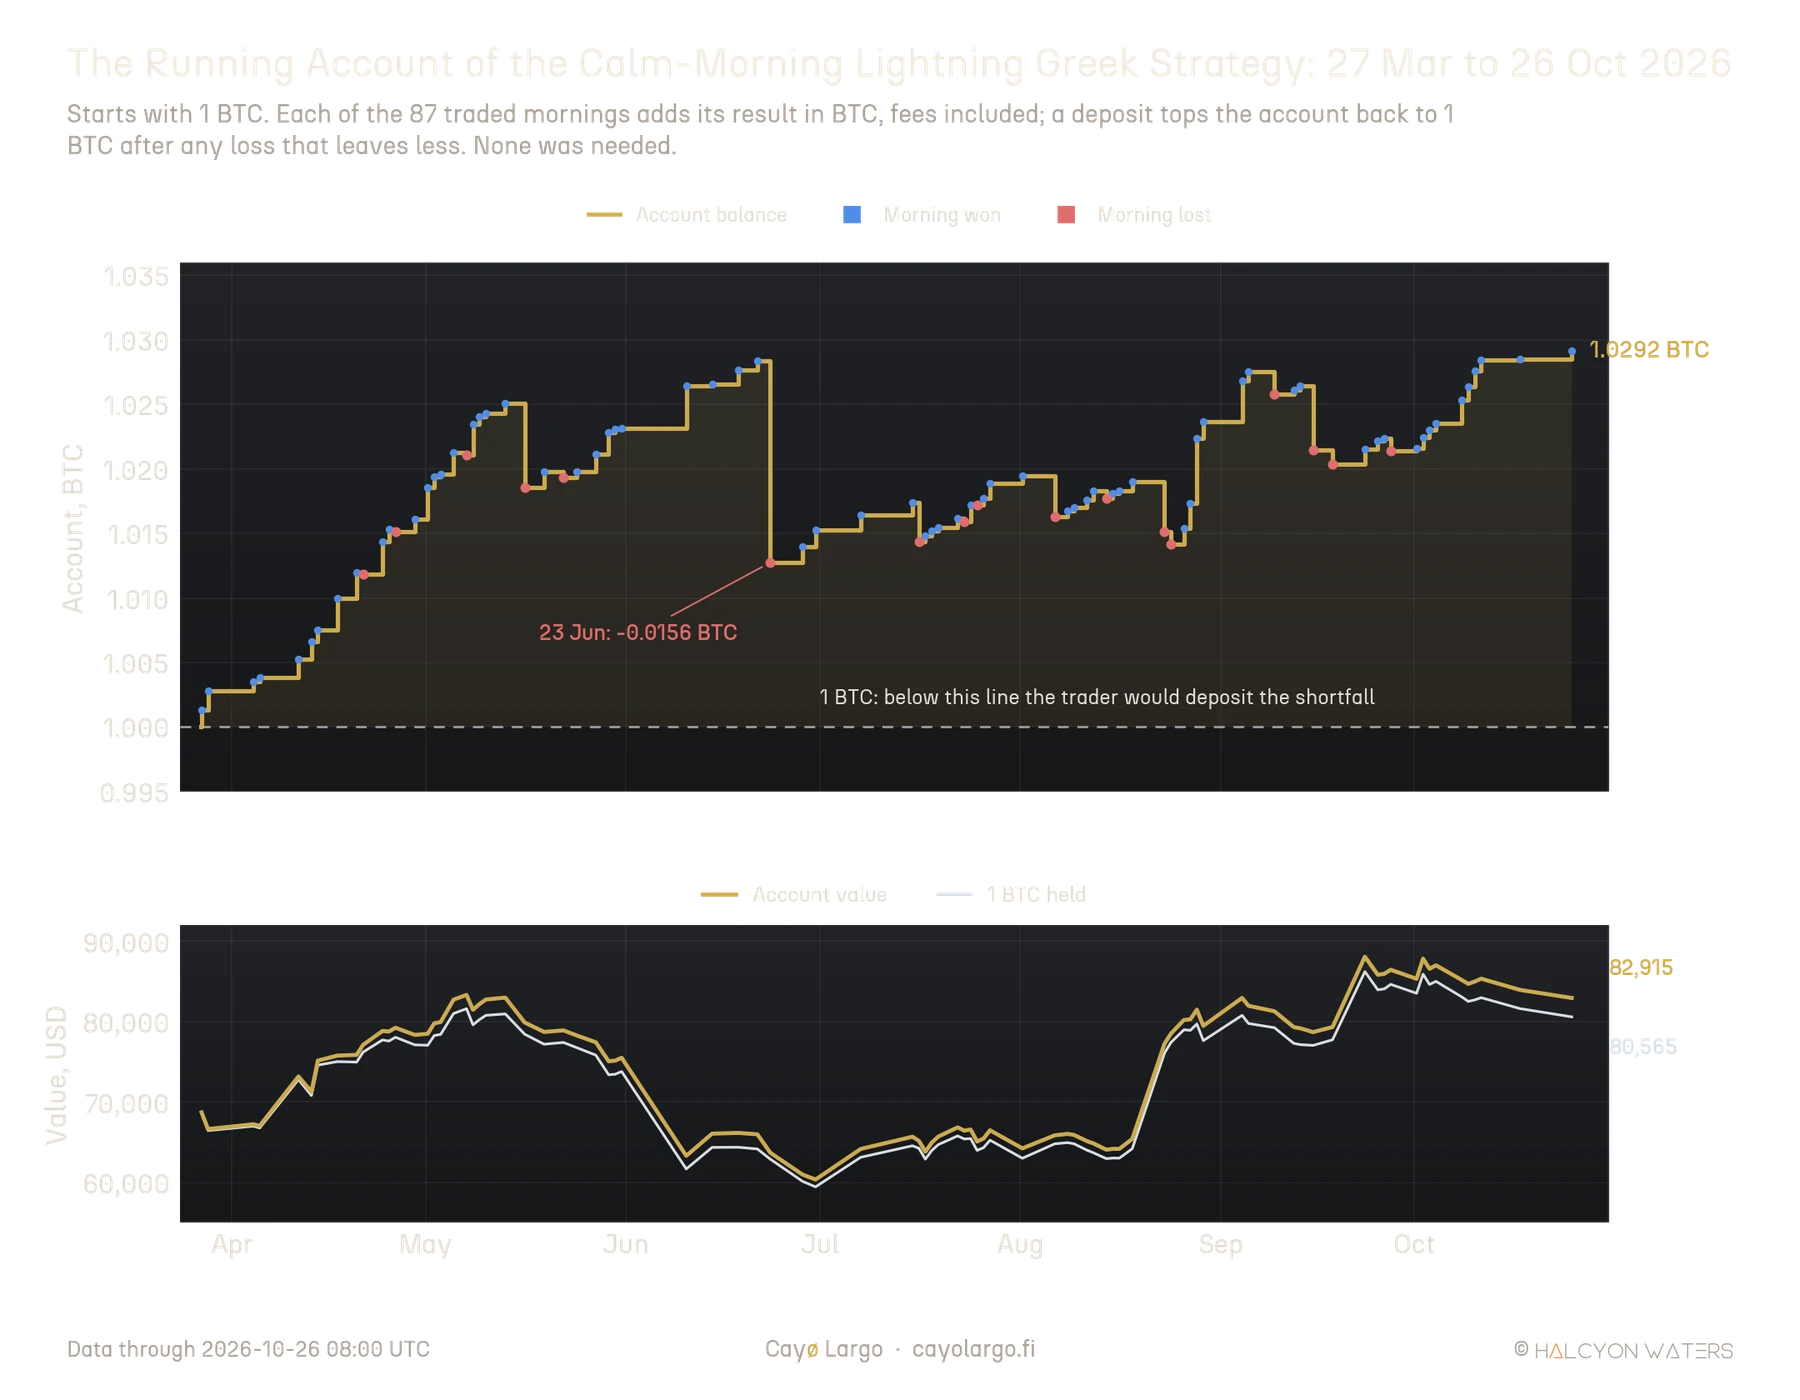
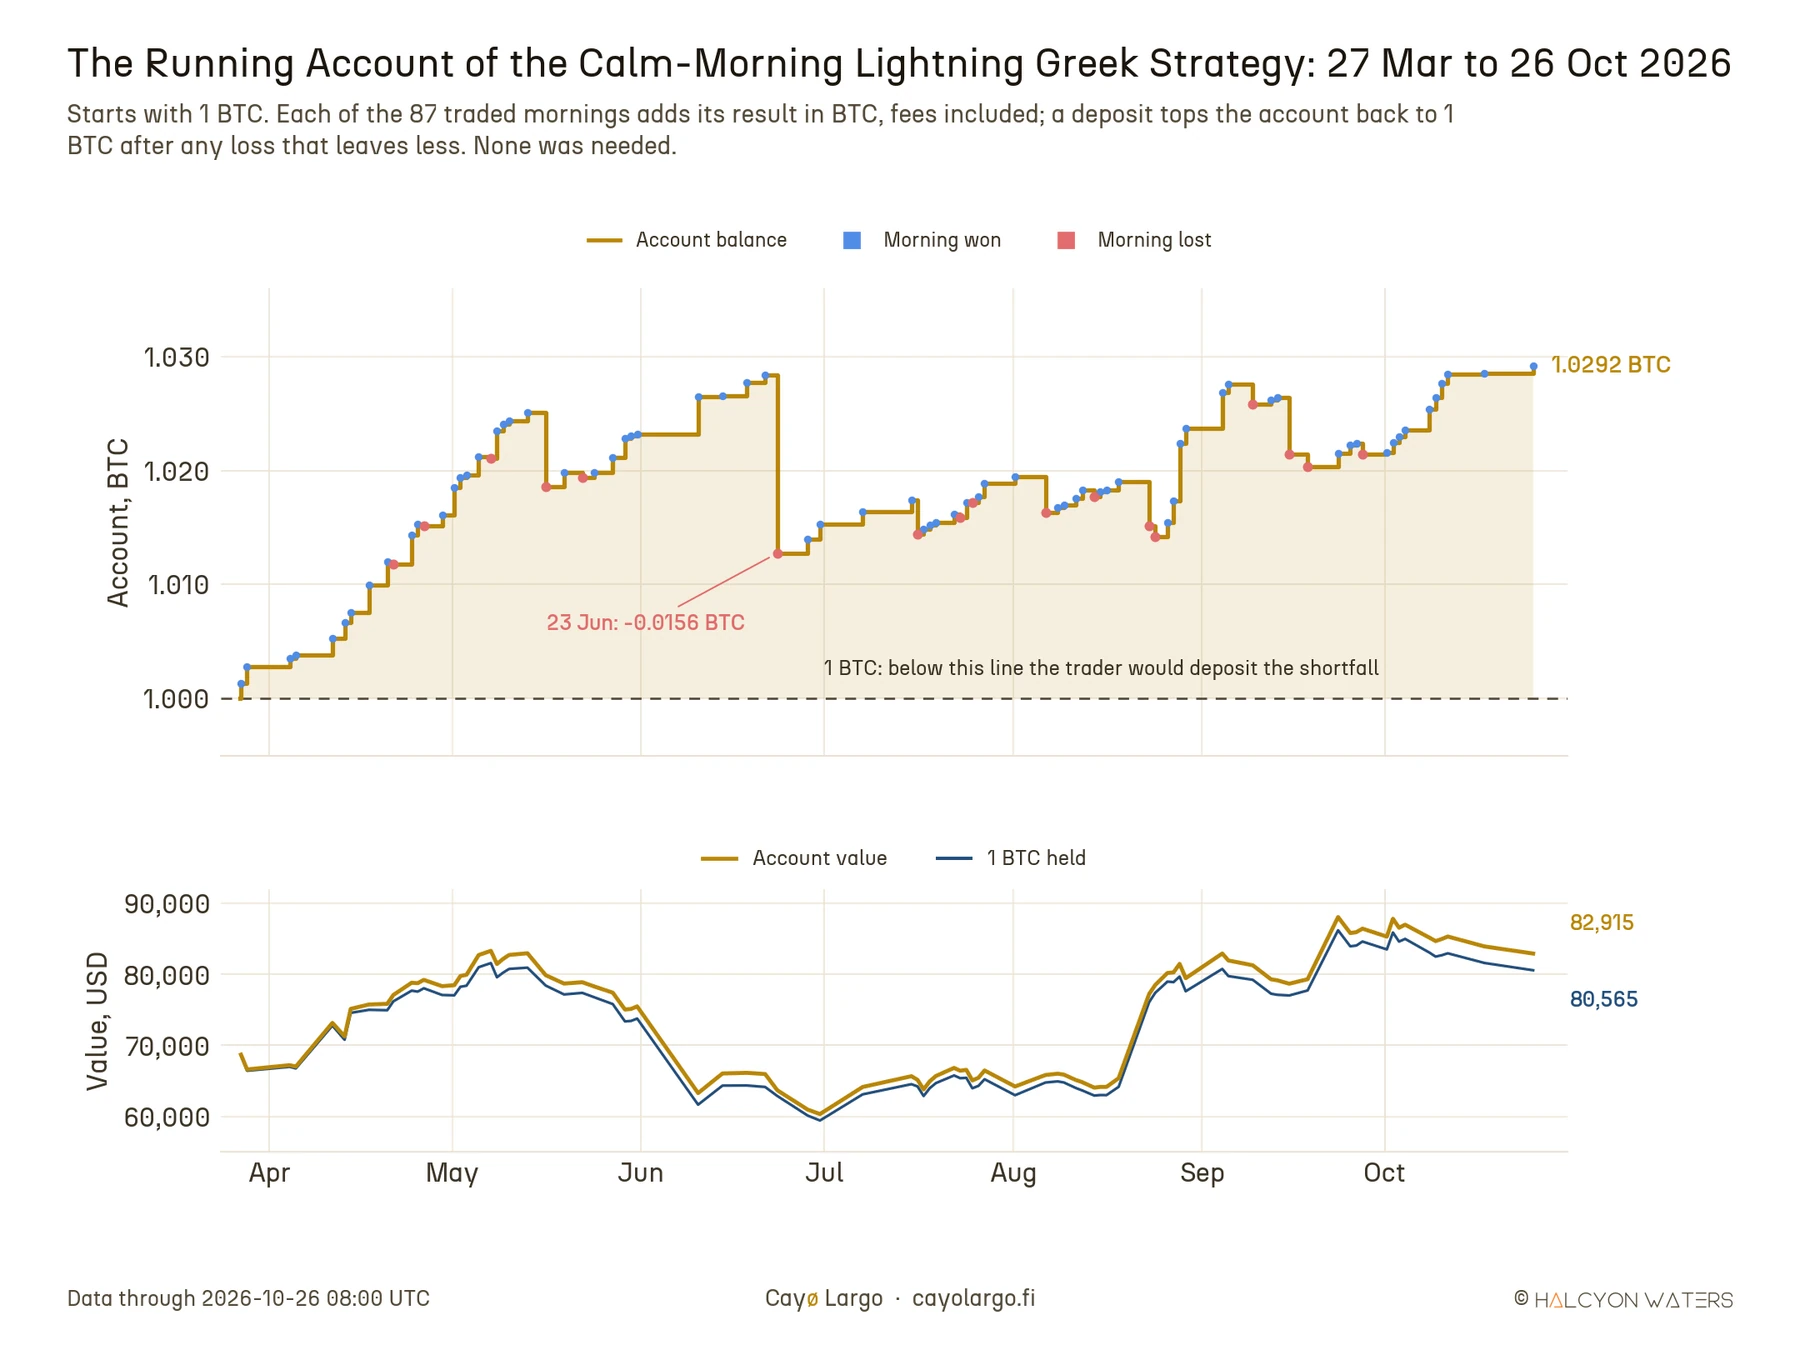
Figure 7: The strategy's running account in BTC, 27 March to 26 October 2026. It opens with 1 BTC, each traded morning adds its result in BTC after fees and a deposit would top it back to 1 BTC after any loss that left less. Below, the account's value in USD against holding the same 1 BTC.
No deposit was ever needed. The first morning won and the balance never came back down to 1 BTC. Its deepest fall from a high came on 23 June, 0.0156 BTC. The profits of April and May absorbed it with room to spare. On 26 October the account held 1.0292 BTC, a gain of 2.92% in BTC over seven months, about 5% a year.
The lower panel shows what a BTC account carries besides the strategy. One BTC was worth 68,608 USD at the first settlement and 80,565 USD at the last, while the account ended at 82,915 USD. The strategy's part is the gap between the two lines, about 2,350 USD. The rest is BTC's own move, in either direction. A desk that wants the premium without that exposure has to hedge the collateral, which this test does not do.
A backtest is usually judged on a handful of ratios. Each one below is computed on the 1 BTC account, with the account's return on calendar day (zero on the mornings the rules stand aside), no risk-free rate since the account is held in BTC and a 365-day year:
The Sharpe ratio divides the average return by its volatility (Sharpe, 1994). The Sortino ratio divides it by the downside alone, so the days that win cost it nothing (Sortino and van der Meer, 1991). The Calmar ratio divides the annual return by the deepest drawdown.
| 1 BTC account, 27 Mar to 26 Oct 2026 | Strategy |
|---|---|
| Annual return, in BTC | +5.0% |
| Annual volatility | 2.8% |
| Sharpe ratio | 1.77 |
| Sortino ratio | 2.07 |
| Maximum drawdown | -1.5% |
| Calmar ratio | 3.31 |
| Longest time below a previous high | 110 days |
| Profit factor | 1.67 |
| Average win over average loss | 0.41 |
| Expected shortfall, worst 5% of mornings | -0.0068 BTC |
| Skew of morning results | -4.1 |
| Probability the true Sharpe ratio is above zero | 85% |
The strategy's Sharpe ratio is 1.77 and its Sortino ratio 2.07. Its profit factor, what the winning mornings made over what the losing ones lost, is 1.67.
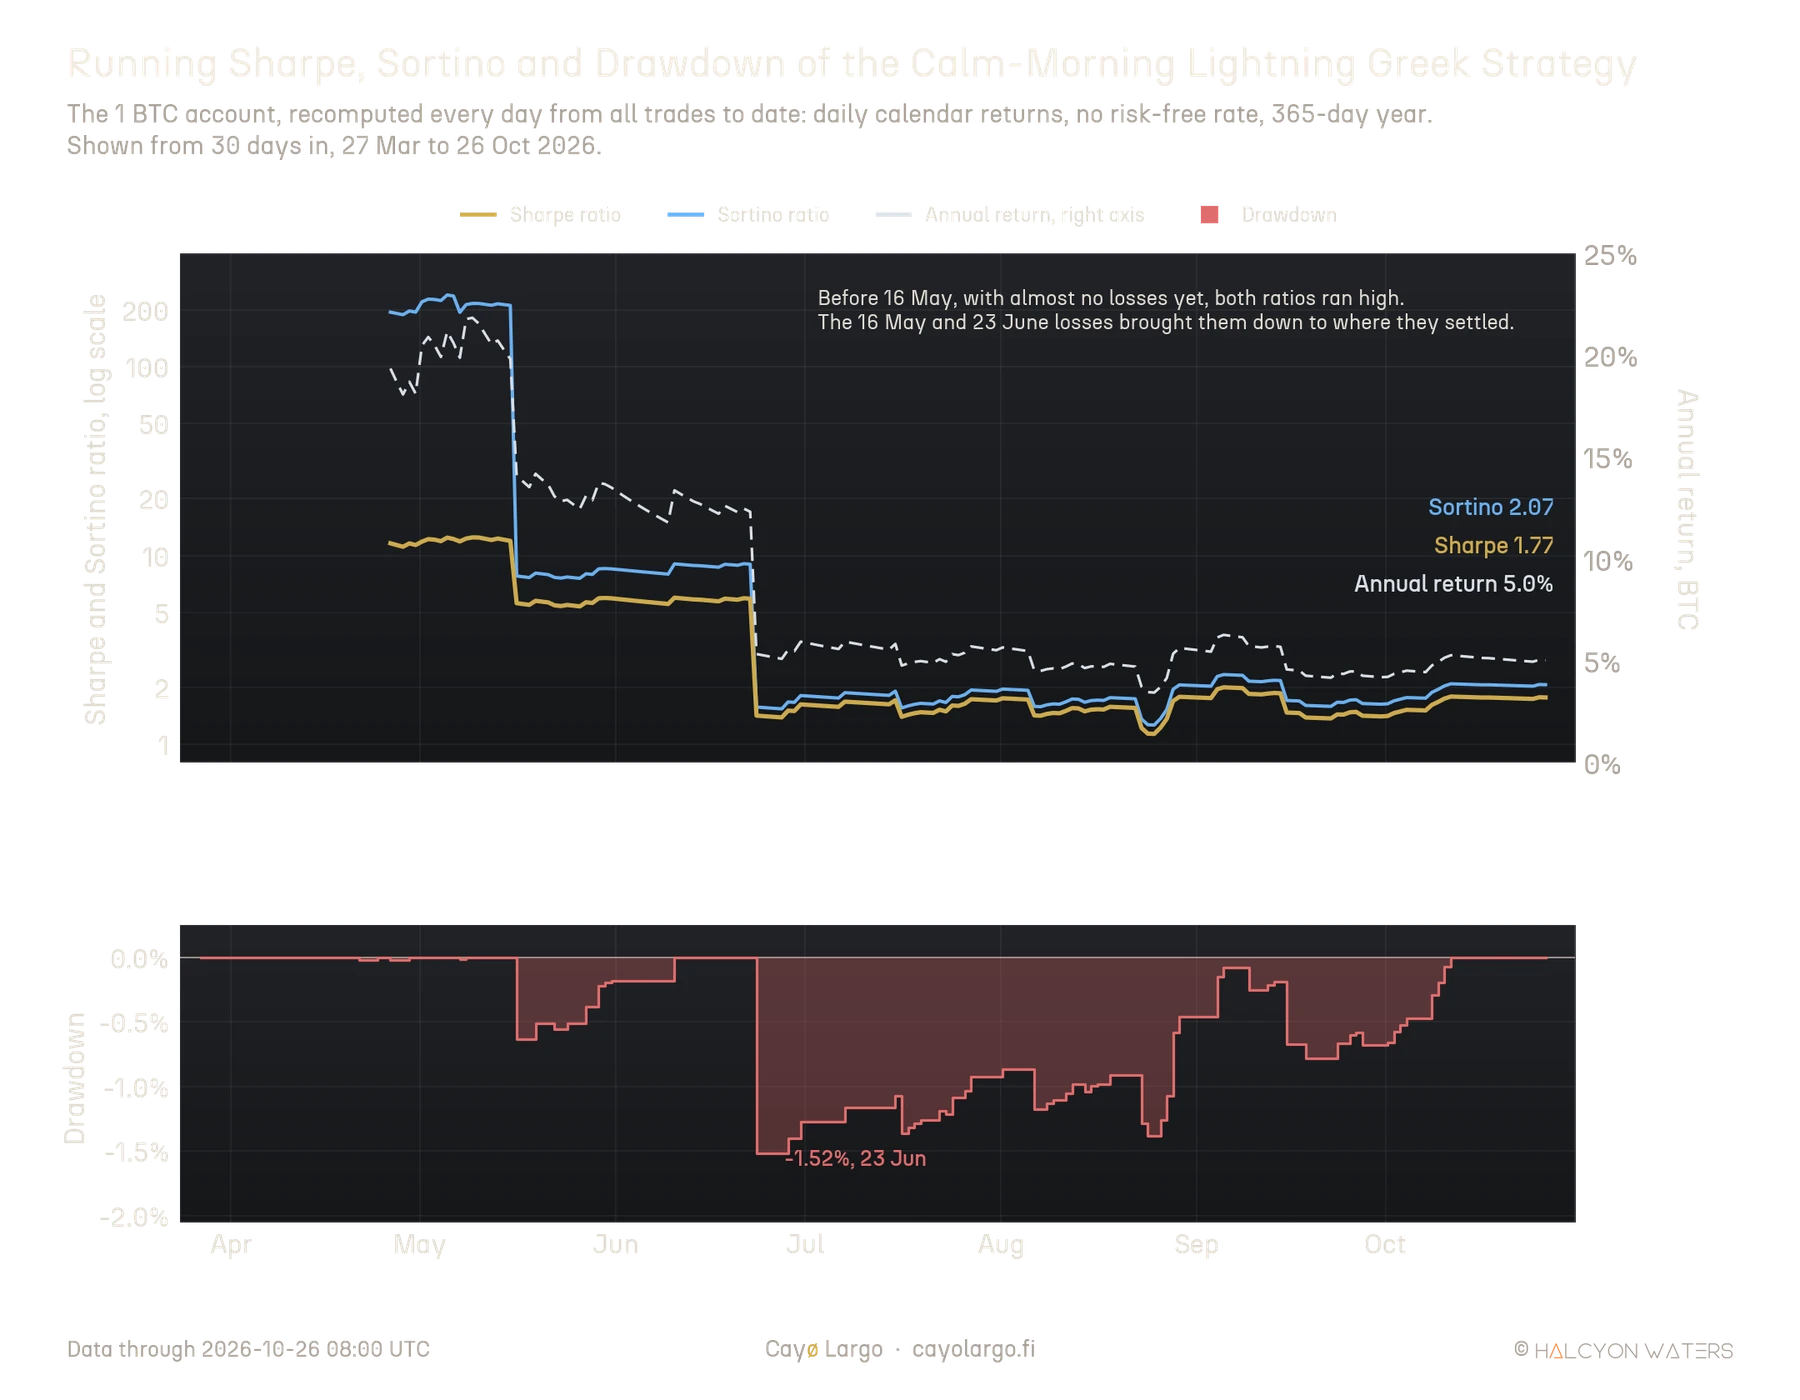
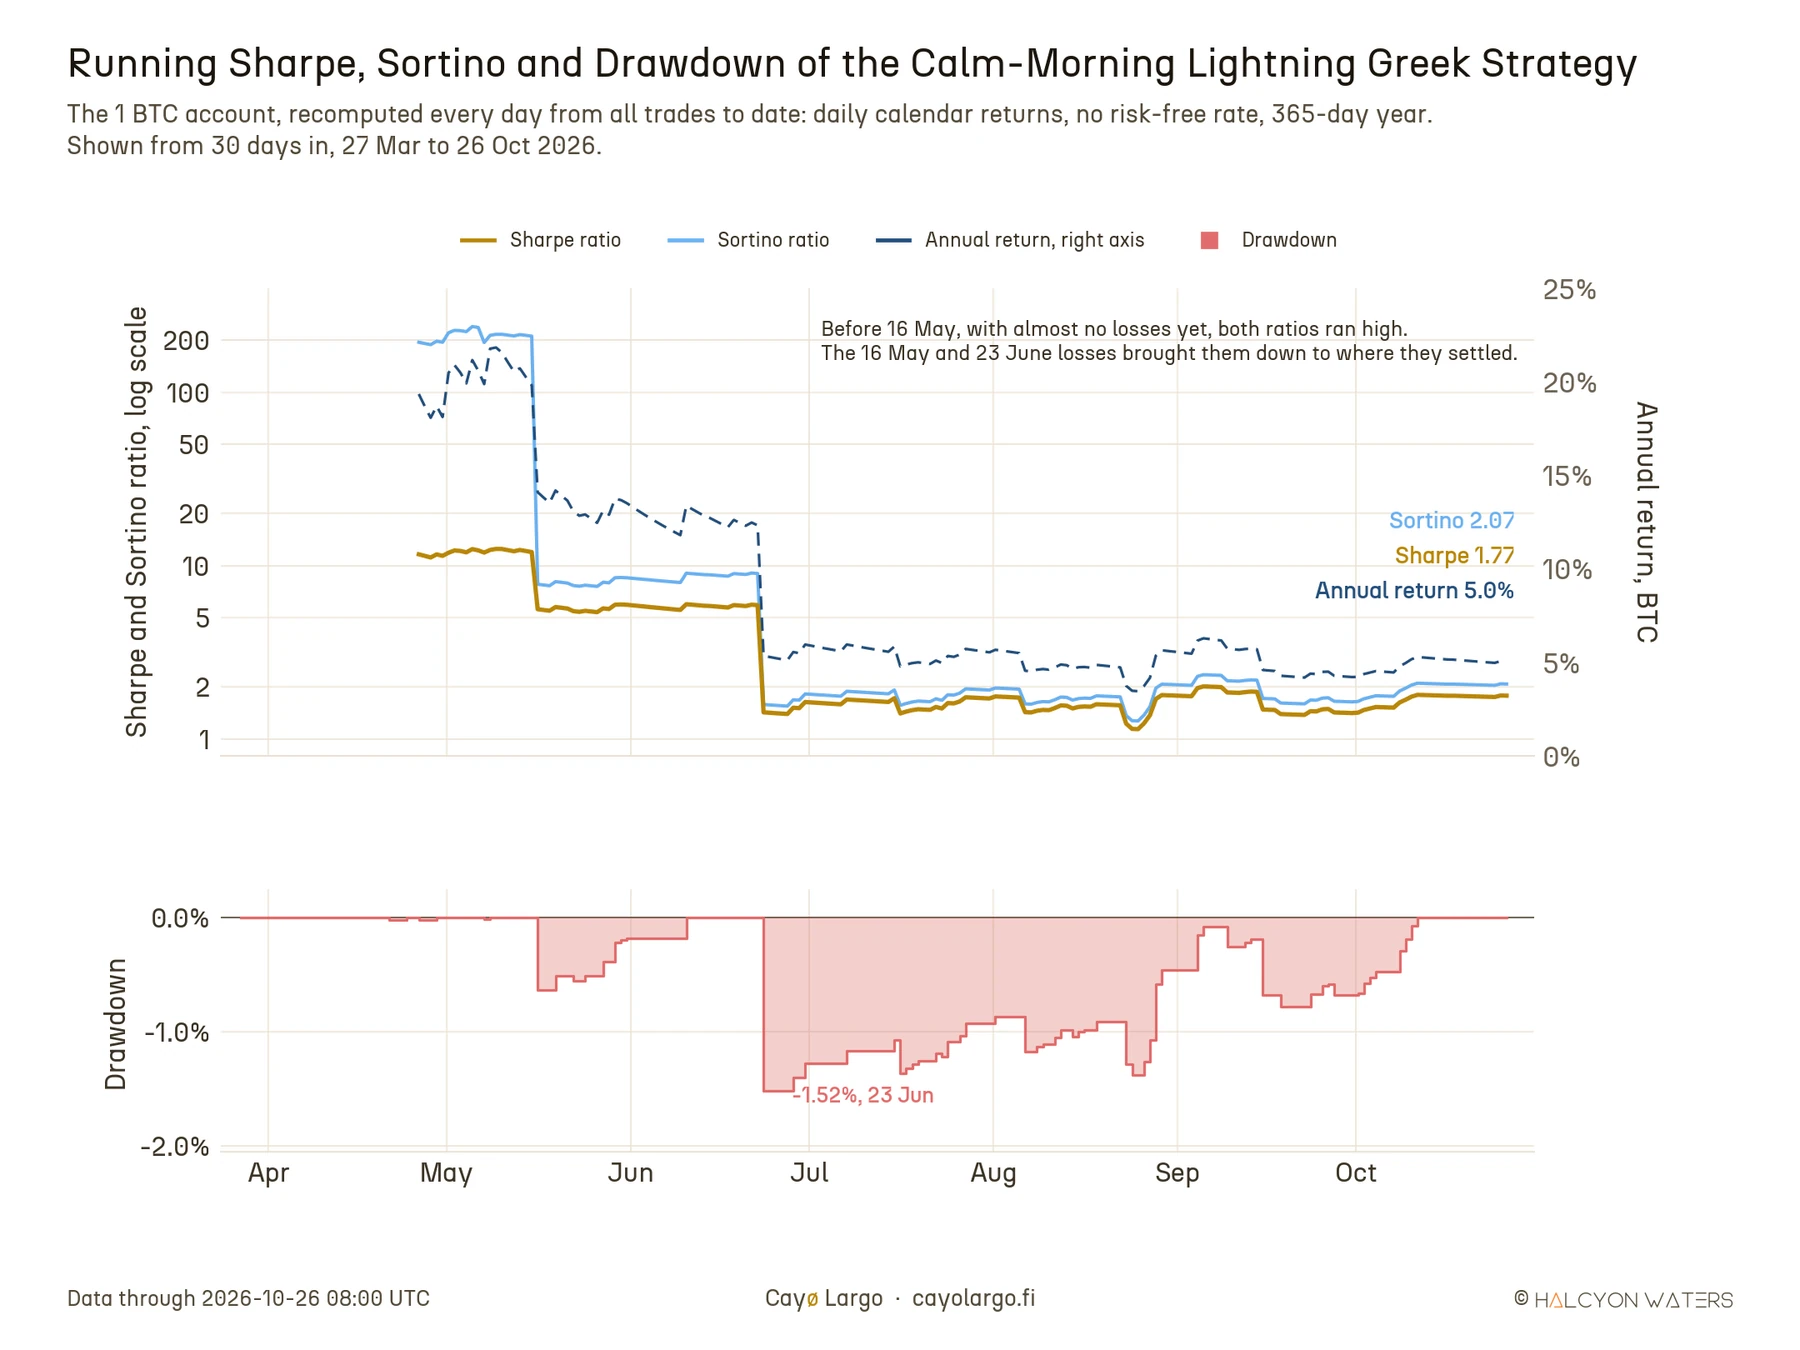
Figure 8: The strategy's Sharpe and Sortino ratios recomputed every day from all trades to date, on a log scale, with the annual return on the right axis, and the running drawdown of the 1 BTC account below. Daily calendar returns, no risk-free rate, 365-day year, shown from 30 days in.
Figure 8 shows how the ratios got there. Recomputed every day from the trades to date, the Sharpe ratio started near 12 and the Sortino ratio near 200. In the first seven weeks there was almost nothing on the downside to measure. The 16 May loss brought the Sharpe ratio to about 6. The 23 June loss brought both to about 1.5. From July they held between 1.1 and 2.3 while the annual return settled between 3.4% and 6.3%. A backtest ratio means little until the strategy has had its bad mornings. This one needed two of them to find its level. The drawdown below tells the same story from the other side. It was never deeper than 1.52% and the account was back at a new high on 11 October.
An options seller should read these ratios with care. A strategy that collects small premiums most days and pays a large loss now and then can show a high Sharpe ratio for a long time before the loss arrives, which is why selling options is the textbook way to flatter one (Goetzmann et al., 2007). The skew of the strategy's mornings, -4.1, is that shape in a single number. An average win is 0.41 of an average loss, so the strategy lives on winning four mornings in five. The worst 5% of mornings lost 0.0068 BTC on average, the expected shortfall a risk desk would size the account on. Seven months is also a short record for returns this skewed. The probabilistic Sharpe ratio corrects the estimate for its own skew and fat tails. It puts the probability that the strategy's true Sharpe ratio is above zero at 85% (Bailey and López de Prado, 2012). That is encouraging, not settled.
The calm check earned its place on data it had not seen. We chose it on February to June and ran it unchanged on July to October. There it cut the losing days' total by 73% against the same rules without the calm check, which sell every morning, from 5,638 to 1,504 USD, while the total rose from 770 to 1,112 USD. It does so mostly by standing aside: the strategy traded 49 of those 118 mornings. Over the whole period the same rules without the calm check earn about the same, 5% a year in BTC. Their Sharpe ratio is 1.02 against 1.77 and their deepest drawdown more than twice as deep, 3.7% against 1.5%. The calm check buys the same return for less risk. The 26 October call that opens this note fell on a hot morning, with realised volatility at 1.43 times implied. The rules would not have sold it.
8.2. More contracts per leg.
Re-investing the profits changes less than it sounds. Suppose each morning sold as many contracts as the account held BTC, 1.0292 per leg by October instead of 1. The account would end at 1.0294 BTC rather than 1.0292. The Sharpe ratio would barely move, 1.74 against 1.77, because a ratio of return to risk does not depend on size: twice the contracts double both. In practice there is no difference. Deribit's smallest BTC option order is 0.1 BTC (Deribit, 2026c), so the size would only step up once the account passed 1.1 BTC, which it never did. What raises the return is more contracts per BTC of capital, closer to the margin Deribit asks for.
Selling more contracts raises the ceiling and lowers the floor by the same factor. We reran the rules at two, three and five contracts per leg, filling every leg against the real 04:00 bid book at that size:
| 1 BTC account, 27 Mar to 26 Oct 2026 | 1 contract | 2 contracts | 3 contracts | 5 contracts |
|---|---|---|---|---|
| Total P&L | +2,331 USD | +4,542 USD | +6,669 USD | +10,718 USD |
| Annual return, in BTC | 5.0% | 9.9% | 14.6% | 23.8% |
| Sharpe ratio | 1.77 | 1.76 | 1.75 | 1.74 |
| Worst morning | -980 USD | -1,961 USD | -2,941 USD | -4,902 USD |
| Initial margin at its peak | 0.30 BTC | 0.60 BTC | 0.90 BTC | 1.50 BTC |
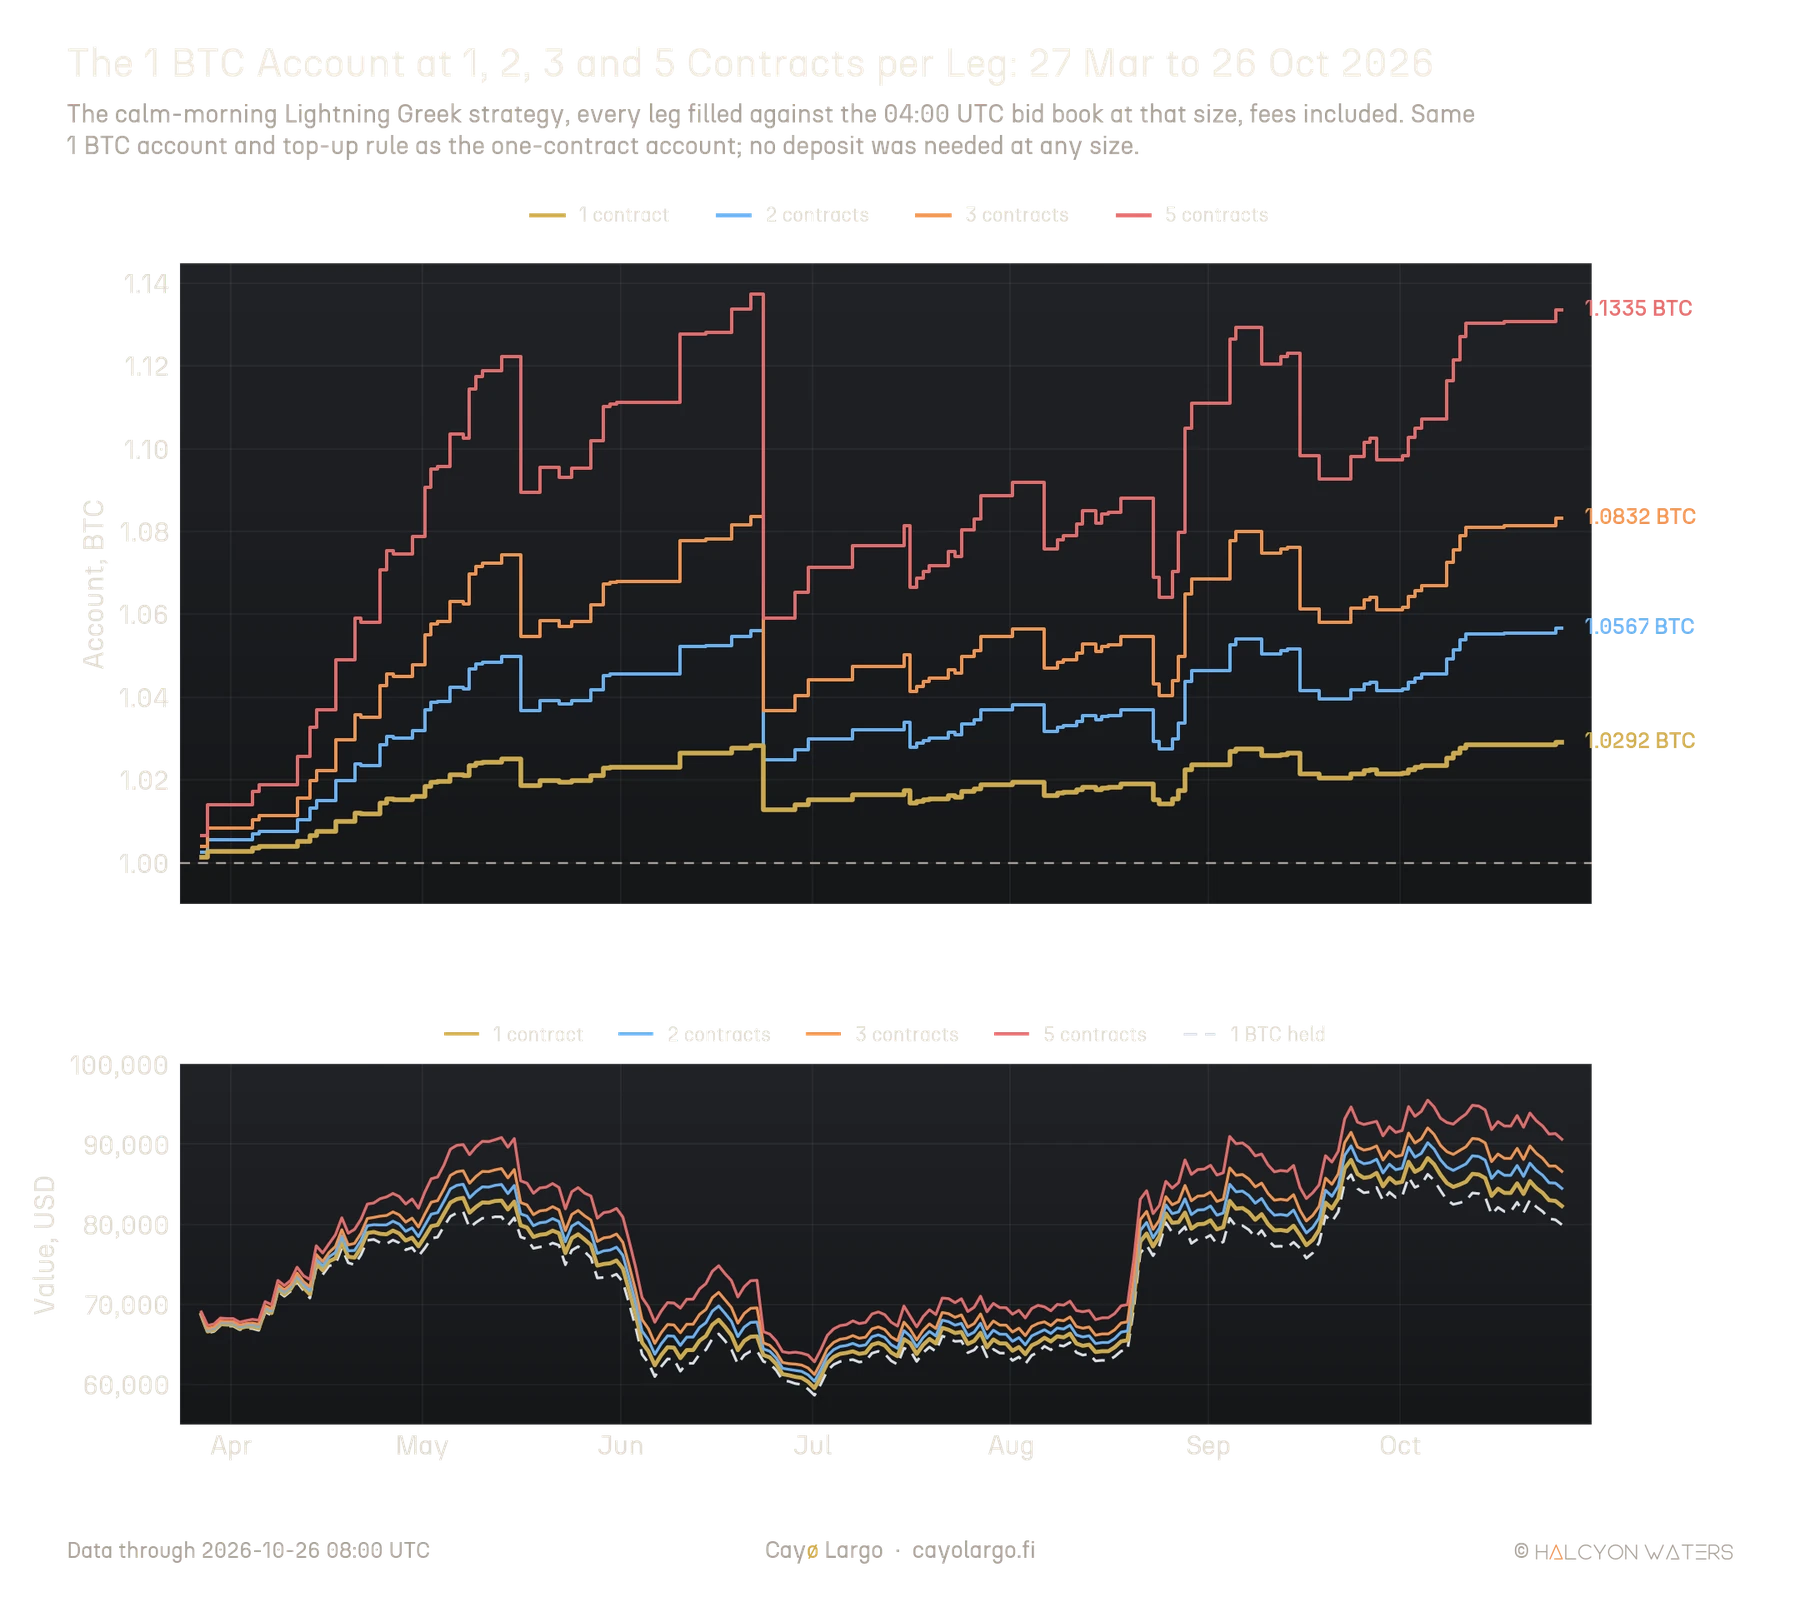
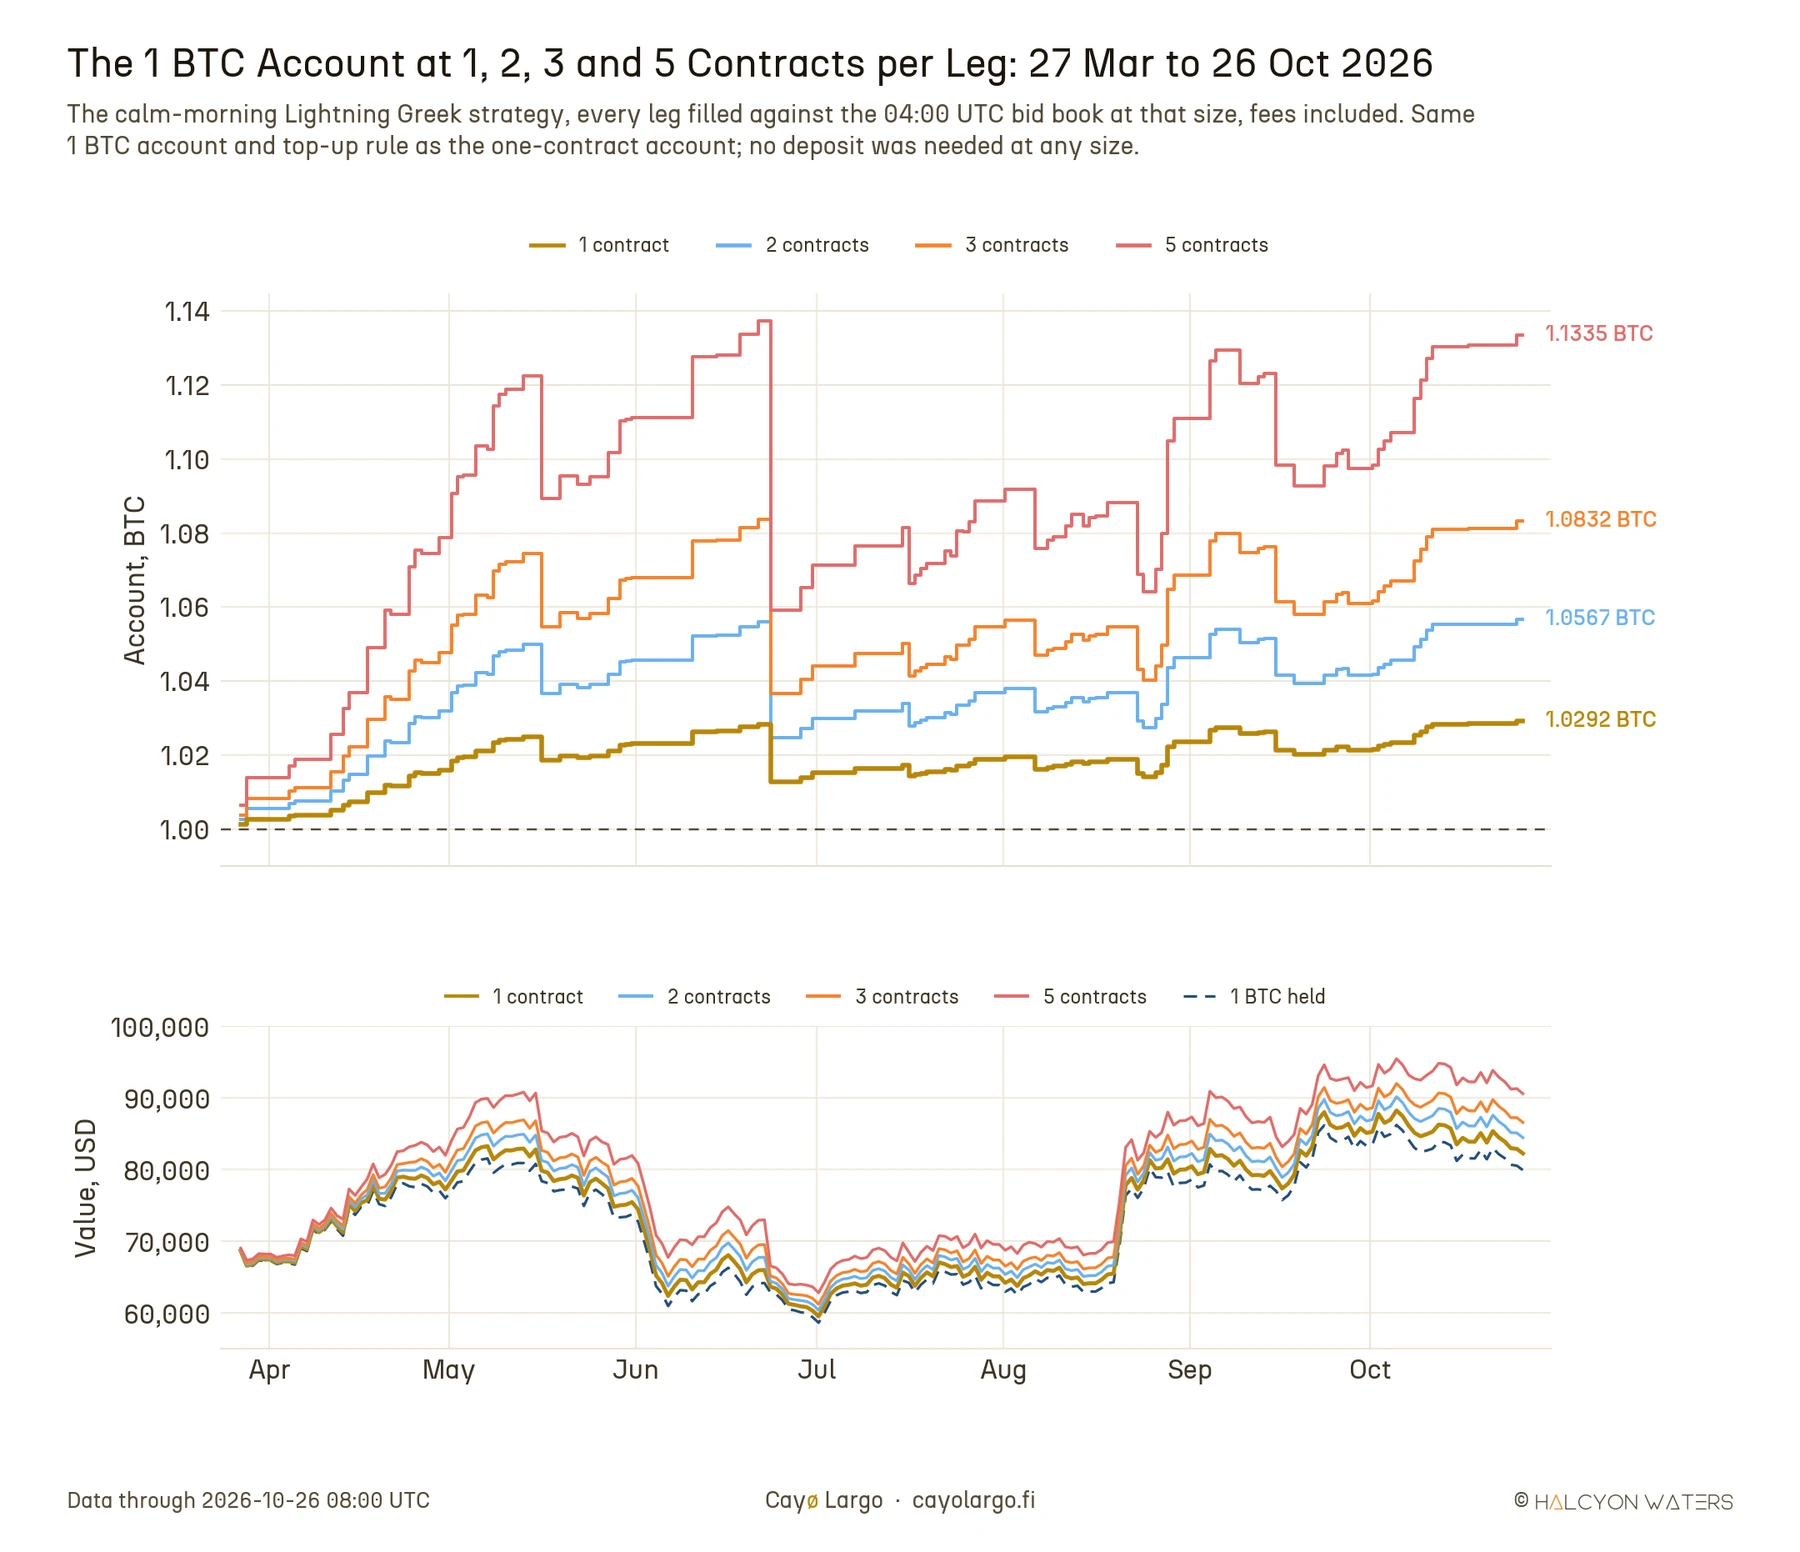
Figure 9: The strategy's 1 BTC account at 1, 2, 3 and 5 contracts per leg, 27 March to 26 October 2026, each leg filled against the 04:00 UTC bid book at that size, fees included. Below, the account values in USD against holding the same 1 BTC.
The books were deep enough. At two contracts only 2 of 152 legs could not be filled in full. The average premium per contract did not fall. The Sharpe ratio barely moves, because profits and losses scale together: leverage changes the size of the bet, not its quality. What sets the limit is margin. Three contracts tie up 0.90 BTC of a 1 BTC account at the peak, where one bad morning would bring a margin call close. Five need more than the account holds. Two contracts per leg is the sensible ceiling on 1 BTC, about 10% a year in BTC on these months. The same factor applies to the losing mornings: at two contracts a bad morning costs twice as much.
8.3. Block trades through a request for quote.
Everything above sells into the screen, one contract at the best bid as the book stood at 04:00. A desk trading size would not. On Deribit it would send a request for quote (RFQ) to several market makers at once and print the result as a block trade. The minimum block is 25 BTC of options and a block option trade pays a fee of 0.03% (Deribit, 2026d; Deribit, 2026e). The side Deribit records on a block is the requester's, so the tape shows where requesters actually traded.
Cayø Largo's archive holds 1,463 block legs in the BTC daily expiry within eight hours of its 08:00 settlement, on 113 days of 2026. Figure 10 shows three things about them. Block trading in the expiring series runs steadily through the morning, with about 115 requester sells and as many buys in the hour from 04:00. Fills do not get worse with size: from 25 to 1,000 contracts, requesters who sold filled near the middle of the screen spread. For cheap options, the kind this strategy sells, a requester who sells fills close to the bid, 7% to 17% below Deribit's mark for options priced between 0.0005 and 0.005 BTC. Only above 0.005 BTC do sellers fill at the mark.
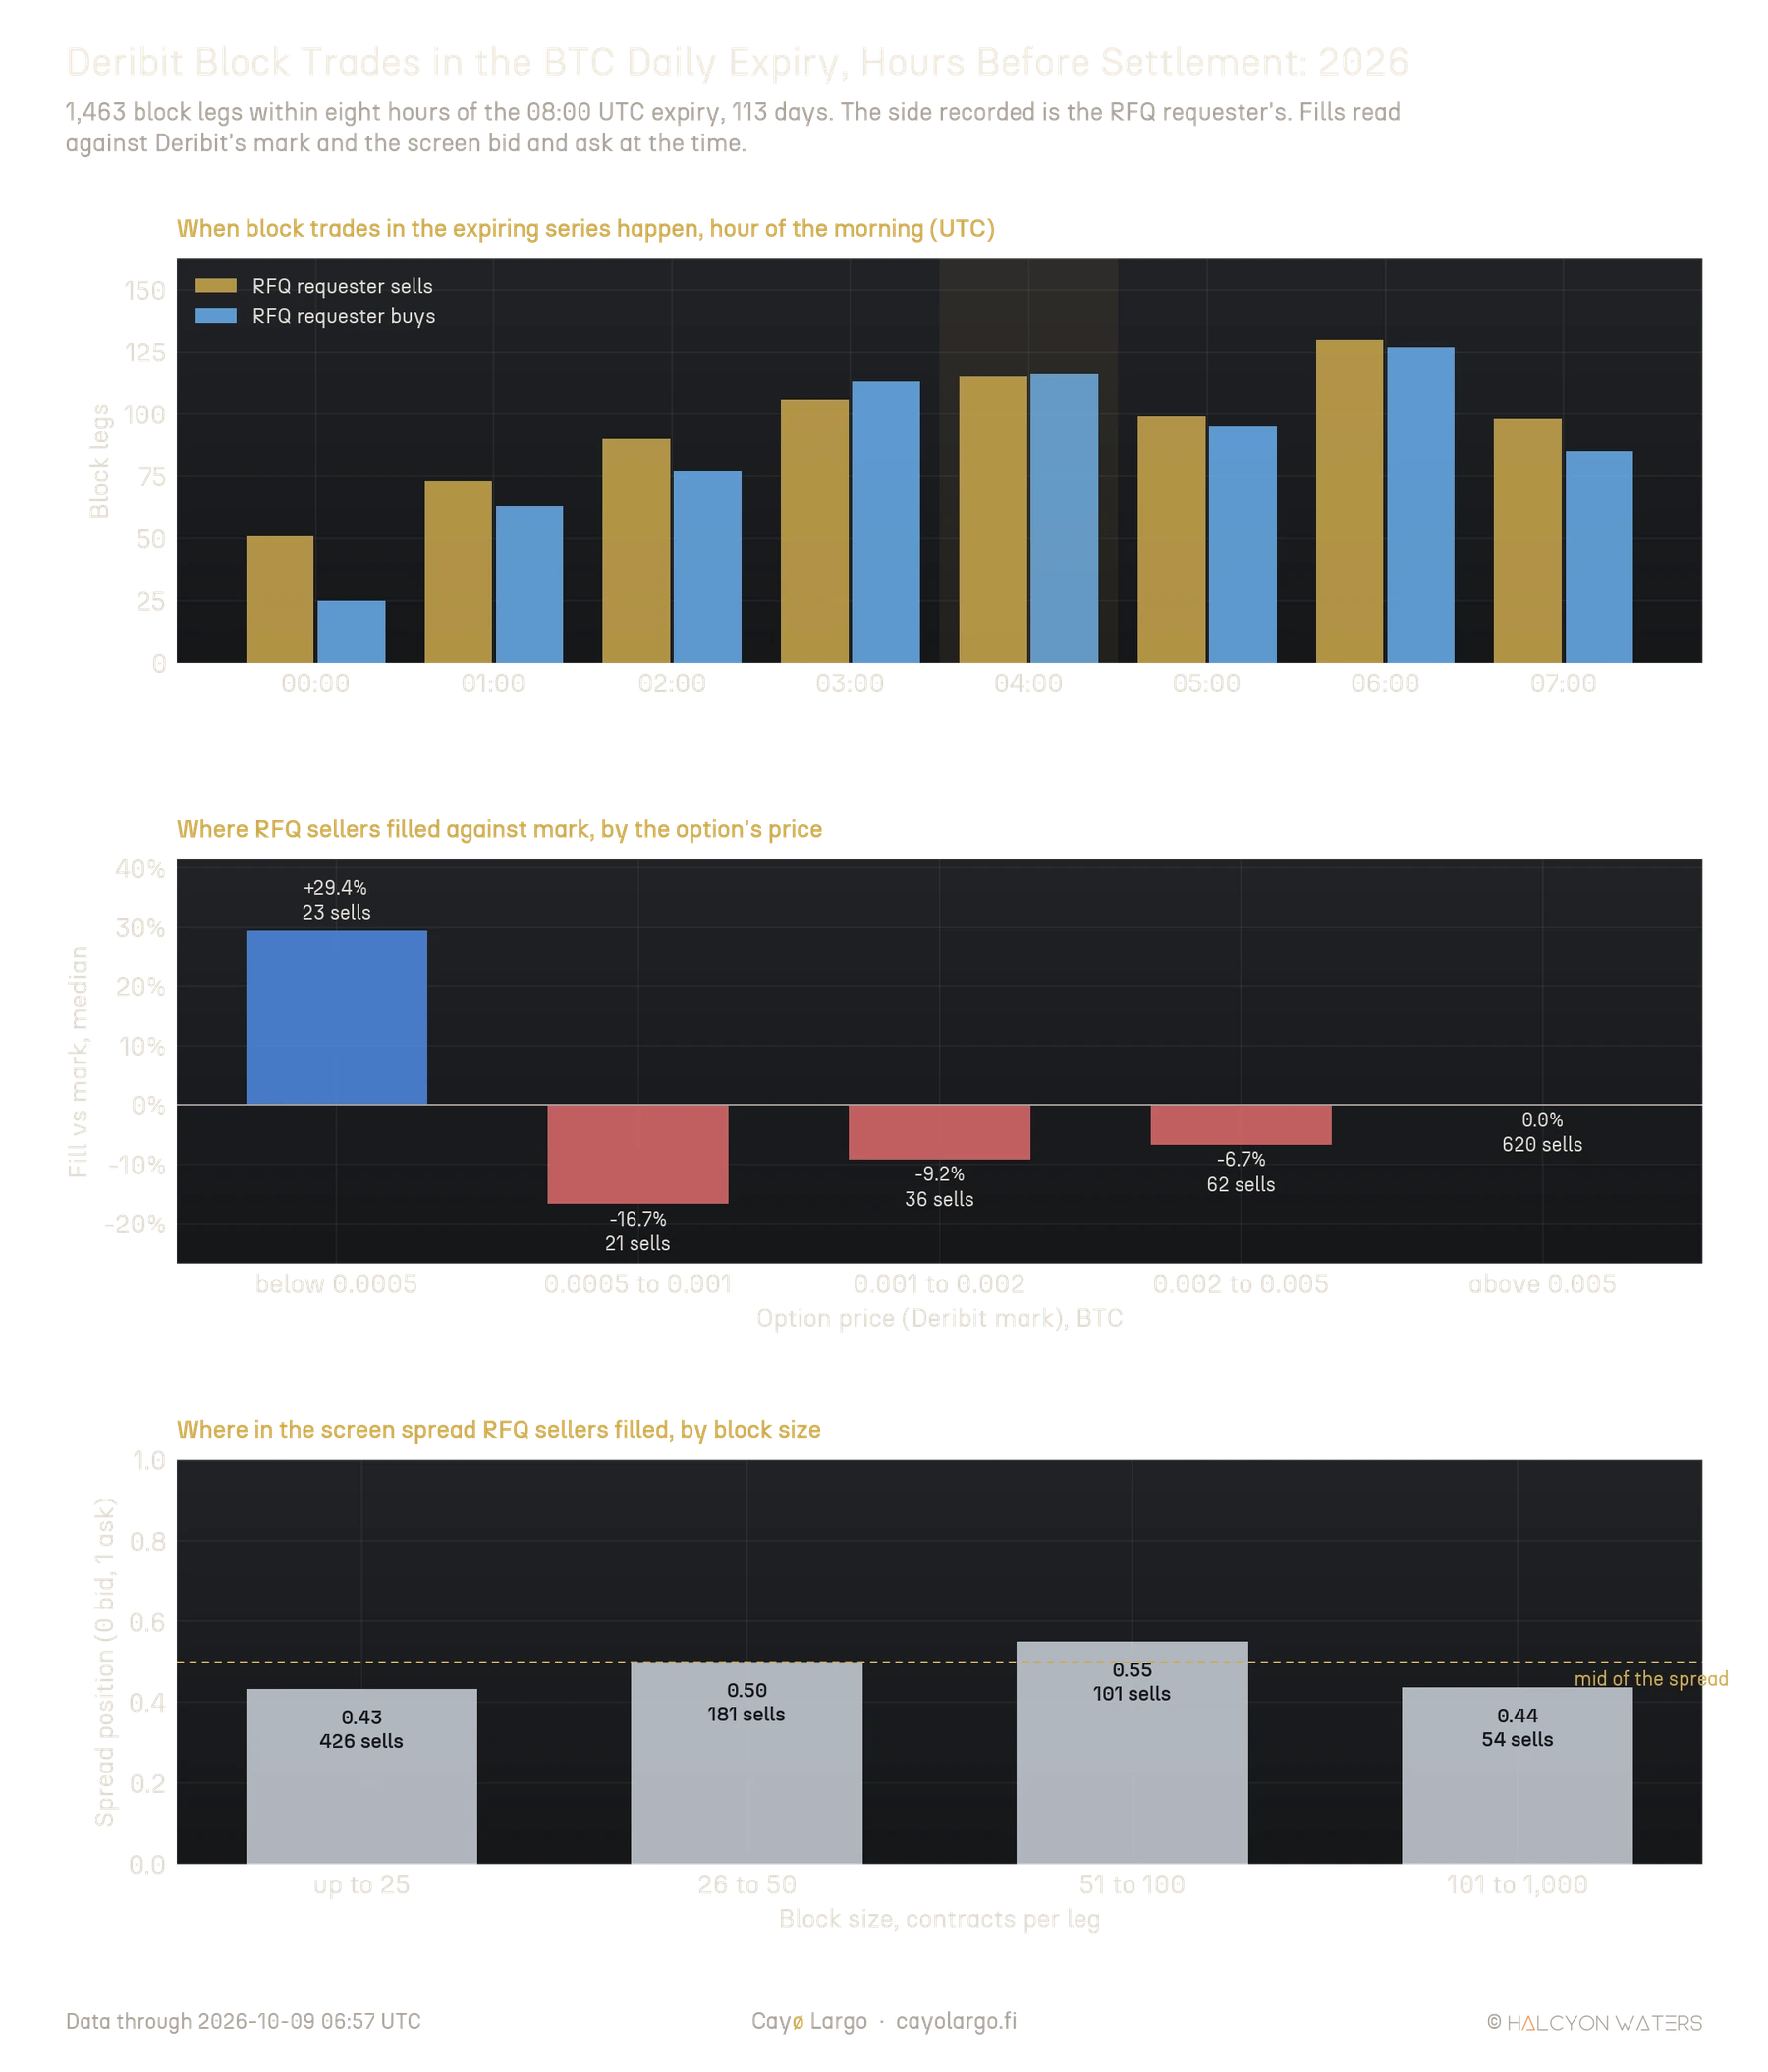
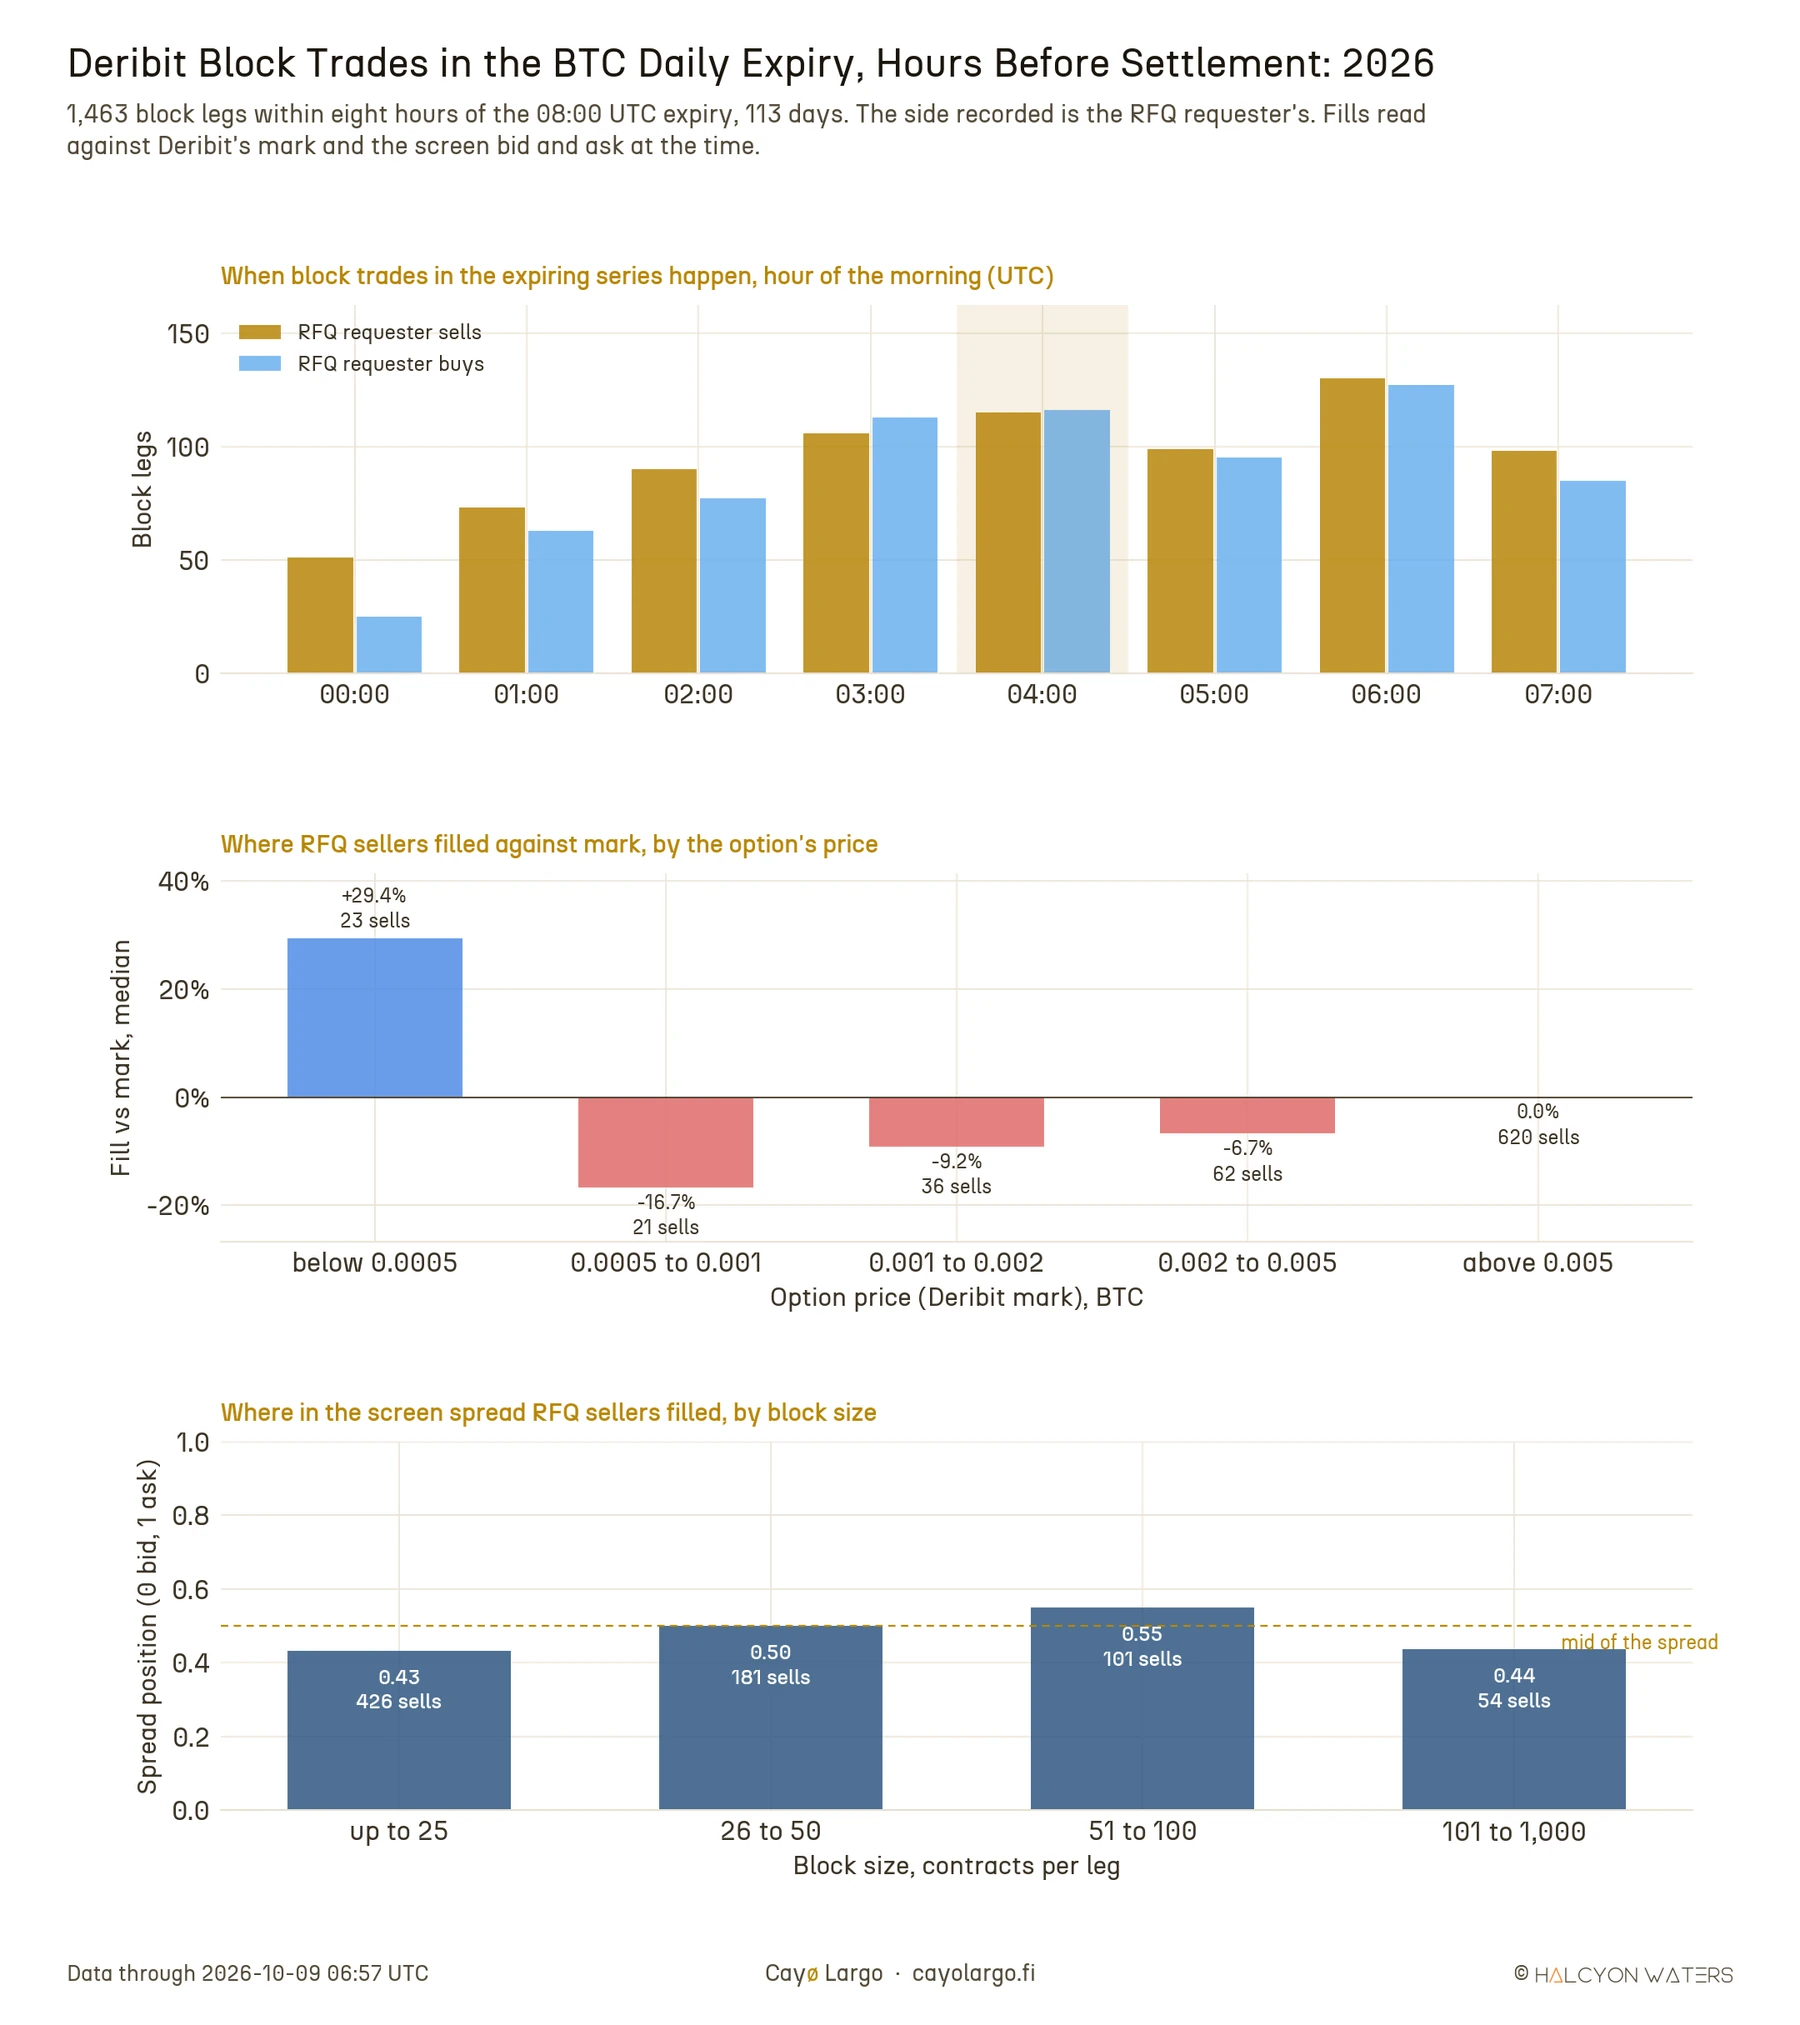
Figure 10: Deribit block trades in the BTC daily expiry within eight hours of its 08:00 UTC settlement, 2026: when they happen, where requesters who sold filled against Deribit's mark by the option's price, and where in the screen spread they filled by block size.
We re-priced every trade of the strategy that way, in two cases:
- Central: each leg is sold at Deribit's mark plus the median difference the tape shows for options of the same price.
- Stress: the same, at the less favourable quartile of that difference, a worse fill than three requesters in four received.
Legs the screen book could not fill are sold too, since an RFQ is quoted by dealers rather than by the resting book. One variant adds a stop: if a morning's loss passed 1% of the 1 BTC account at any ten-minute mark, both legs were bought back through an RFQ at the tape's prices for buyers.
| One contract per leg, 27 Mar to 26 Oct 2026 | Worst morning | Worst drawdown | Annual return, in BTC | Sharpe ratio | Won | Total P&L |
|---|---|---|---|---|---|---|
| Screen, sold at the bid | -980 USD | -980 USD | 5.0% | 1.77 | 80% | +2,331 USD |
| RFQ, central | -982 USD | -982 USD | 7.4% | 2.59 | 83% | +3,319 USD |
| RFQ, central, stop at 1% of the account | -763 USD | -763 USD | 8.0% | 3.13 | 83% | +3,538 USD |
| RFQ, stress | -996 USD | -996 USD | 5.9% | 2.08 | 82% | +2,676 USD |
| RFQ, stress, stop at 1% of the account | -876 USD | -1,213 USD | 4.8% | 1.79 | 80% | +2,048 USD |
Selling through an RFQ added about 1,000 USD per contract per leg in the central case, from 2,331 to 3,319 USD. In the stress case it added about 350 USD. Most of it is better prices on the legs the screen did fill. One caution belongs here. 431 USD of the central gain comes from the cheapest wings, below 0.0005 BTC, where the tape holds only 23 sells. Without that part the gain is about a quarter. The stop at 1% of the account cut the worst morning from about 980 to 763 USD and added a little in the central case. It fired on a single morning, 23 June. In the stress case, where buying back costs more, the stop cost money.
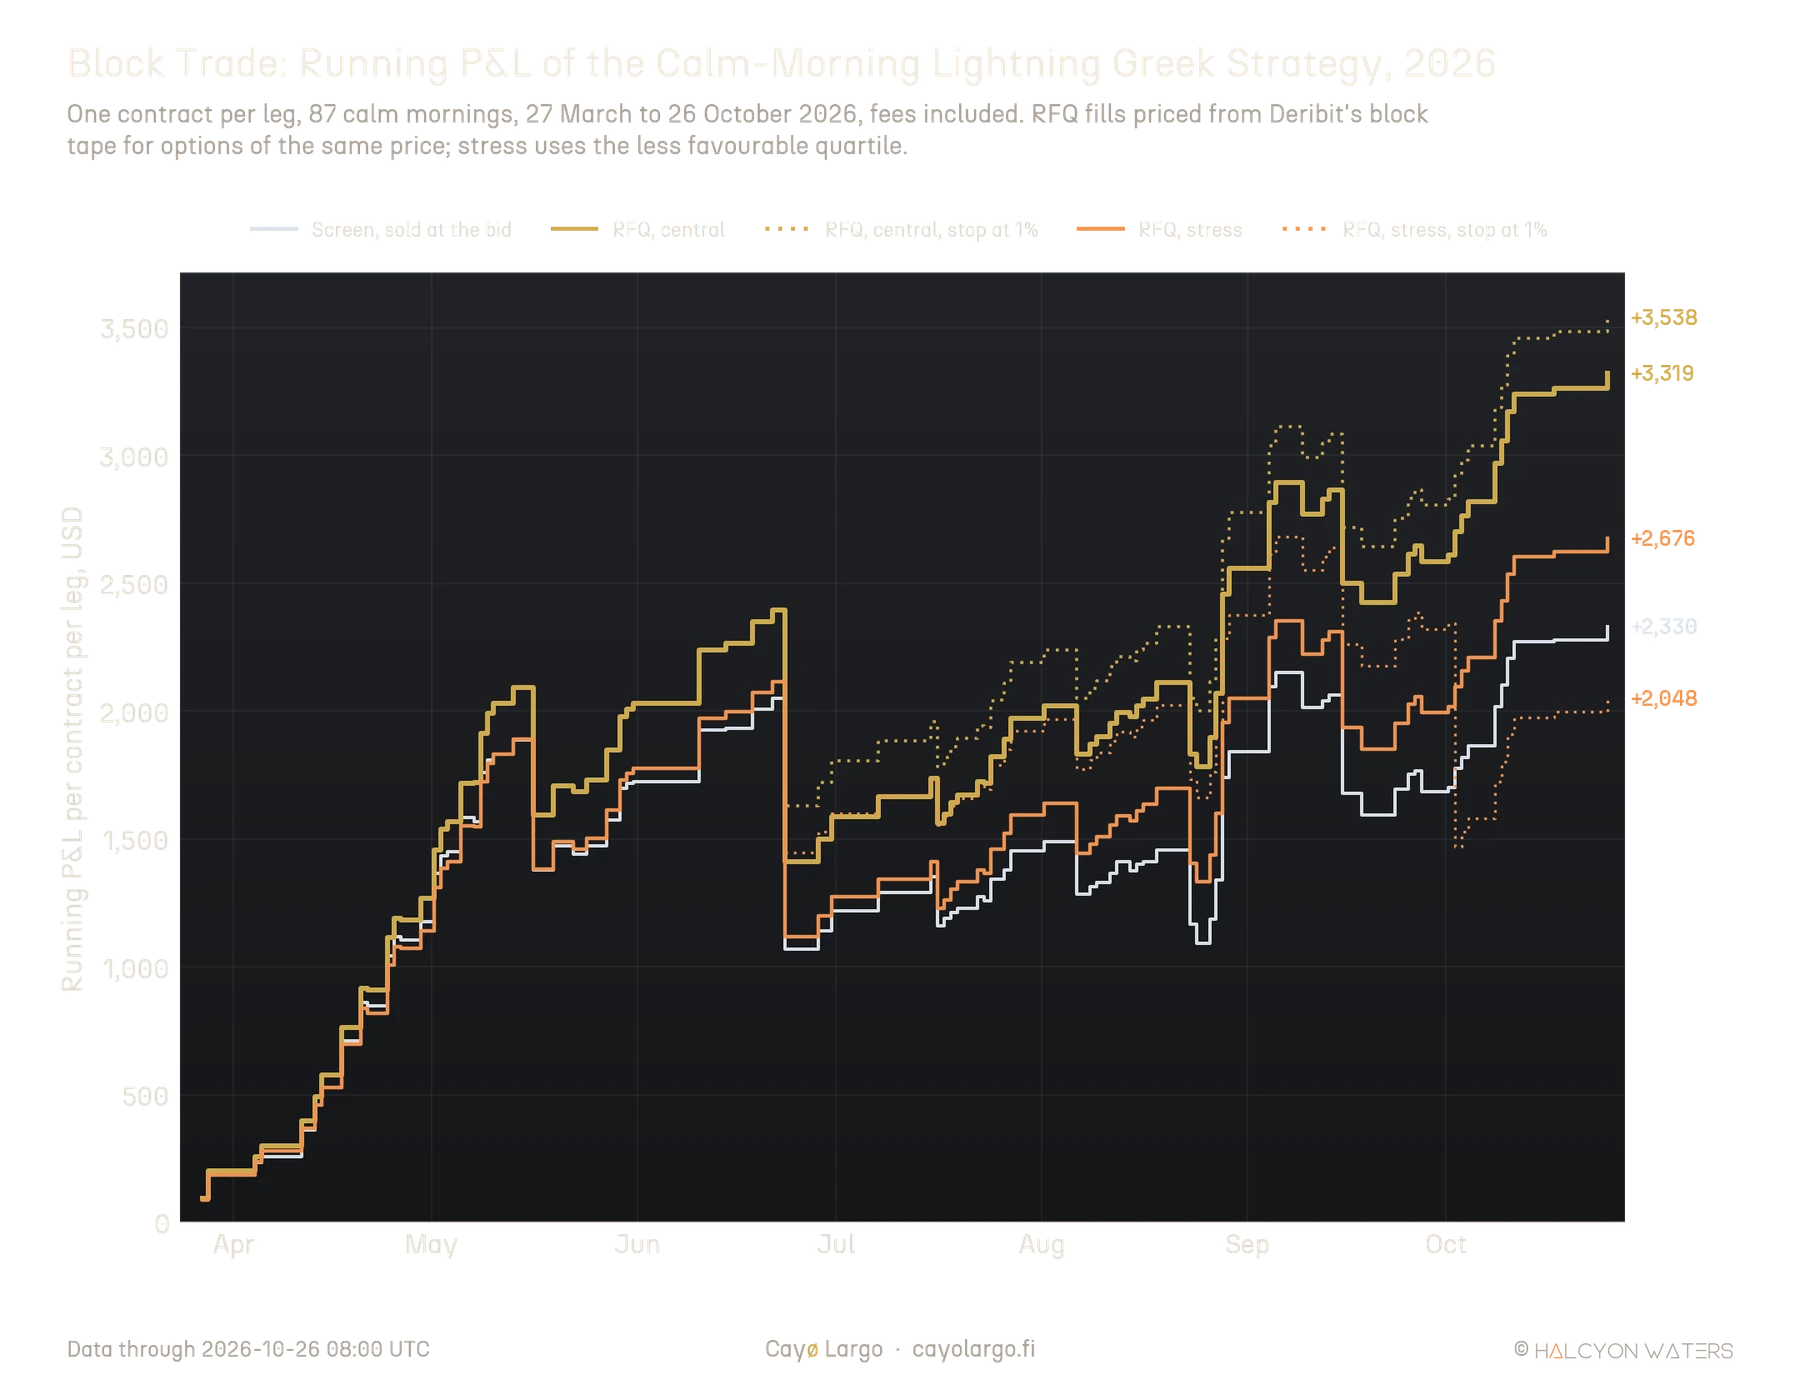
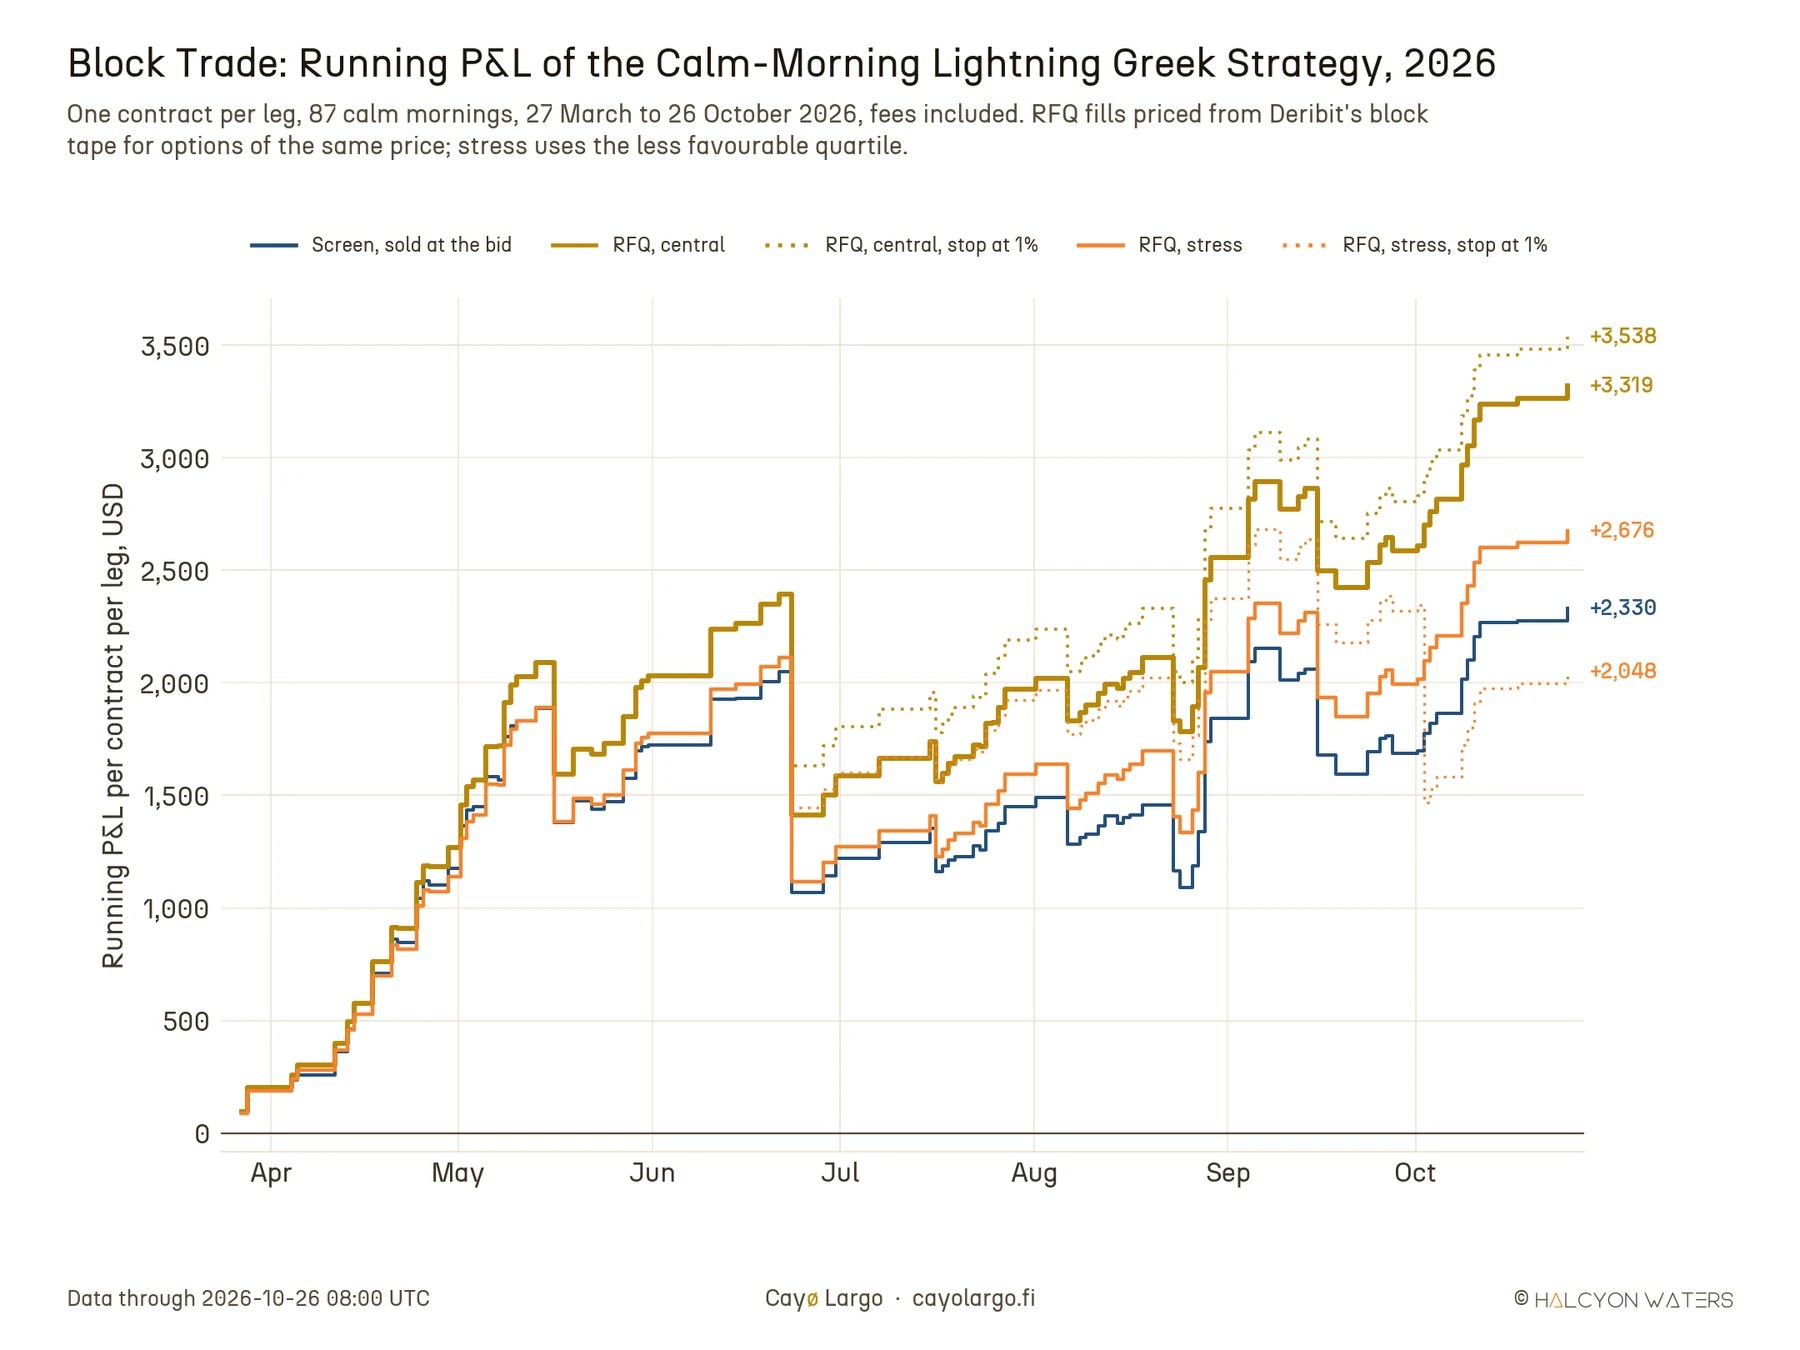
Figure 11: Running profit and loss of the calm-morning Lightning Greek strategy, one contract per leg, 27 March to 26 October 2026, sold on screen at the bid and through an RFQ at prices taken from Deribit's block tape, with and without a stop at 1% of the account. Fees included.
What the route changes most is size. At the 25-contract minimum every figure in this section is 25 times larger, about 83,000 USD over the seven months in the central case, on about 7.5 BTC of initial margin. The tape shows no worse fills at that size, so the quality of the trade carries over. The risk carries over too. A morning like 23 June costs about 24,500 USD at 25 contracts.
9. How does it compare with textbook strategies?
Every options textbook teaches the same handful of ways to trade a short-dated option. We ran five of them on every BTC daily expiry from 27 March to 26 October, with the strategy's timing: the BTC 08:00 UTC expiry, entered at 04:00, one contract per leg, sells filled at the bid and buys at the ask, Deribit fees, held to settlement.
- Short straddle. Sell the call and the put at the strike nearest spot. It collects the most premium and pays only if BTC settles close to that strike. The loss grows without limit on either side.
- Short strangle. Sell the nearest out-of-the-money call and put. The profit zone is wider and the premium smaller, with the same open-ended loss beyond the strikes.
- Iron butterfly. A short straddle with a call and a put bought two strikes away. The wings cap the loss and cost part of the premium.
- Iron condor. A short strangle with wings two strikes beyond. A capped loss for a smaller credit.
- Long straddle. Buy the call and the put at the strike nearest spot. It wins only on a large move, which makes it the buyer's side of the seller's cushion.
The calm-morning Lightning Greek strategy is a short strangle by shape. What differs is which strikes it sells and which mornings it sells on. Figure 12 returns to 23 September, the calm morning of Section 5. It draws all six on that morning with the prices each would have paid. On top, the two small charts show that night the way the strategy read it: the Lightning Greek map of the expiring series and, under it on the same clock, BTC itself. Every payoff below is read at the price BTC settled at, 86,191 USD.
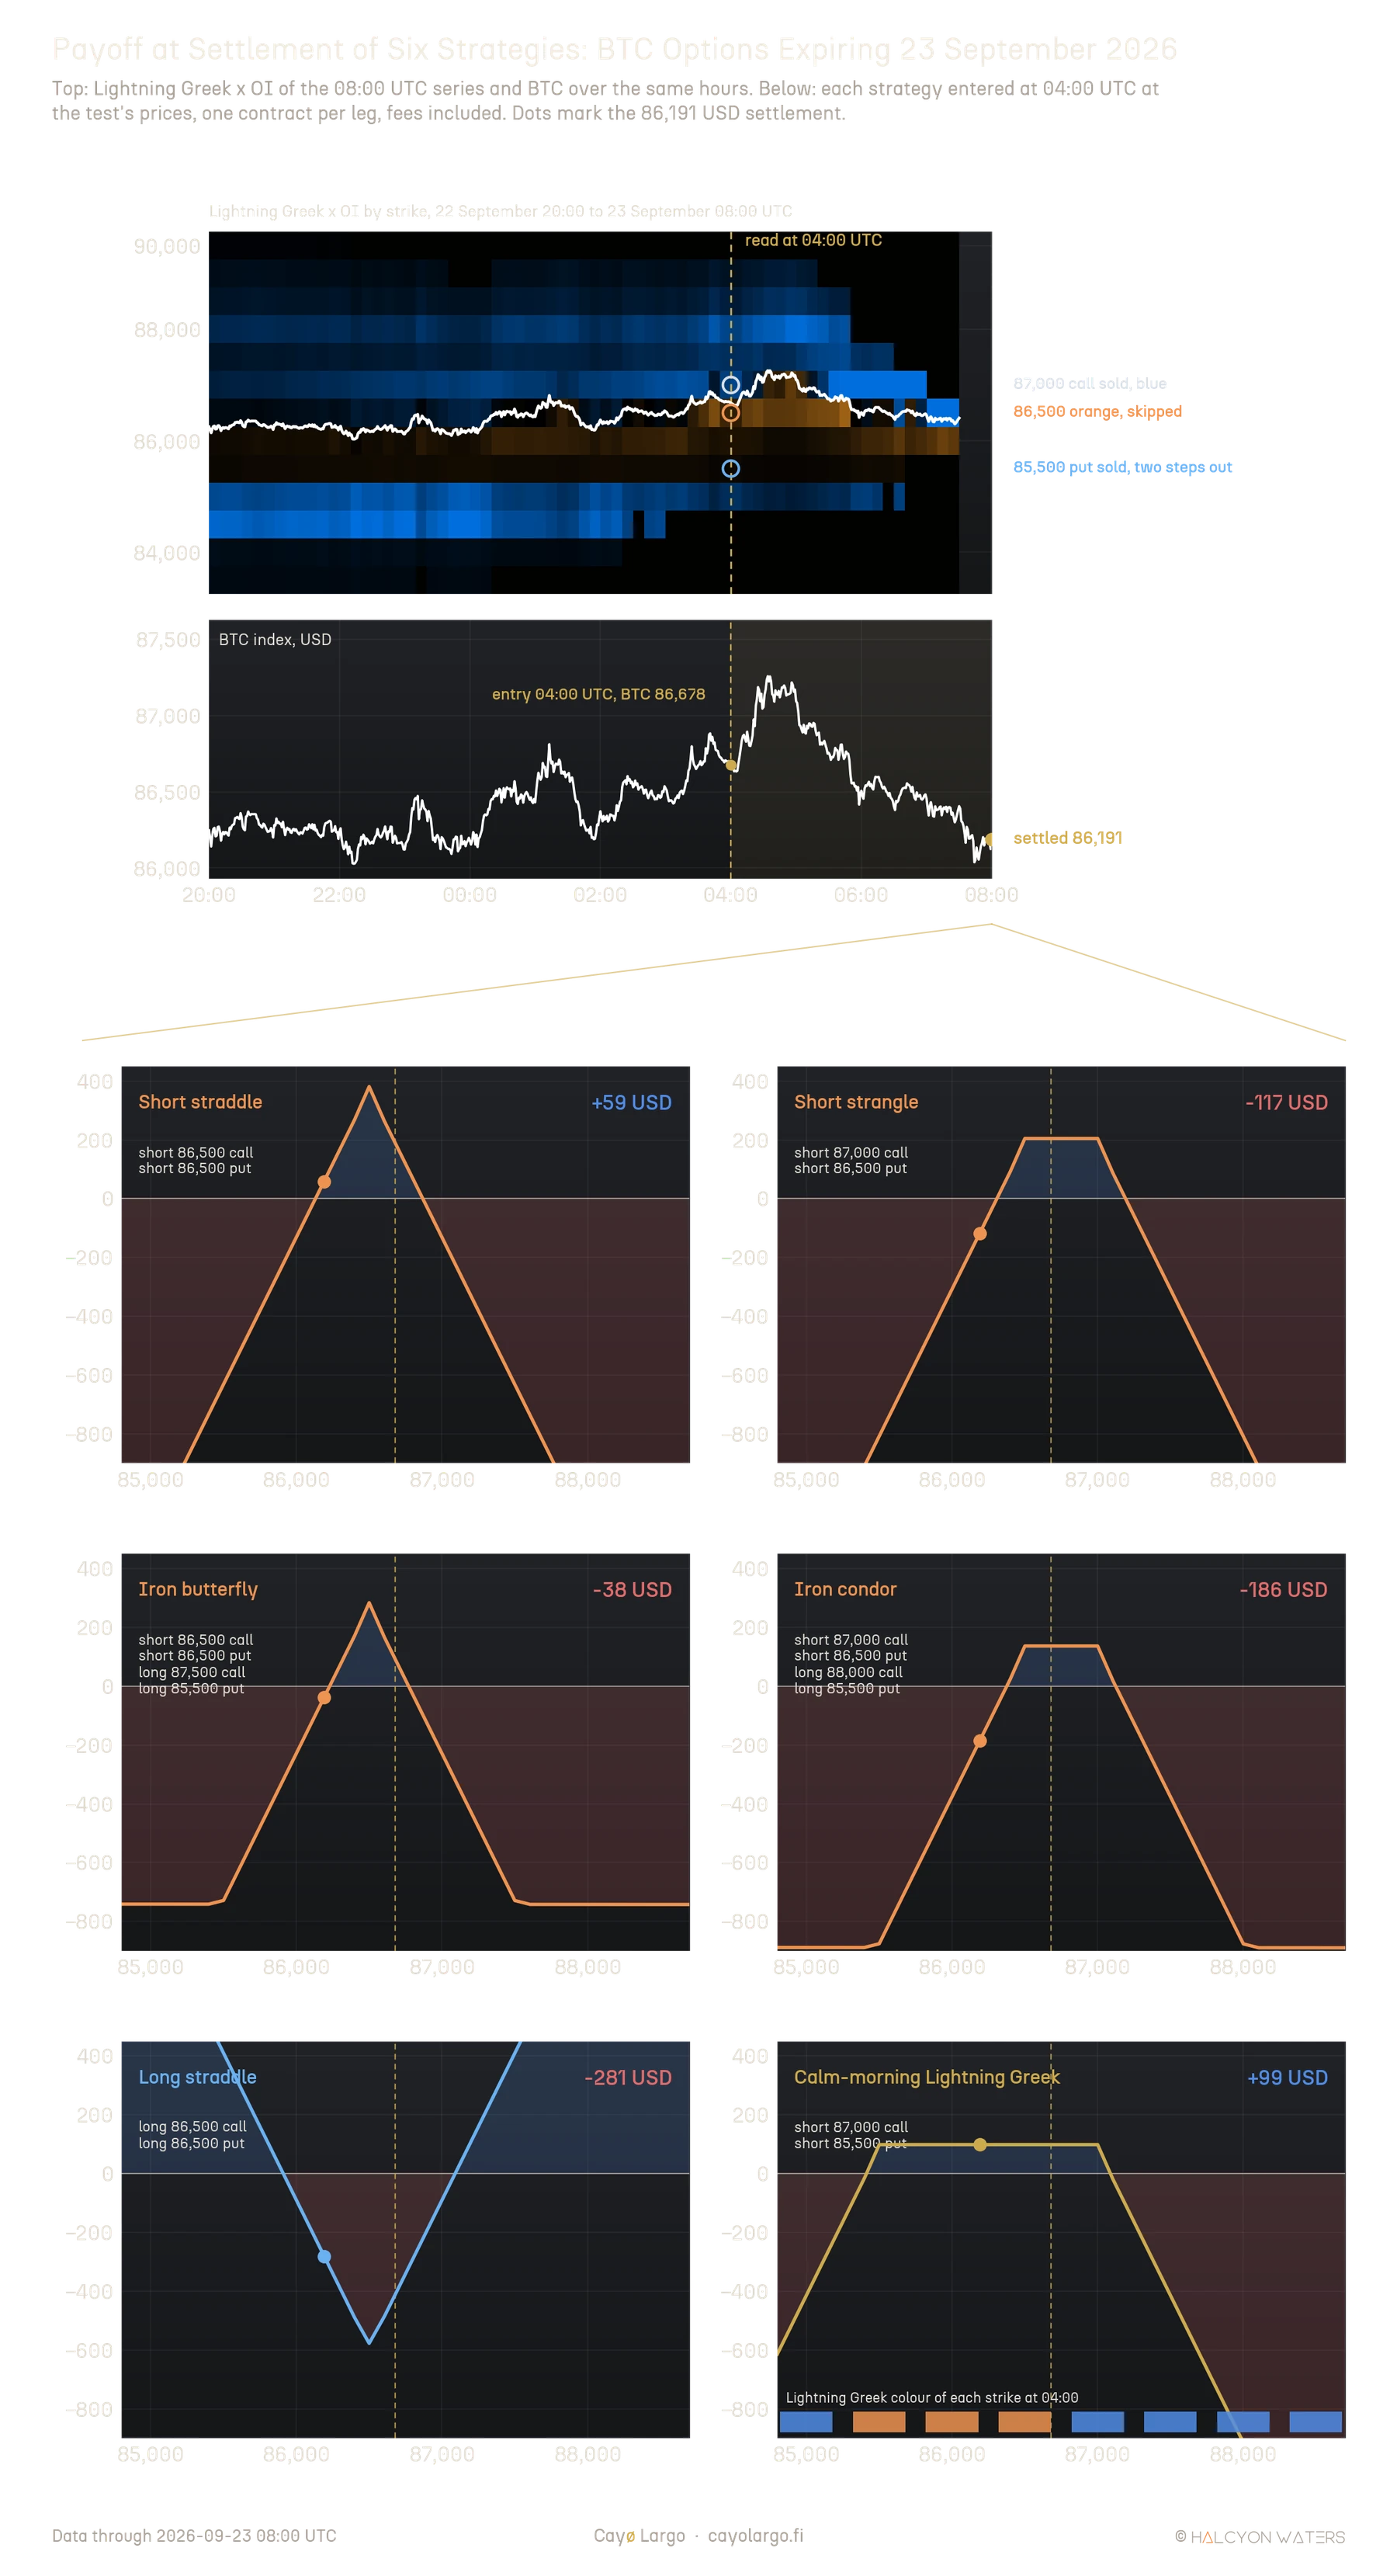
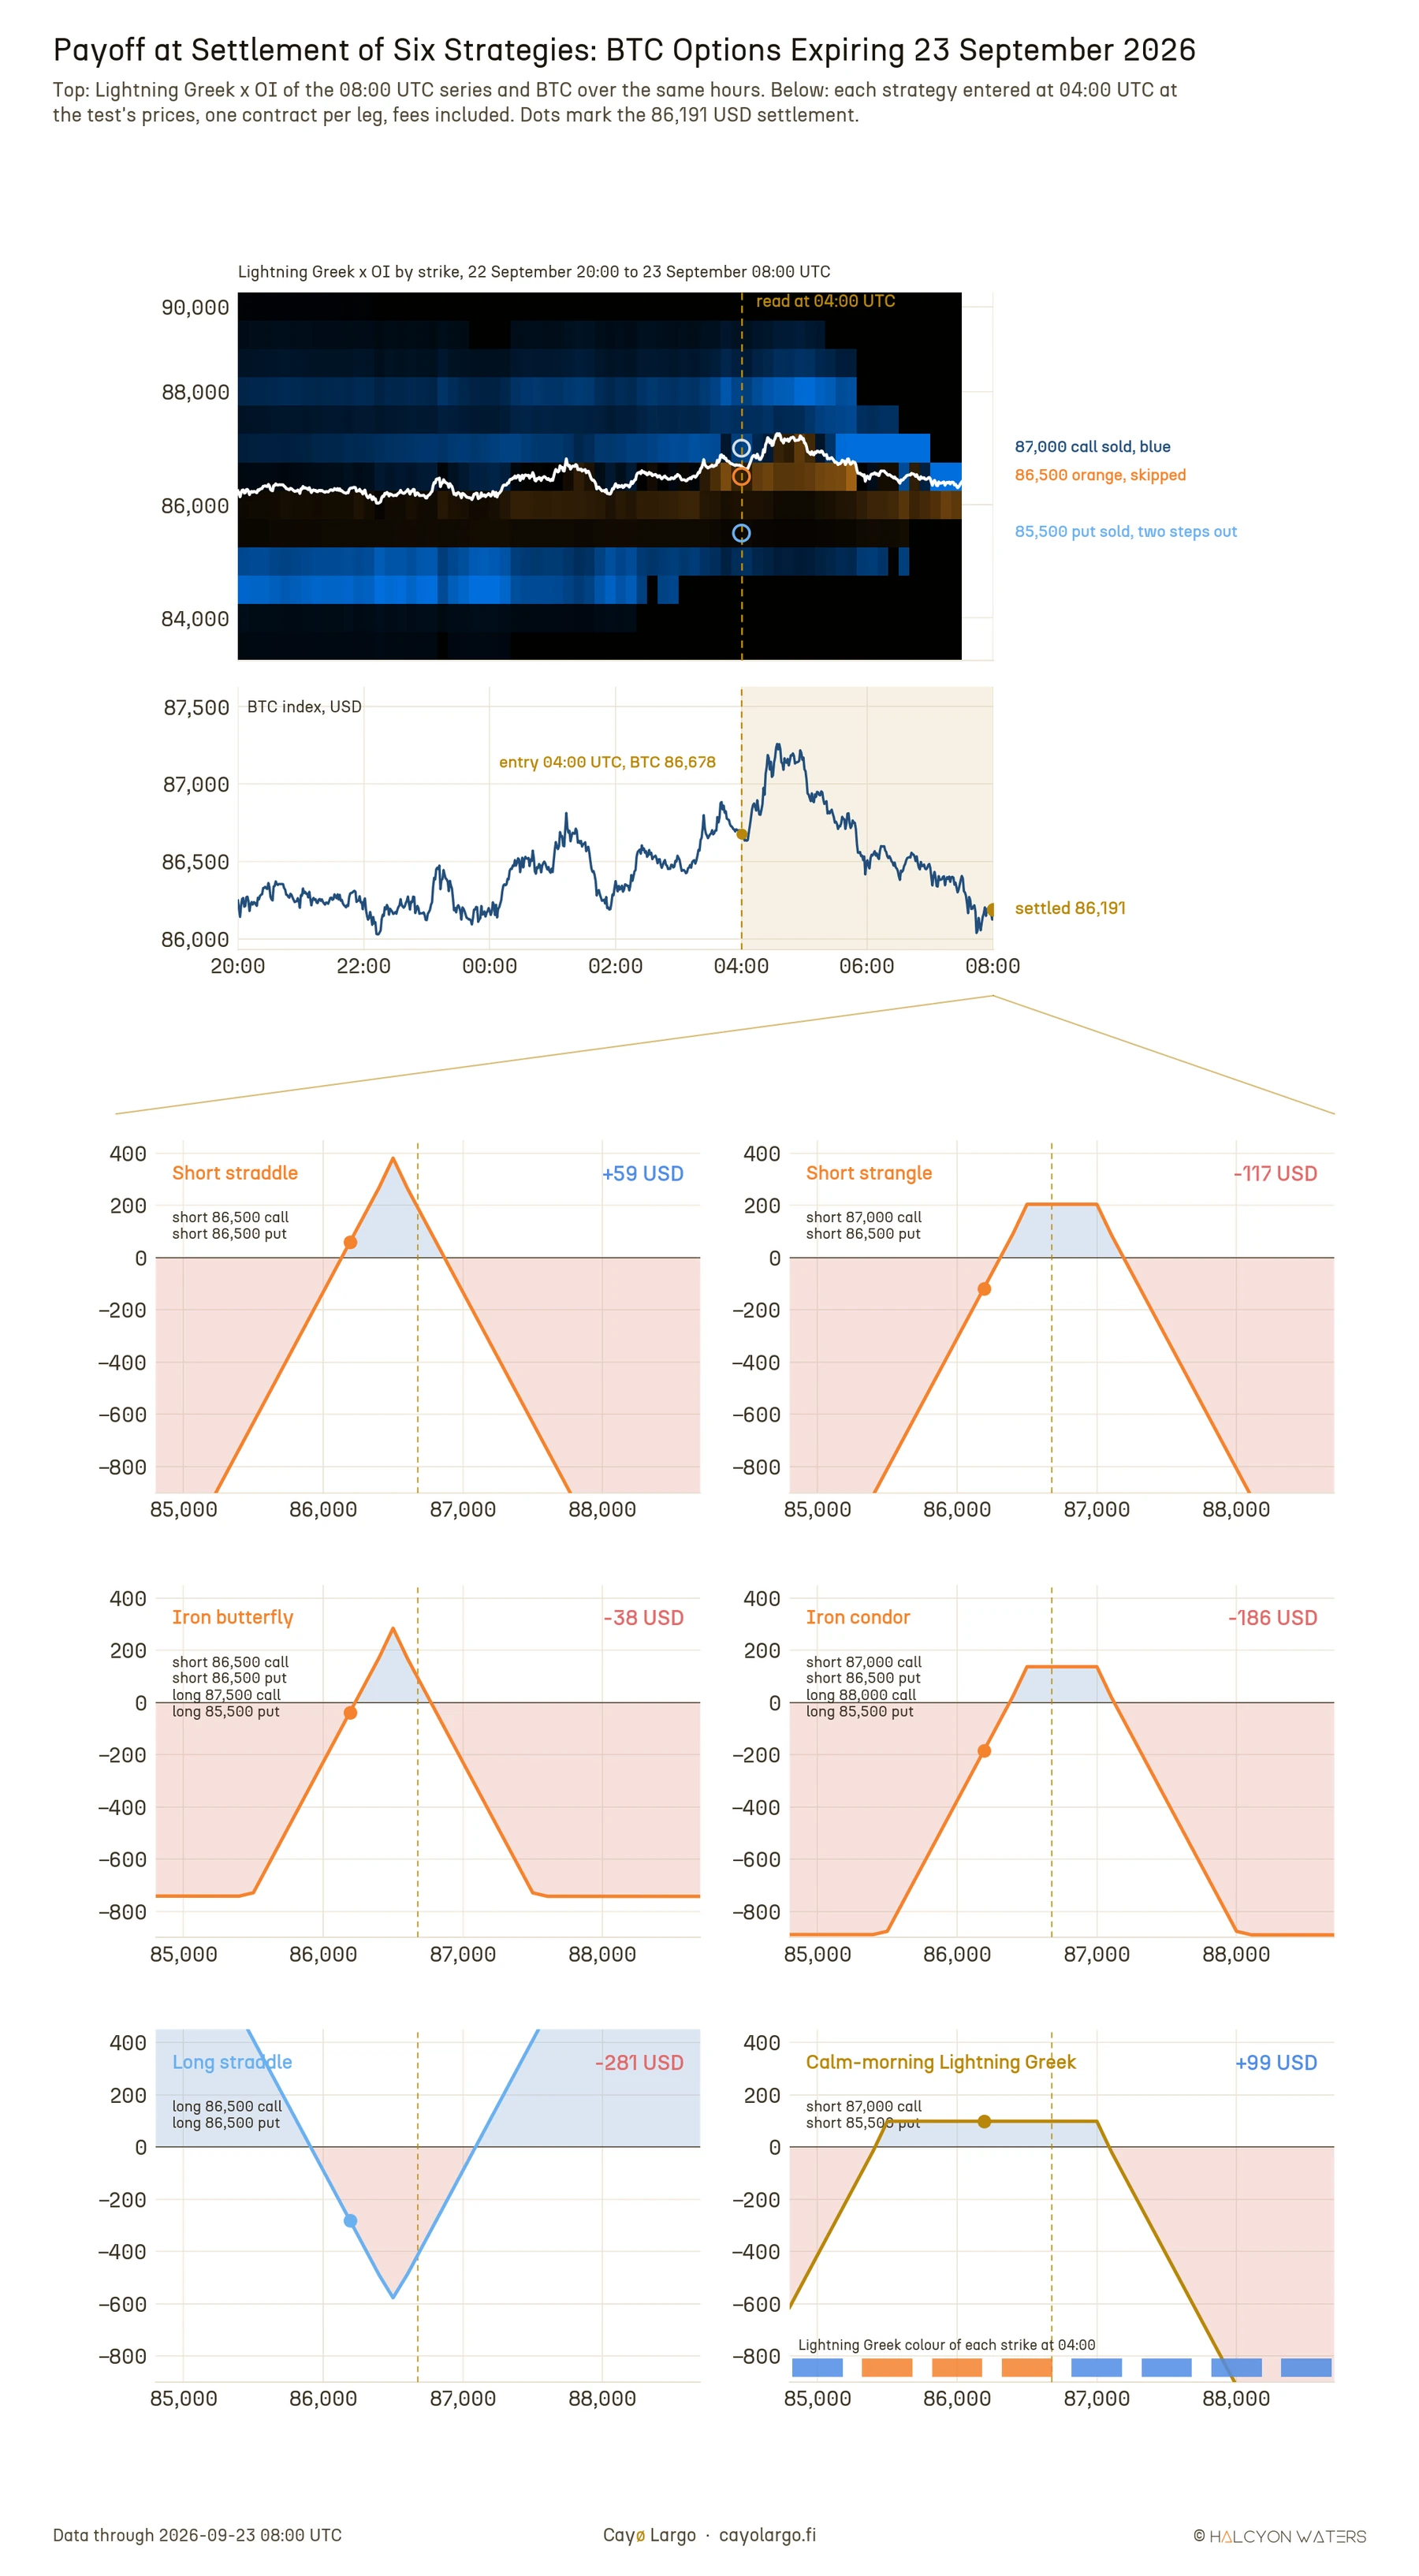
Figure 12: Top, the Lightning Greek x OI map of the 08:00 UTC series and, on the same time axis, BTC from 20:00 UTC the evening before to the 08:00 settlement. Below, payoff at settlement of five textbook strategies and the calm-morning Lightning Greek strategy on 23 September 2026, all entered at 04:00 UTC at the prices the tests used, one contract per leg, fees included. Blue shading marks profit, red loss. The Lightning Greek panel carries the colour of each strike beneath its payoff.
That morning makes the difference visible. The straddle sold the strike next to spot and kept 59 USD after a peak of 381. The strangle and the condor both sold the 86,500 put inside the orange band and lost when BTC settled at 86,191. The Lightning Greek strategy's flat top sits over the orange strikes rather than on them, so the same settlement that hurt the others landed in its profit zone.
Over the whole period the pattern holds:
| BTC, one contract per leg, 27 Mar to 26 Oct 2026 | Trades | Worst trade | Worst drawdown | Annual return, in BTC | Sharpe ratio | Won | Total P&L |
|---|---|---|---|---|---|---|---|
| Long straddle, every morning | 212 | -665 USD | -33,696 USD | -54.5% | -11.04 | 22% | -33,354 USD |
| Iron butterfly, every morning | 212 | -789 USD | -15,221 USD | -29.4% | -5.21 | 48% | -14,623 USD |
| Short straddle, every morning | 212 | -1,292 USD | -9,097 USD | -16.0% | -2.42 | 52% | -7,248 USD |
| Iron condor, every morning | 212 | -874 USD | -7,323 USD | -11.3% | -2.09 | 66% | -5,047 USD |
| Short strangle, every morning | 212 | -1,127 USD | -5,462 USD | -1.1% | -0.16 | 69% | -394 USD |
| Weekly iron condor near 25 delta, Friday to Friday | 28 weeks | -4,372 USD | -5,435 USD | 3.1% | 0.31 | 71% | +1,056 USD |
| Short strangle, calm mornings only | 87 | -964 USD | -1,055 USD | 3.8% | 1.18 | 72% | +1,784 USD |
| Calm-morning Lightning Greek strategy | 87 | -980 USD | -980 USD | 5.0% | 1.77 | 80% | +2,331 USD |
The weekly condor runs on a different horizon, ties up different capital and its last week settled on 2 October, so its row compares the shape of the results, not capital efficiency. Run with the same 1 BTC account as section 7, the short strangle every morning needed 10 deposits worth 0.031 BTC to stay at 1 BTC and finished 0.006 BTC below what had been put in. The strategy needed none.
Figure 13 adds one line that is not a textbook strategy: the strategy's own strikes sold every morning, without the calm check. Read next to the short strangle on calm mornings only, it separates what each of the strategy's two rules adds.
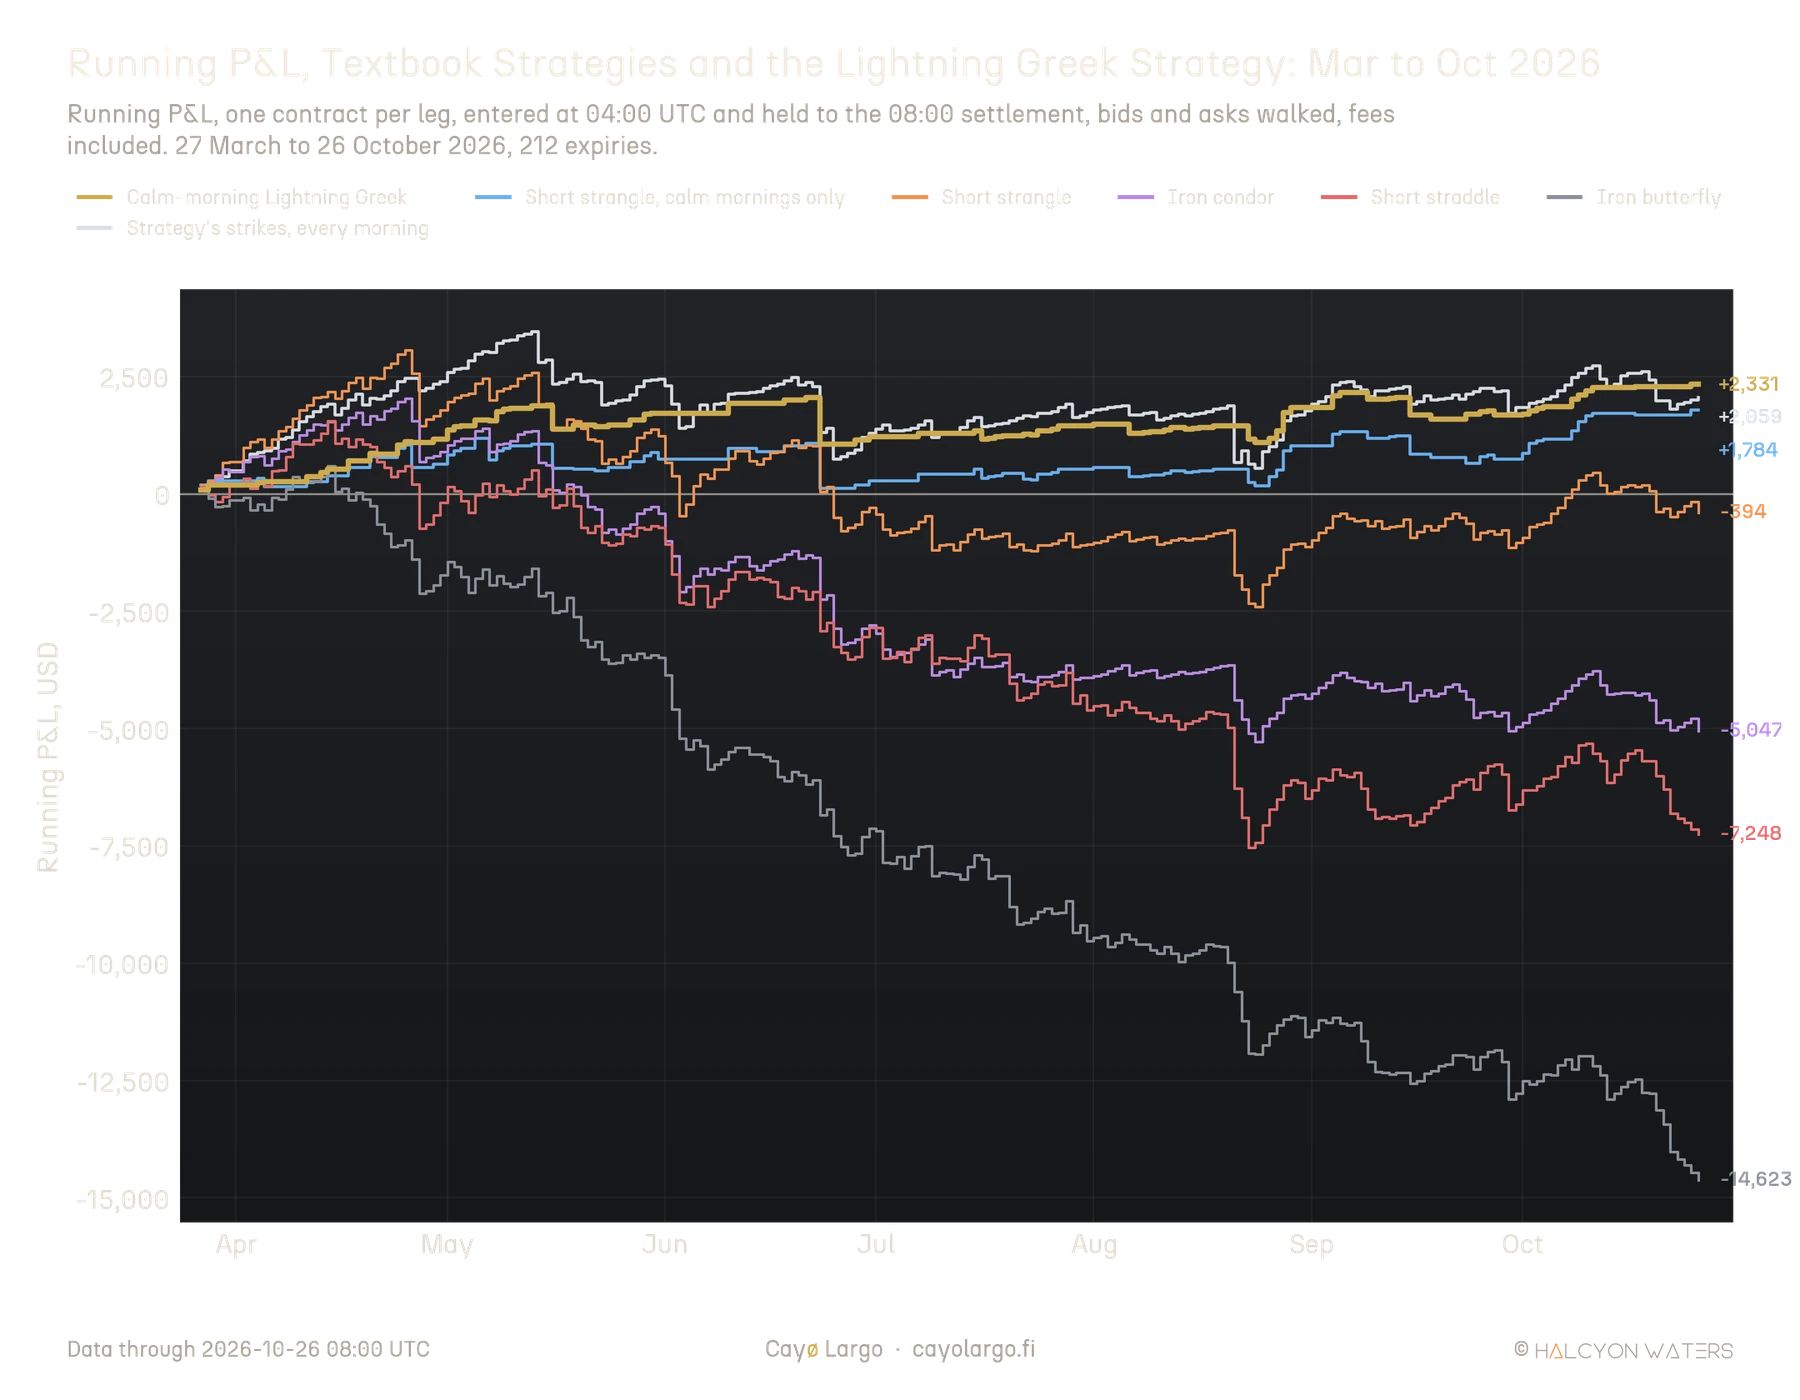
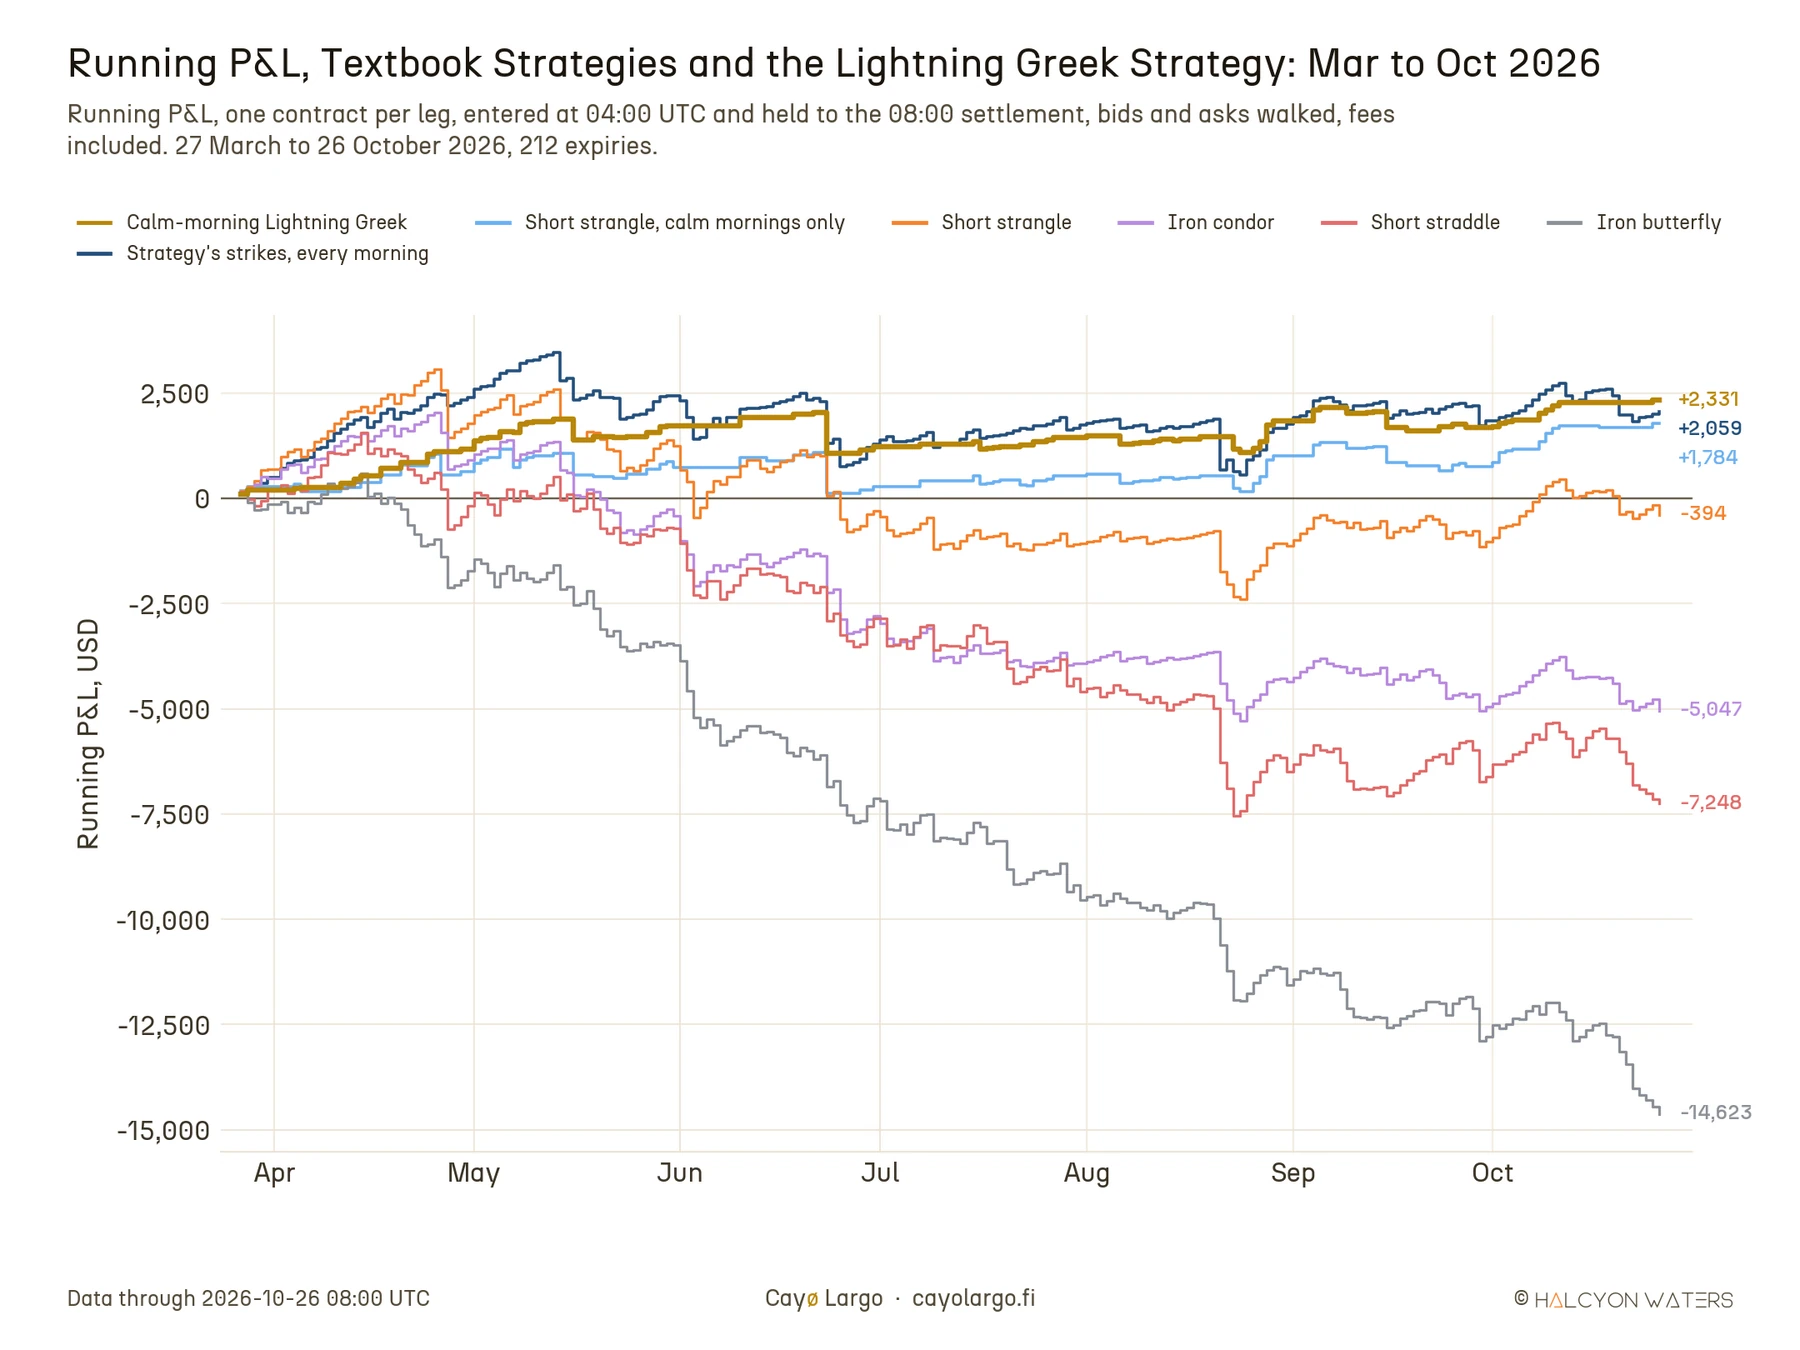
Figure 13: Running profit and loss of textbook option sellers and the Lightning Greek strategy on BTC daily expiries, 27 March to 26 October 2026, one contract per leg, fees included. The long straddle, at -33,354 USD, is left off the scale.
Every daily textbook seller lost money over the period. Only the two rules of the strategy turn the same short strangle into a profit. Each does a different job. Selling on calm mornings only is what moves the textbook strangle from a 394 USD loss to a 1,784 USD gain: it removes the days the options had not priced. The Lightning Greek colour then adds the rest, 547 USD more on the same 87 mornings and a win rate up from 72% to 80%, by moving the strikes off the places where the in-the-money side had already crowded in.
The capped structures did worse than the open ones. Four hours before settlement a wing bought at the ask costs more than the losses it prevents, so the butterfly and the condor paid for protection every morning and collected it rarely. The straddle did worse than the strangle because the strike nearest spot is the one most often contested. The long straddle shows the other side of the same cushion: buying options in the last four hours lost on 78% of mornings.
Per dollar of its worst drawdown, the strategy earned 2.4 USD. The weekly condor earned 0.2 USD and the textbook dailies lost money. In a range-bound market it is a short strangle that knows which strikes and which mornings to leave alone.
10. Limitations.
As usual, our work rests on assumptions and has limits. The rules are written and tested for BTC on Deribit. ETH options behave differently and are not covered here. Results are for one contract per leg, filled at the bid as the book stood every ten minutes. Larger size in the final hours meets thinner books and is not covered. We compute settlement ourselves as the 30-minute average of the index, following Deribit's definition rather than using its published delivery price.
The results run from 27 March to 26 October 2026. Rebuilt from Deribit's order books, the same rules lost 4,351 USD from September 2025 to February 2026, a trending stretch in which four-hour moves often exceeded what the options priced. They are not an edge for every market. Read every figure here as a study of historical data, not a recommendation to trade.
11. Where can you trade it?
The rules were measured on Deribit, the venue that carries most of the BTC options market. Who may trade there depends on where a trader lives and how the exchange classifies them, not on whether they buy or sell. Deribit's Dubai entity is licensed by the Virtual Assets Regulatory Authority (VARA). Deribit's own note from January 2025 put derivatives within reach of qualified and institutional investors only (Deribit Insights, 2025). VARA's public register now lists retail investors as well, under a limited licence approval (VARA, 2026). Deribit's list of restricted jurisdictions blocks the United States, Canada and Japan entirely, does not accept retail clients from the United Kingdom and allows retail clients in the United Arab Emirates and Panama spot products only (Deribit, 2026a). Most of the European Union, Poland included, is not on that list. We found no rule that treats selling an option differently from buying one. Selling needs margin like any short position.
Three other venues list crypto options. Derive.xyz and Thalex list BTC options with fixed expiries, Derive on-chain and self-custodial. Paradex lists perpetual options, which never expire, so the rules do not carry over to them as written. Each venue has its own terms on who may use it. We have not tested the rules on any of the three. The Lightning Greek map is computed from Deribit's open interest, which still describes the bulk of the market. Strikes, expiry times, fees, liquidity and the settlement index differ from venue to venue. Check your local rules and your venue's terms before trading.
12. In short.
Selling BTC options in the last four hours before expiry pays when the market prices more movement than it delivers. The textbook versions of that trade lost money on the mornings we tested because they sold the wrong strikes on the wrong mornings. Two readings improve both: the Lightning Greek colour of the expiring series and a calm morning against implied volatility. From March to October 2026 they turned a losing short strangle into 2,331 USD on one contract per leg, with four mornings in five won. The rules choose strikes and mornings better than the textbook does. A seller should still size the account for the bad morning that will come.

References
- Sharpe, W. F. (1994). The Sharpe Ratio. The Journal of Portfolio Management, Fall 1994. The ratio of mean excess return to its standard deviation, in the author's own later definition.
- Sortino, F. A. and van der Meer, R. (1991). Downside Risk. The Journal of Portfolio Management 17(4), 27-31. Risk measured on returns below a target only.
- Goetzmann, W., Ingersoll, J., Spiegel, M. and Welch, I. (2007). Portfolio Performance Manipulation and Manipulation-proof Performance Measures. The Review of Financial Studies 20(5), 1503-1546. Shows how selling options can raise a Sharpe ratio without adding skill.
- Bailey, D. H. and López de Prado, M. (2012). The Sharpe Ratio Efficient Frontier. Journal of Risk 15(2). Introduces the probabilistic Sharpe ratio, corrected for track-record length, skew and kurtosis.
- Deribit Insights (2025). What to Expect from a Regulated Environment. Deribit Insights, 3 January 2025. States that the Deribit FZE licence covers all investor classes for spot products and qualified and institutional investors for derivatives.
- VARA (2026). Deribit FZE, Public Register. Virtual Assets Regulatory Authority, Dubai. Lists Exchange Services including exchange-traded derivatives, permitted for institutional, qualified and retail investors, the derivatives for retail under a limited licence approval.
- Deribit (2026a). Restricted Jurisdictions. Deribit Support. Lists the jurisdictions Deribit does not serve or serves for spot products only. The United Kingdom is closed to retail clients.
- Deribit (2026b). Inverse Options. Deribit Support. BTC options are settled in BTC; standard initial margin for a short option is the larger of 0.15 less the out-of-the-money amount over the underlying price, and 0.10, plus the option's mark price, in BTC per contract.
- Deribit (2026c). public/get_instruments, BTC options. Deribit API v2, read 27 October 2026. Every BTC option listed with a contract size of 1 BTC, a minimum order of 0.1 BTC, a tick of 0.0001 BTC and settlement in BTC.
- Deribit (2026d). Fees. Deribit Support. Block trade fee for options 0.03%.
- Deribit (2026e). Block Trading. Deribit Support. Minimum block of 25 BTC for BTC options; Block RFQs sent to several market makers at once.
- Breeden, D. T. and Litzenberger, R. H. (1978). Prices of State-Contingent Claims Implicit in Option Prices. The Journal of Business, 51(4), 621 to 651. Shows that the second derivative of the call price with respect to the strike gives the price of a claim paying if the underlying finishes at that level, the basis for reading strike derivatives as a density.
- Bandi, F. M., Fusari, N. and Renò, R. (2024). 0DTE Option Pricing. Working paper, first draft 7 July 2023, revised 19 February 2024. Describes the growth of zero-days-to-expiry index options, derives closed-form pricing for ultra-short tenors and estimates the risk premia they carry.
- Deribit Insights (2020). Option Profit/Loss Calculation Examples. Deribit Insights, 21 October 2020. Works through option payoffs on Deribit and states that the delivery price is a 30-minute time-weighted average of the Deribit index.
- Cayø Largo (2026). Where the ETH Gamma Wall Cracks: Finding the Breakout Strike. Derives Lightning Greek from Dual Gamma and reads the two maps side by side.
- Cayø Largo (2026). Does Max Pain Work on Deribit Options? Tests the max pain strike against 919 expiries.
Disclaimer
This article is published by Halcyon Waters sp. z o.o. (Cayo Largo) for general information and educational purposes only. It is a study of an options strategy on historical data. It is not investment advice, not a personal recommendation, not an offer or solicitation to buy or sell any financial instrument, and not an inducement to enter into any transaction.
Cayo Largo is a data and analytics provider. It is not a broker, an investment adviser, or a portfolio manager. It does not execute trades or hold client funds, and nothing here is tailored to the circumstances, objectives, or risk tolerance of any reader. You are solely responsible for your own decisions and should seek independent professional advice before trading.
Options and other derivatives are high-risk instruments. They can move sharply, can expire worthless, and can lose more than the amount committed. You can lose your entire investment.
Any performance shown is hypothetical and backtested. It is calculated with the benefit of hindsight over past data and does not represent actual trading. Fees, funding, slippage and liquidity are modelled only as far as the article states, and the ability to enter or exit at the prices shown is not guaranteed. Hypothetical results have inherent limitations and frequently differ from results actually achieved. Past performance is not indicative of future results.
Market data, including data sourced from Deribit, is believed to be reliable but is not guaranteed to be accurate or complete. Cayo Largo accepts no liability for any loss arising from the use of this material.
Frequently Asked Questions
What does an orange strike on Cayø Largo's Lightning Greek map mean?
Lightning Greek per contract is the same for a call and a put at one strike. For an expiry a few hours away it is negative above spot and positive below it. The map subtracts puts from calls, weighted by open interest, so a strike turns orange only when the in-the-money side holds more contracts than the out-of-the-money side. On BTC daily expiries this reading held on 99.3 to 99.4% of near-money strikes.
What is the calm-morning check?
At 04:00 UTC, compare the realised volatility of BTC over the last four hours with the at-the-money implied volatility of the expiry settling at 08:00. If realised is at or below implied, the morning is calm and the options are priced for more movement than the market is showing. The strategy only sells on calm mornings.
How did the calm-morning Lightning Greek strategy perform in 2026?
On BTC daily expiries from 27 March to 26 October 2026, one contract per leg sold at the bid with Deribit fees, it traded 87 calm mornings, won 70 of them and made 2,331 USD. Its worst expiry and its worst drawdown were both 980 USD. It made money in six of eight months. These are historical results, not a forecast.
When does the strategy lose money?
Mostly when a strike is sold at or very near the money and BTC then moves about the full range the options priced for the next four hours, or when one side has no bid and the other leg carries the morning alone. Its worst morning in the measured period was 23 June 2026, at 980 USD.
How does the strategy compare with a short straddle or an iron condor?
On the same BTC mornings from 27 March to 26 October 2026, entered four hours before the 08:00 UTC settlement with one contract per leg, a short straddle lost 7,248 USD, a daily iron condor 5,047 USD and a short strangle 394 USD. The calm-morning Lightning Greek strategy made 2,331 USD with a worst drawdown of 980 USD. These are historical results on one market, not a forecast.
How does Deribit settle daily options?
Deribit daily options expire at 08:00 UTC and settle in cash on a 30-minute time-weighted average of its index, taken between 07:30 and 08:00 UTC. Nothing is delivered. The holder of an in-the-money option receives the difference between that average and the strike.
Related Articles
Where the ETH Gamma Wall Cracks: Finding the Breakout Strike
You open the Dual Gamma heatmap for ETH and see a thick wall at $2,100. Impenetrable. Switch to Lightning and the wall shows where it cracks.
Does Max Pain Work for Deribit Options?
Traders have argued about max pain for six years without measuring it. We took 919 Deribit options expiries across six coins and read the max pain strike six hours before each settlement. Then we asked a simple question: did the coin settle nearer to that strike, or nearer to the price it was already trading at when we read it? It settled nearer to the trading price, on every coin. Max pain pulls price a little, one day before expiry. By the last hours the pull is gone.