Front-Week Skew Does Not Lead Longer Expiries On Deribit
Four of six Deribit books opened this morning with front-week skew priced further above the longer expiries than on 91% of days since January. Desks act on readings like that. We tracked both legs forward from all 490 occasions the gap ran wide, six coins over 251 days, reading the nearest weeklies against the two-to-three-week expiries. Then we asked which side closes it: do the longer expiries catch up to the front week, or does the front week come back? The front week comes back. It does so inside two days, on more than four in five episodes, while the longer book barely moves. Deribit's own listing calendar does not explain it.
This morning four of the six coin books on Deribit have their front-week skew sitting further above the longer expiries than it has on more than 91% of days since January. The front end is leaning bullish. The book behind it is not.
Read the front week alone and you see conviction. Read the longer expiries and you see nothing worth acting on. We measured which of the two is worth following, across 251 days and six coins, and the answer does not change by coin: the front leg comes back, and the longer expiries never move to meet it.
In this note we will define the instrument, show what the two expiry buckets actually hold, then track both legs forward from every extreme reading in the archive. After that we will try to break the result against Deribit's own listing calendar. What survives is a rule about which tenor carries information, and a plain account of where that rule stops.
Readers who already work with risk reversals daily can skip the next two sections and start at Which Leg Closes the Gap?
What a Risk Reversal Prices?
A risk reversal is the price of asymmetry. It is what the market charges for upside exposure minus what it charges for downside protection, measured in implied volatility rather than in money. When it is negative, puts cost more than calls and the book is paying for crash protection. When it is positive, calls cost more and the book is paying to chase.
To turn that idea into a number you need two specific options, one on each side of spot, and the market picks them by delta.
Delta, And Why The Wings Are Quoted In It
Delta is the rate at which an option's value moves with spot, . A call's delta runs from 0 up to 1 as it goes from far out of the money to deep in. A put's runs from -1 up to 0. At a shared strike and expiry the two differ by exactly one, which this archive confirms across all 396 matched pairs on the morning in question, to within three parts in a hundred thousand. Put-call parity, holding.
Delta carries a second reading that desks use constantly: it sits close to the market's implied probability that the option finishes in the money. A delta of 0.25 is shorthand for roughly a one-in-four chance.
So the two options that define the quote are these. The 25-delta call is the call whose delta is 0.25, struck above spot, out of the money, with about a one-in-four chance of expiring in the money. The 25-delta put is its mirror on the downside, delta -0.25, struck below spot, the same one-in-four reading. On the BTC expiry in Figure 1 they sit at 1.029 and 0.976 times spot. Matched in delta, not in distance from spot.
The risk reversal is the gap between what those two cost:
where is the implied volatility of the option carrying that delta, the call's delta and the put's. Positive means the call is the more expensive of the two.
Why 25 and not 10 or 40? Convention. It is a sound one: far enough from spot to say something about the wings, near enough to stay liquid enough to quote. There is a deeper reason the convention uses delta at all rather than a fixed strike. Delta already has time to expiry and the level of volatility inside it. A strike 3% above spot is remote in a quiet week and almost at the money in a violent one. The 25-delta call is the 25-delta call in both. Same point, either week. That is what makes the quote comparable across tenors and across days, which is precisely what a question about term structure needs.
Keep that property in mind, because it is the one Cayø Largo's published field gives up.
How Cayø Largo Builds the Same Number?
Our field is computed per expiry bucket, every ten minutes, and served from the volatility skew endpoint. Two details matter for reading anything below.
First, the wings are fixed bands of moneyness, not interpolated delta points. The upper band holds every option struck between 1.02 and 1.08 times spot, the lower band every option between 0.92 and 0.98. The field is published as a 25-delta equivalent because those bands sit near the 25-delta point on a typical crypto smile. The construction is a band average, though, and it is anchored to distance from spot rather than to delta, so it does not carry the comparability the previous section described. That is the trade, and it is worth carrying in your head through the rest of the note.
Second, each band is weighted by liquidity, so a strike nobody trades cannot drag the reading:
where is the liquidity weight of option and is one moneyness band. The risk reversal is then the difference between the two bands:
where is that weighted average over the band running from to times spot.
Have a look at both constructions on one morning of real prices, the standard one and ours, before the rest of the note leans on either.
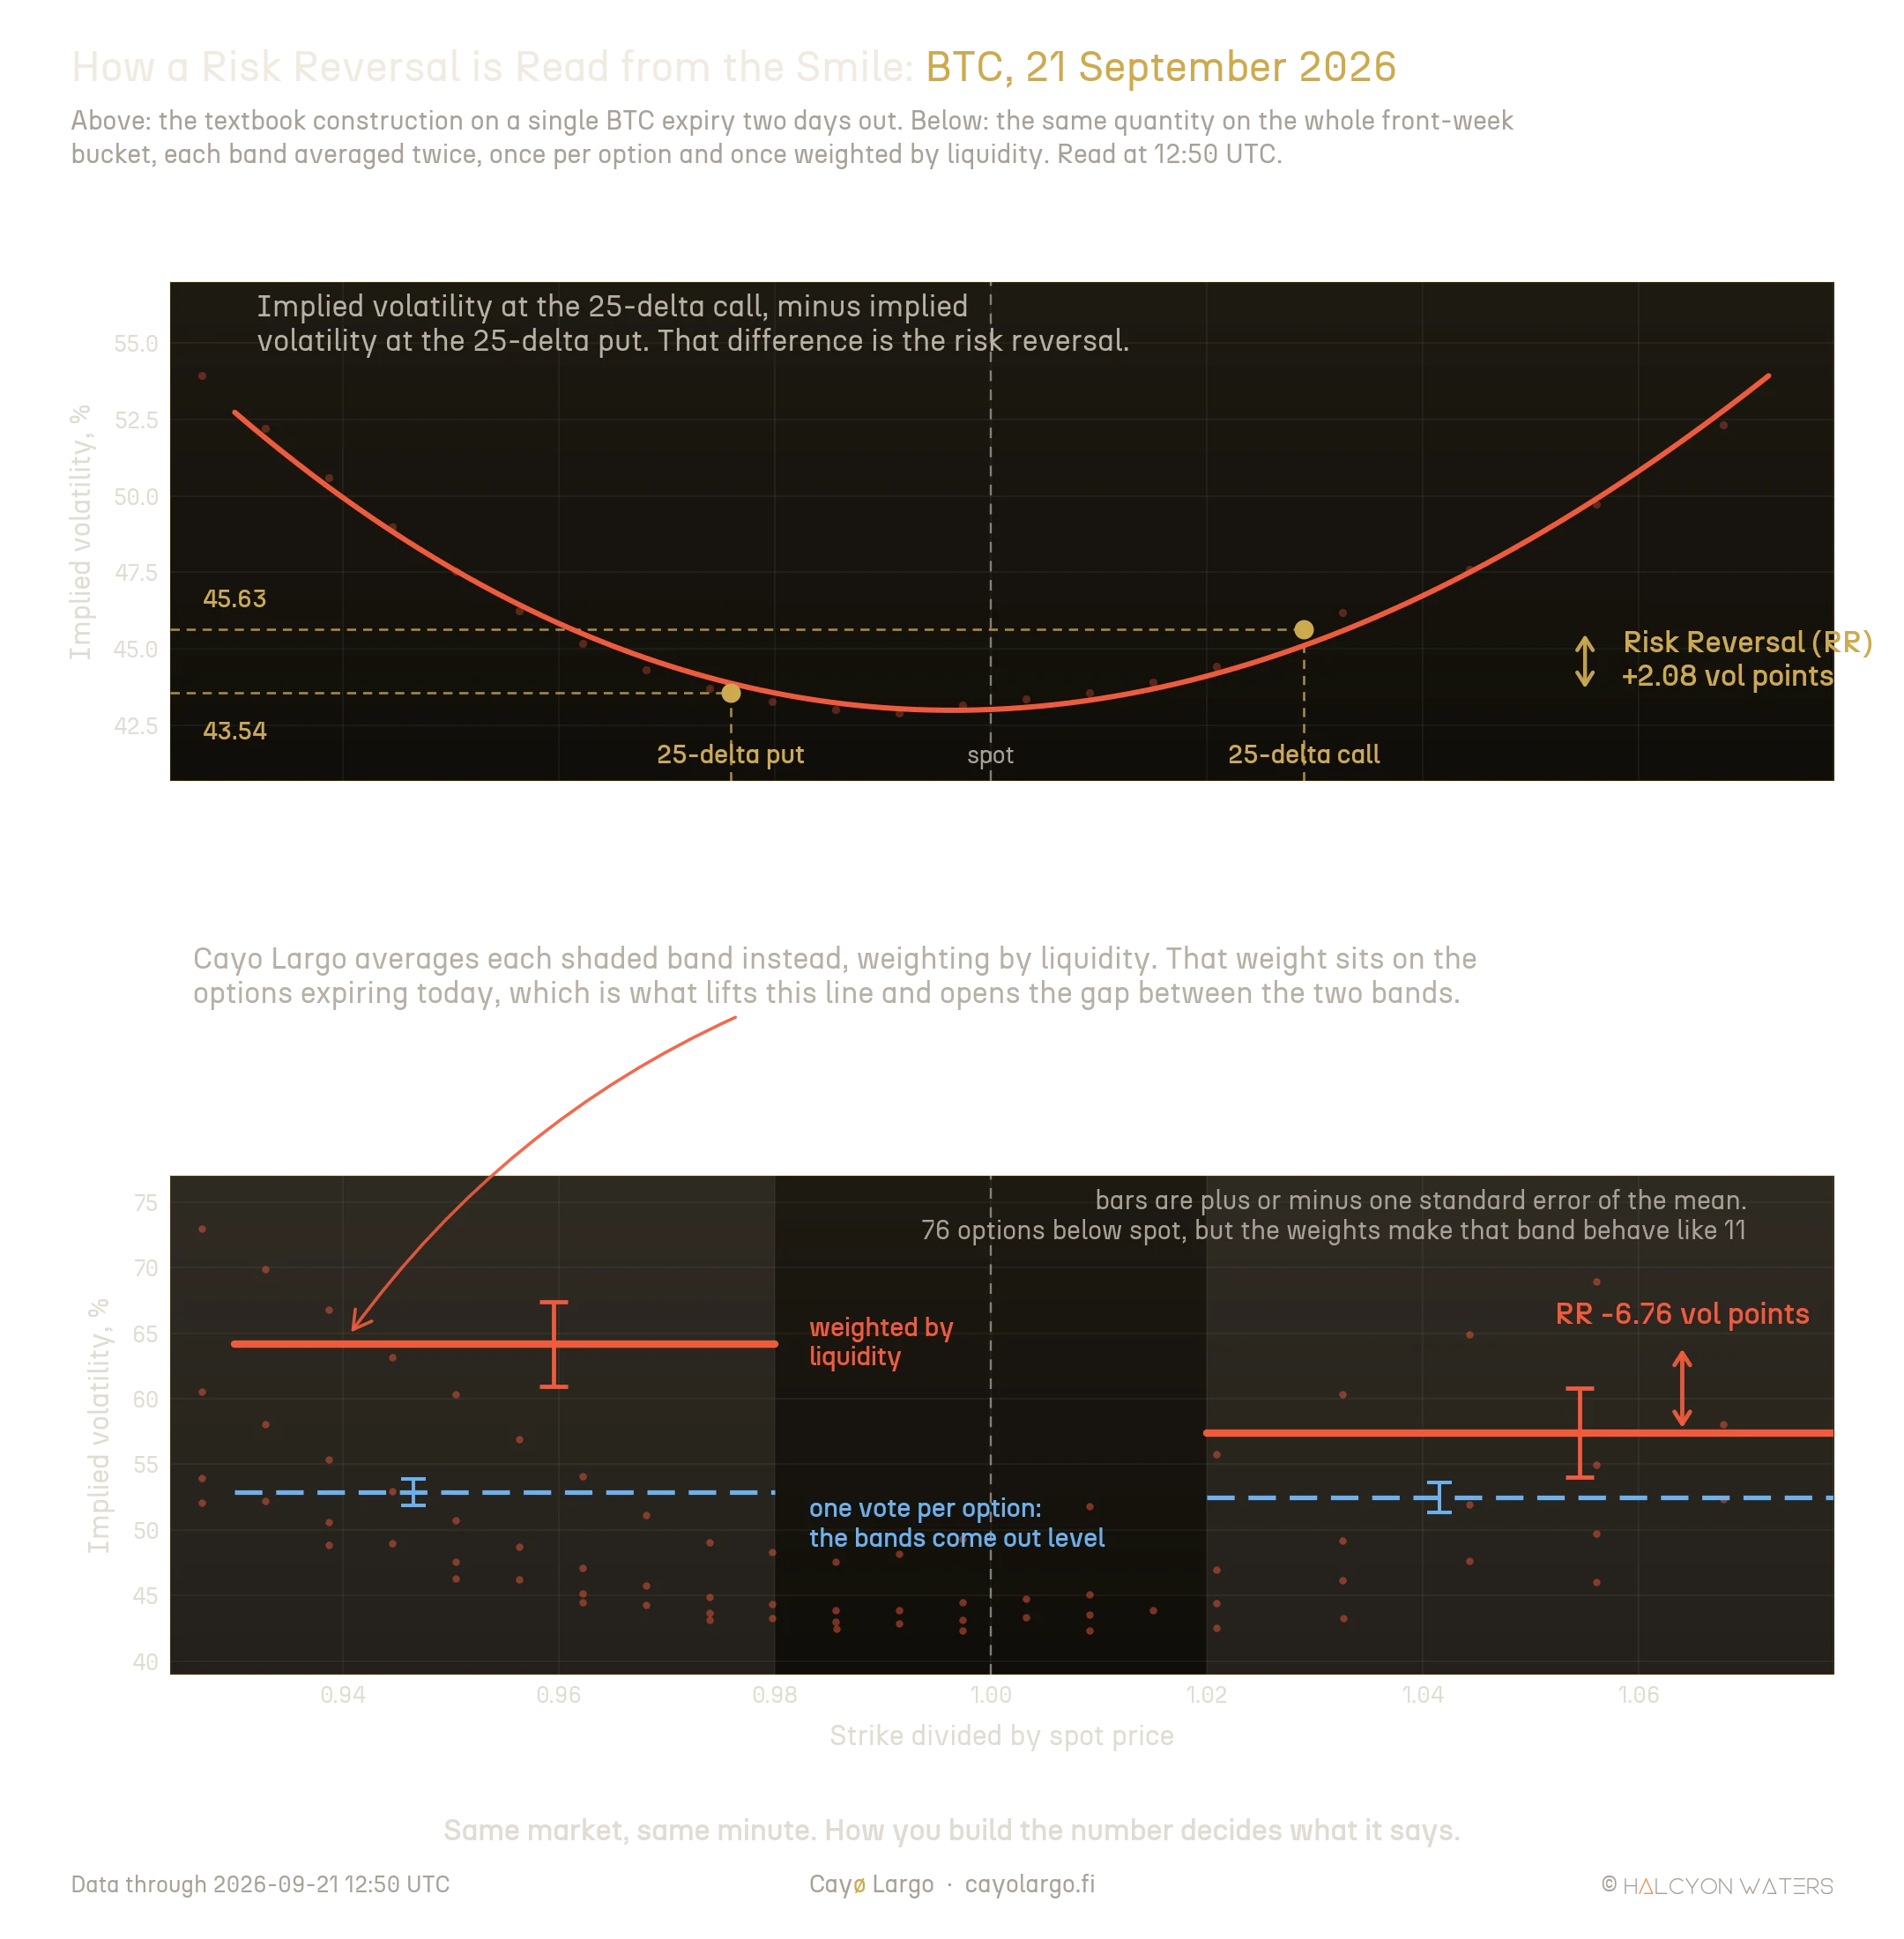
Figure 1: The construction, on one morning of real BTC data. Above, the textbook reading on a single expiry: the implied volatility at the 25-delta call minus the one at the 25-delta put. Below, the same quantity from two fixed bands of moneyness. Weighting those bands by liquidity moves the answer from minus 0.38 to minus 6.76, and triples the error bars doing it.
The plate makes the distinction concrete. On that expiry the 25-delta put sits at 0.976 times spot and the 25-delta call at 1.029, so both land near the inner edge of their band rather than in the middle of it. Read the textbook way, that expiry's risk reversal is +2.08. Read the whole front-week bucket with one vote per option and it is -0.38. Weight the same bucket by liquidity and it is -6.76. Three numbers, one market, one minute.
The rest of this note uses the third, because that is the one the archive stores and the one a subscriber receives. It is also the honest one for this purpose: an option nobody trades should not get an equal say in what the market is charging.
That choice is not free, and the error bars in Figure 1 are where it shows. Concentrating the weight on a handful of liquid contracts shrinks the effective sample. The band below spot holds 76 options, but after weighting it behaves like 11, and its standard error widens from 0.99 to 3.23 vol points. A single ten-minute reading of the risk reversal is therefore a noisy estimate, which is exactly why nothing below rests on one. Every finding in this note is an average over hundreds of daily readings.
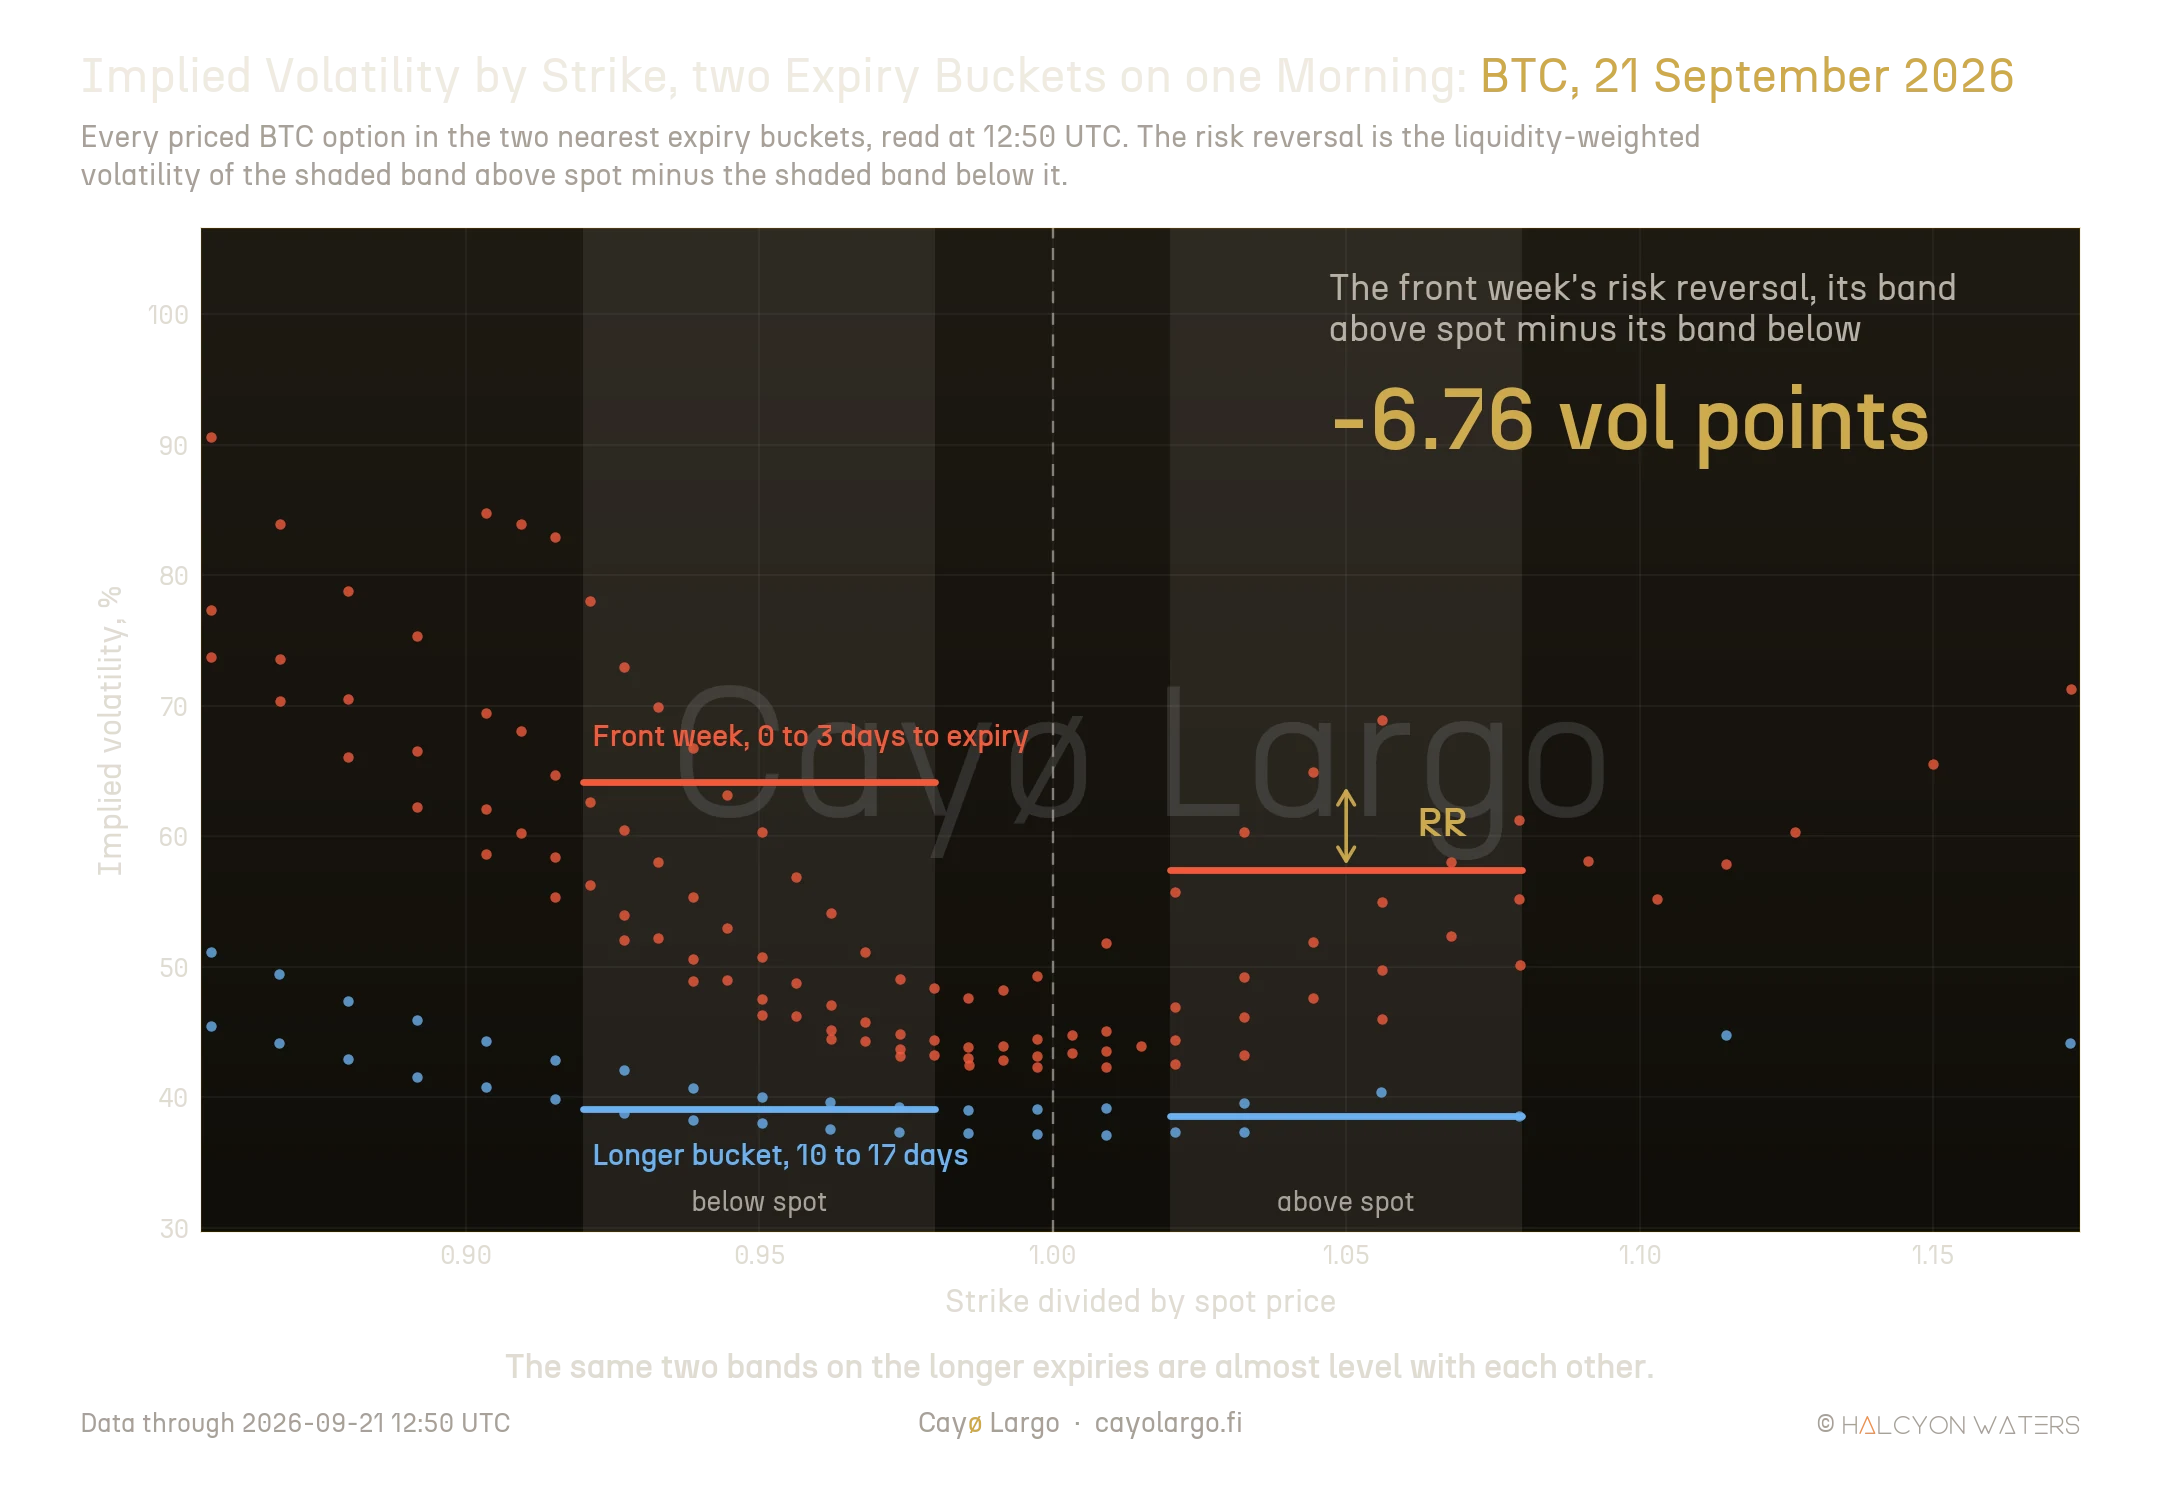
Figure 2: Both expiry buckets at 12:50 UTC on 21 September 2026. Shaded columns are the two moneyness bands, horizontal lines each bucket's liquidity-weighted average inside them. The front week charges 6.76 vol points more for downside than upside. The longer expiries charge 0.57.
The picture is the whole argument in one frame. The front week's smile is steep and its wings are expensive. The longer expiries are nearly flat. Both are reading the same coin at the same instant.
The Two Buckets Are Not Seven Days And Thirty
Their names suggest otherwise, so it is worth stating plainly before you rest a number on it. Measured across the whole of 2026, the front bucket averages 2.6 to 3.0 days to expiry and the bucket behind it averages 14.3 to 16.1 days. On Bitcoin the second one ranges from 10 to 24 days as Deribit's listing calendar rolls. The honest description is the nearest weeklies against the two-to-three-week expiries.
There is a sharper version of the same point. Inside the front bucket's downside wing, 75.5% of the liquidity weight sits on options expiring the same day. Hours, not days. The front-week reading is dominated by contracts with almost no life left in them, which is exactly where a smile is most violent and least anchored. Across the window the two buckets sit like this:
| Coin | Days | Front tenor | Back tenor | Mean gap | Mean |gap| | Positive |
|---|---|---|---|---|---|---|
| BTC | 252 | 2.7 d | 16.1 d | -4.31 | 6.05 | 24.2% |
| ETH | 252 | 2.6 d | 16.1 d | -3.34 | 5.05 | 27.4% |
| TRX | 250 | 3.0 d | 14.3 d | -1.00 | 2.46 | 36.0% |
| AVAX | 246 | 2.8 d | 14.8 d | -3.80 | 4.71 | 19.1% |
| SOL | 231 | 2.9 d | 14.7 d | -3.01 | 4.01 | 23.8% |
| XRP | 225 | 3.0 d | 14.7 d | -2.56 | 3.86 | 24.9% |
One reading per coin per day, taken at 08:00 UTC, 13 January to 21 September 2026. The gap is the front bucket's risk reversal minus the longer bucket's, in vol points. 97% of readings carry a COMPLETE coverage tier; TRX is the weakest at 85.2%.
The gap is normally negative, which says the front week carries more put skew than the longer expiries on every coin in the complex. It runs positive roughly a quarter of the time, and on AVAX less than a fifth. That is the baseline: a positive gap is the exception. The rest of this note is about what happens when the exception arrives, and what happens when the usual state goes to an extreme.
Which Leg Closes the Gap?
We took two thresholds, a gap above +3 and a gap below -5, and tracked both legs separately for the next seven days. The question is not whether the gap closes. It is which side does the closing.
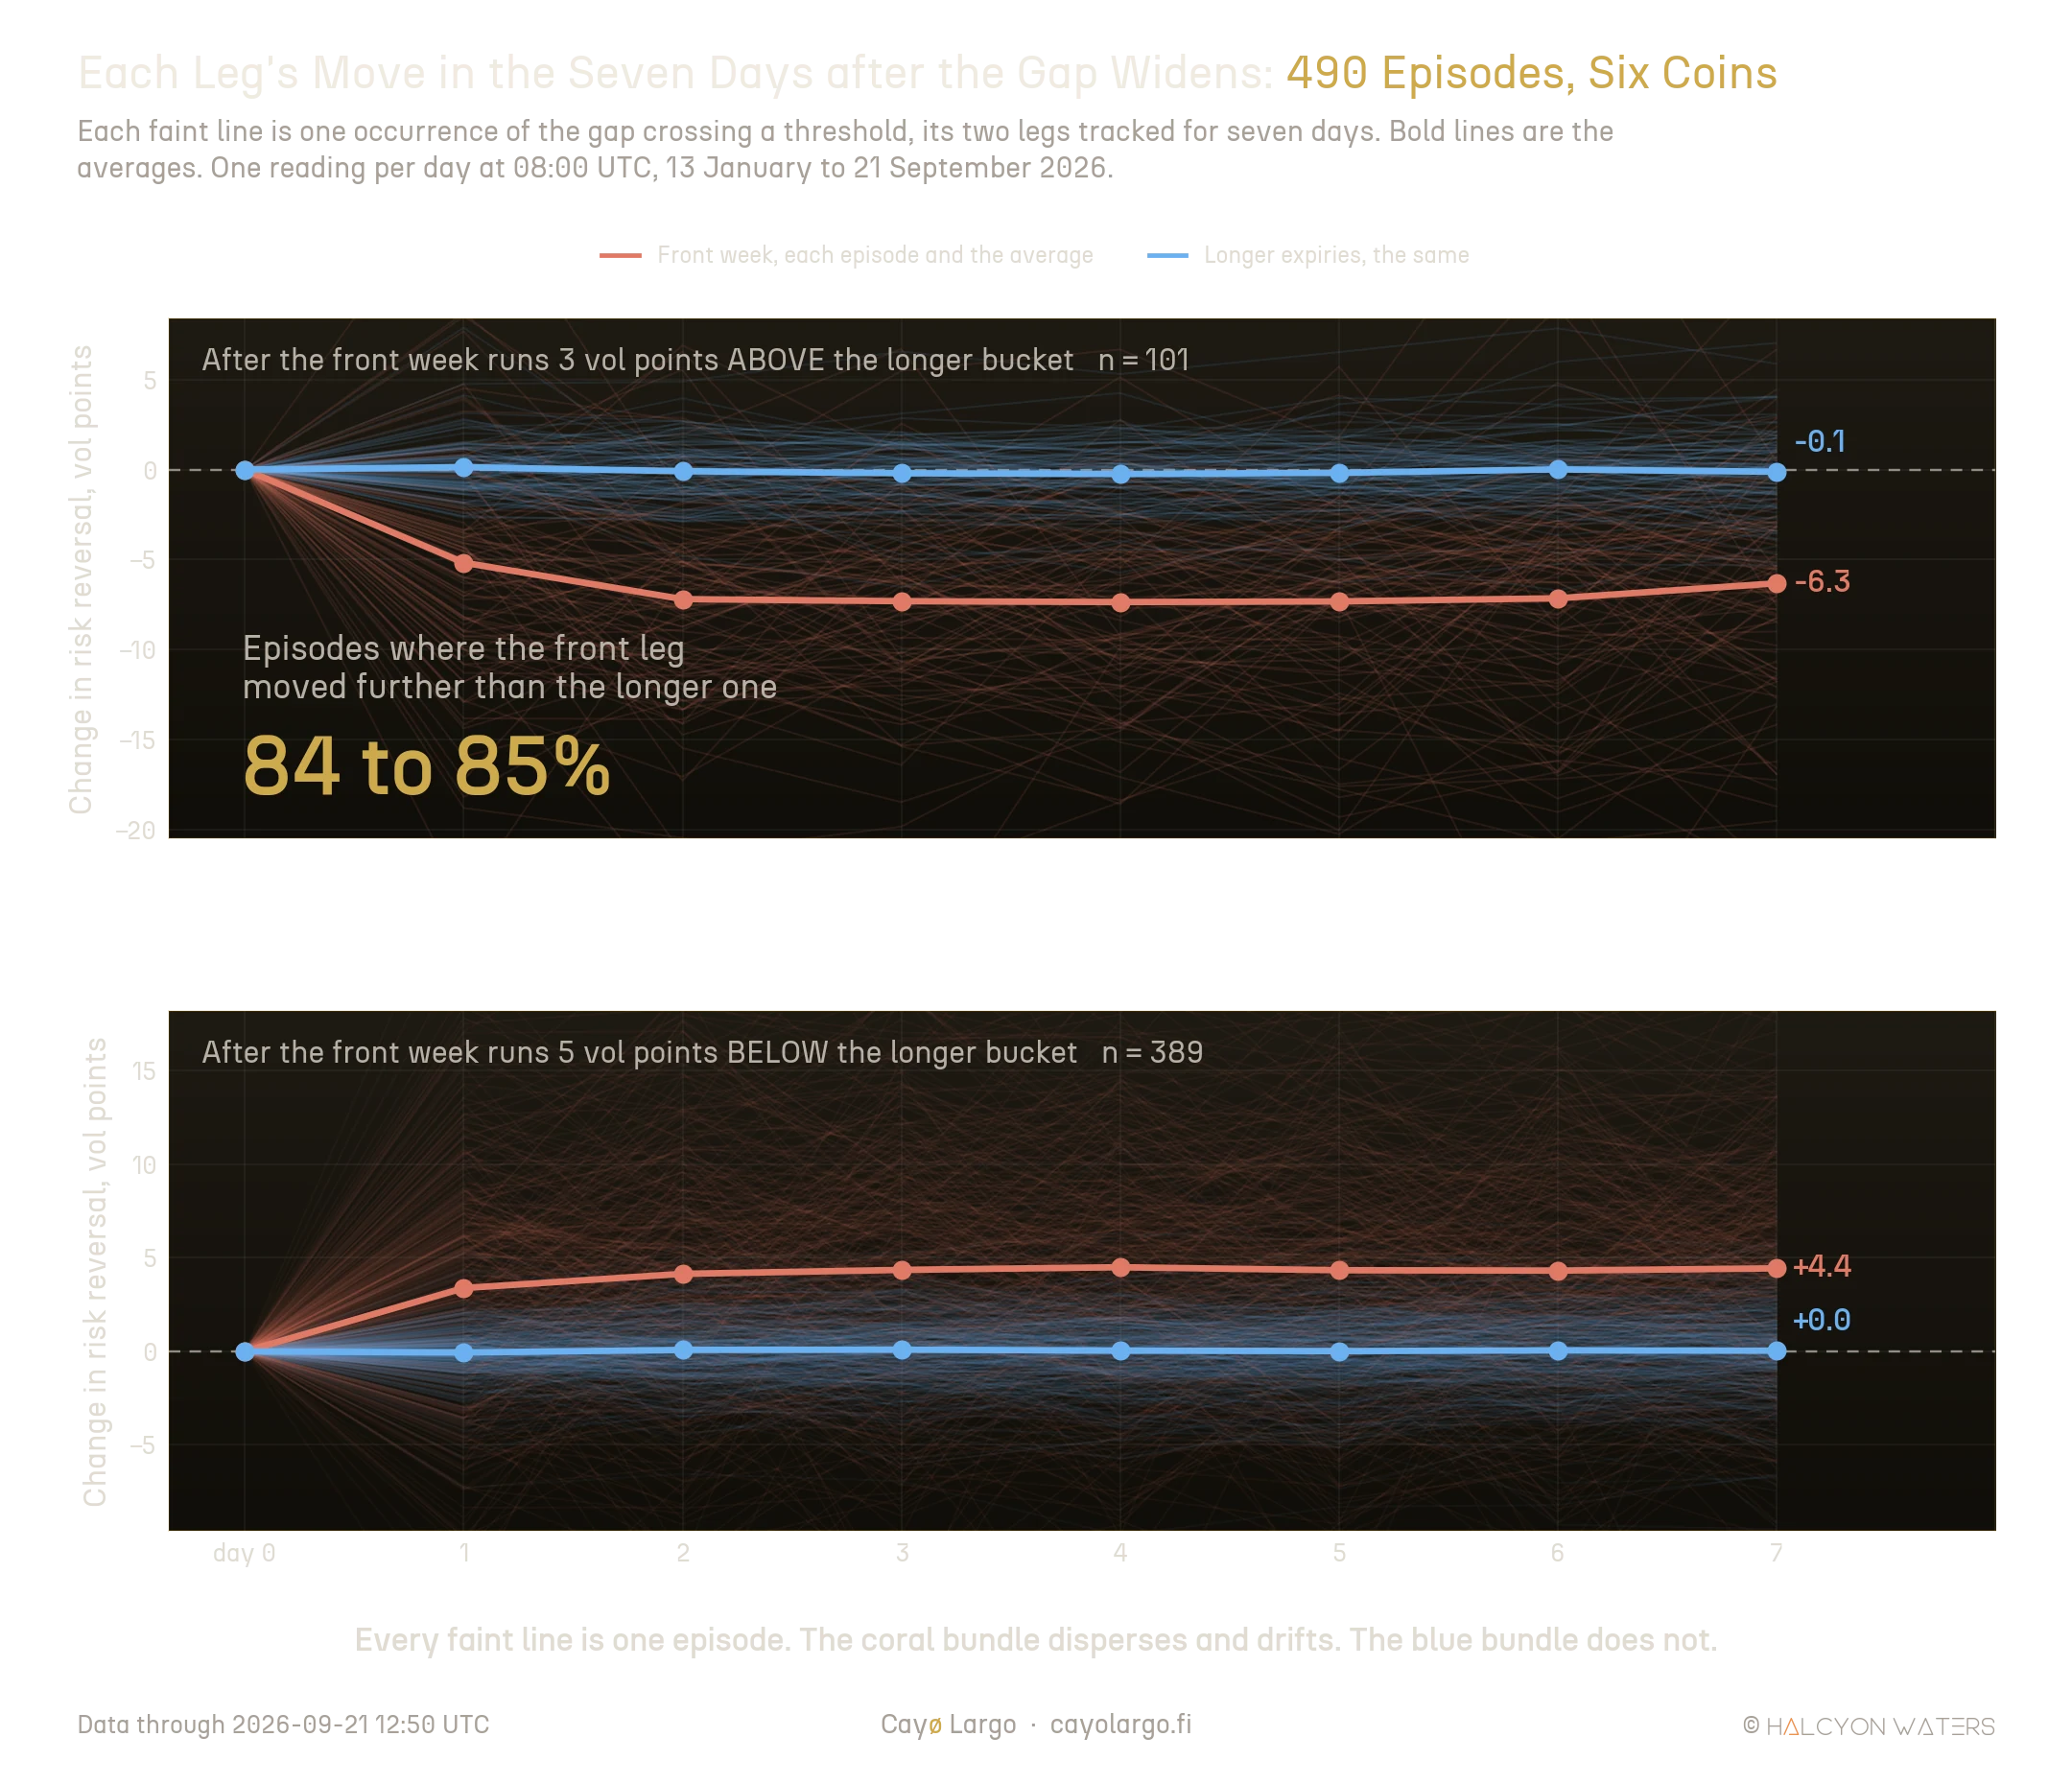
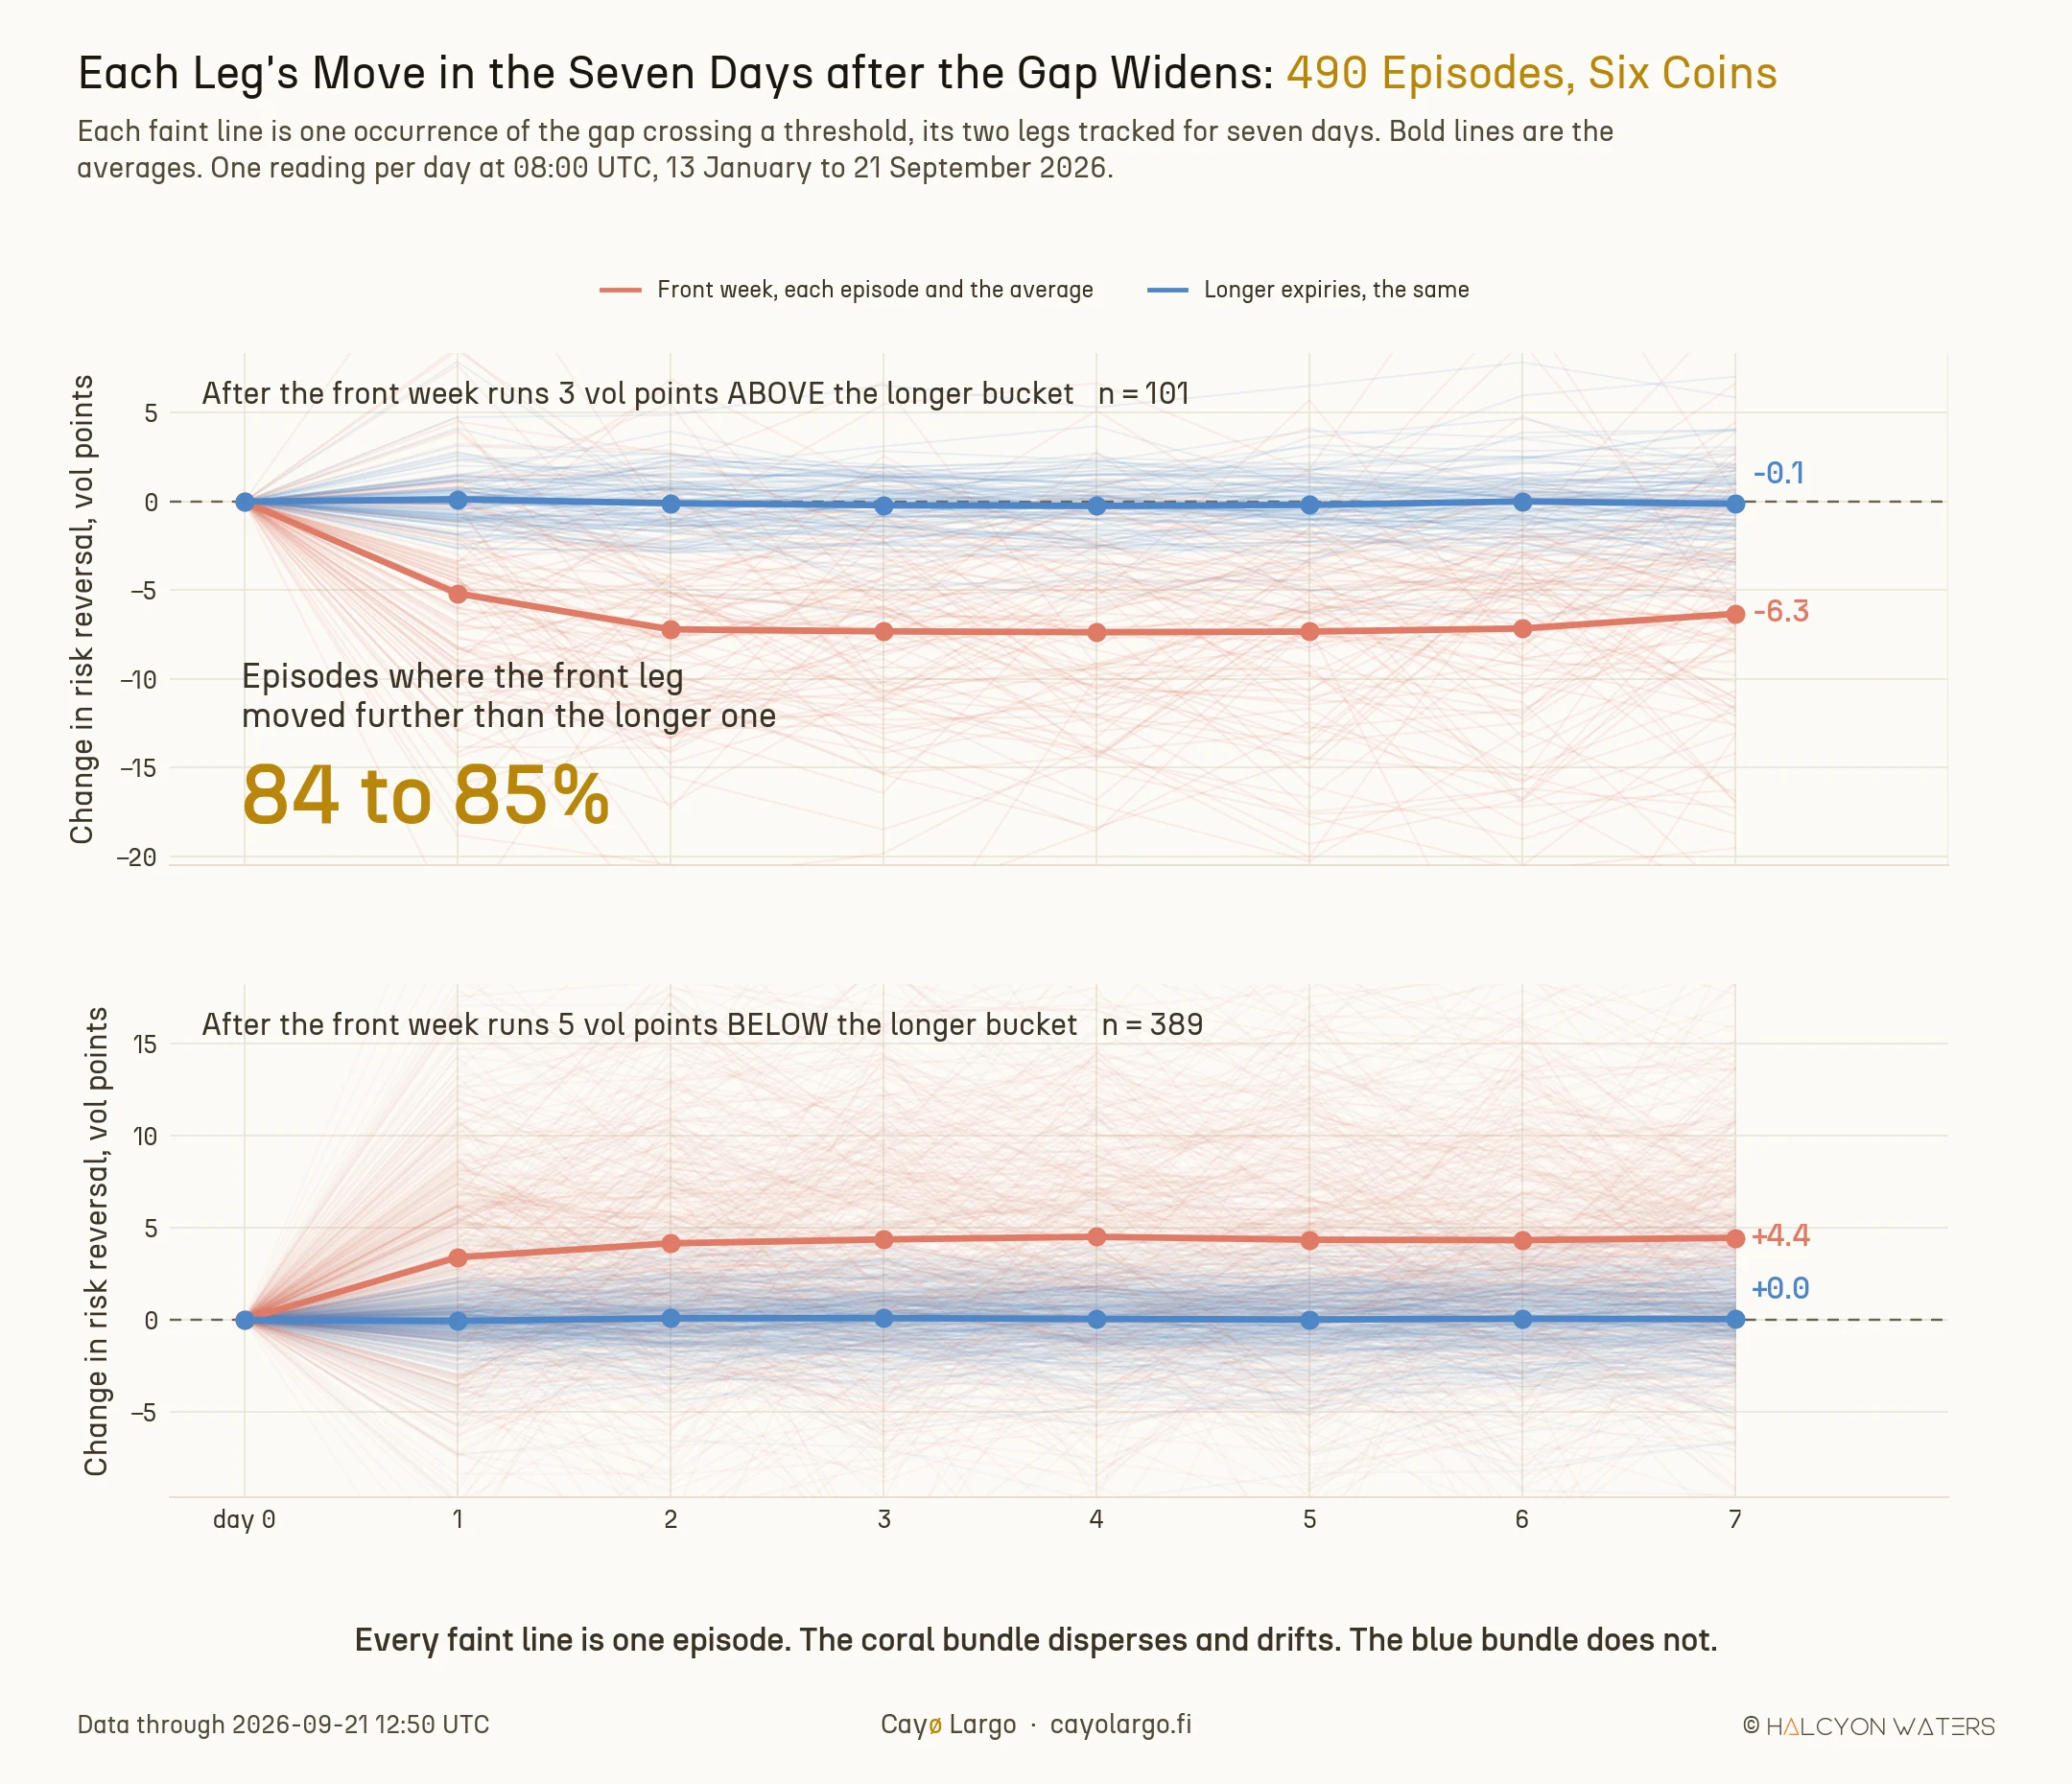
Figure 3: Every episode behind the averages. Each faint line is one occurrence of the gap crossing a threshold, both legs tracked for seven days; bold lines are the averages. All 980 lines start at zero by construction. Only one bundle leaves.
The blue line is the finding. Pooled across the six coins, the longer expiries never move more than a quarter of a vol point at any of the seven days, in either direction. The coral line does everything. Coin by coin the same holds on the four deep books; the exceptions are SOL and AVAX at the positive threshold, where seven and twelve episodes are too few to pin an average down.
An average can hide almost anything, so the plate draws every episode underneath it. The two bundles differ as bundles, not only in their means. The coral one fans out on the first day and keeps spreading. The blue one stays a tight ribbon around zero for the whole week.
Counted episode by episode rather than averaged, the front leg moved further than the longer leg in 85.1% of the 101 positive-gap episodes and 84.3% of the 389 negative ones. The longer leg, meanwhile, is a coin toss: it moved in the direction that would close the gap in 51.5% and 53.7% of episodes. That is the fingerprint of a series with no tendency at all, what is a stronger statement than a small average.
A binomial test puts a number on both halves. The front leg travelling further is significant at on the 101 positive-gap episodes and on the 389 negative ones. Both are overwhelming. The longer leg's direction fails to separate from a coin toss at and . Both results point the same way: one leg carries the signal and the other carries none. Those p-values assume independent episodes, which overlapping windows do not quite give us, so read them as direction and not as exact size.
A second thing falls out of the shape. By the second day the front leg has already made its move. On the larger sample it stands at 93% of its seven-day distance by then. On the smaller one it has overshot and comes partway back. Seven days is a generous horizon, not a tight one, and a shorter one would have made this look stronger rather than weaker. Coin by coin, the decomposition reads:
| Coin | n | Gap change | Front leg | Back leg | Front's share | Narrows |
|---|---|---|---|---|---|---|
| Gap above +3, the front week unusually call-skewed | ||||||
| BTC | 23 | -8.14 | -8.12 | +0.02 | 99.8% | 65.2% |
| ETH | 27 | -5.73 | -6.24 | -0.51 | 92.4% | 63.0% |
| TRX | 21 | -6.69 | -6.58 | +0.11 | 98.4% | 95.2% |
| XRP | 14 | -4.20 | -4.19 | +0.01 | 99.9% | 71.4% |
| AVAX | 12 | -3.95 | -2.93 | +1.02 | 74.3% | 66.7% |
| SOL | 7 | -7.65 | -9.91 | -2.27 | 81.4% | 100% |
| Gap below -5, the front week unusually put-skewed | ||||||
| BTC | 114 | +4.36 | +4.47 | +0.10 | 97.7% | 76.3% |
| ETH | 98 | +3.71 | +4.22 | +0.51 | 89.3% | 71.4% |
| AVAX | 93 | +4.06 | +4.24 | +0.18 | 95.9% | 82.8% |
| SOL | 52 | +3.99 | +3.31 | -0.68 | 82.9% | 75.0% |
| XRP | 49 | +5.27 | +4.47 | -0.79 | 84.9% | 85.7% |
| TRX | 17 | +6.80 | +6.73 | -0.06 | 99.1% | 100% |
Changes are in vol points over seven days. "Front's share" is the front leg's move as a fraction of both legs' moves combined. "Narrows" is how often the gap's absolute size was smaller a week later.
The front leg's share runs from 74.3% to 99.9%, and it never drops below three quarters on any coin in either direction. On BTC, XRP and TRX it is effectively the entire move. The consistency matters more than any single figure: twelve coin-and-direction cells, one result.
Why 08:00 UTC, and what a different hour would have said. Every Deribit option settles at 08:00 UTC, so anchoring there reads each coin at the same point in the weekly expiry cycle. It also samples at the exact minute the front bucket rolls, which is the one moment its membership changes. That deserved a check, so we repeated the study at 12:00 and 20:00 UTC. The front leg's share of the move falls from 98 to 100% at 08:00 down to 94 to 96% at the later hours, while the share of episodes in which it travelled further rises from 84 to 86% up to between 86 and 93%. The conclusion does not turn on the anchor. The published hour flatters the first statistic and understates the second.
A mean-reverting extreme in skew is not unique to crypto. OptionMetrics measured gold implied volatility skew at the 90th percentile of its own history during the August 2021 selloff and noted that such extremes frequently resolve against themselves. What Deribit's bucketed archive adds is the decomposition: not that the extreme fades, but which tenor does the fading.
The Weekly Listing Roll Does Not Explain It
There is an obvious way this result could be an artifact and it deserves a proper answer.
Deribit lists a new weekly expiry every Friday. The front bucket therefore has a tenor that sawtooths: it stretches when a new weekly lists and shortens every day until the next one. A smile steepens as expiry approaches, so the front leg's reading should inherit that weekly rhythm. If the gap simply rode the listing calendar, "reverts within seven days" would be a restatement of "the calendar repeats every seven days", and worth nothing.
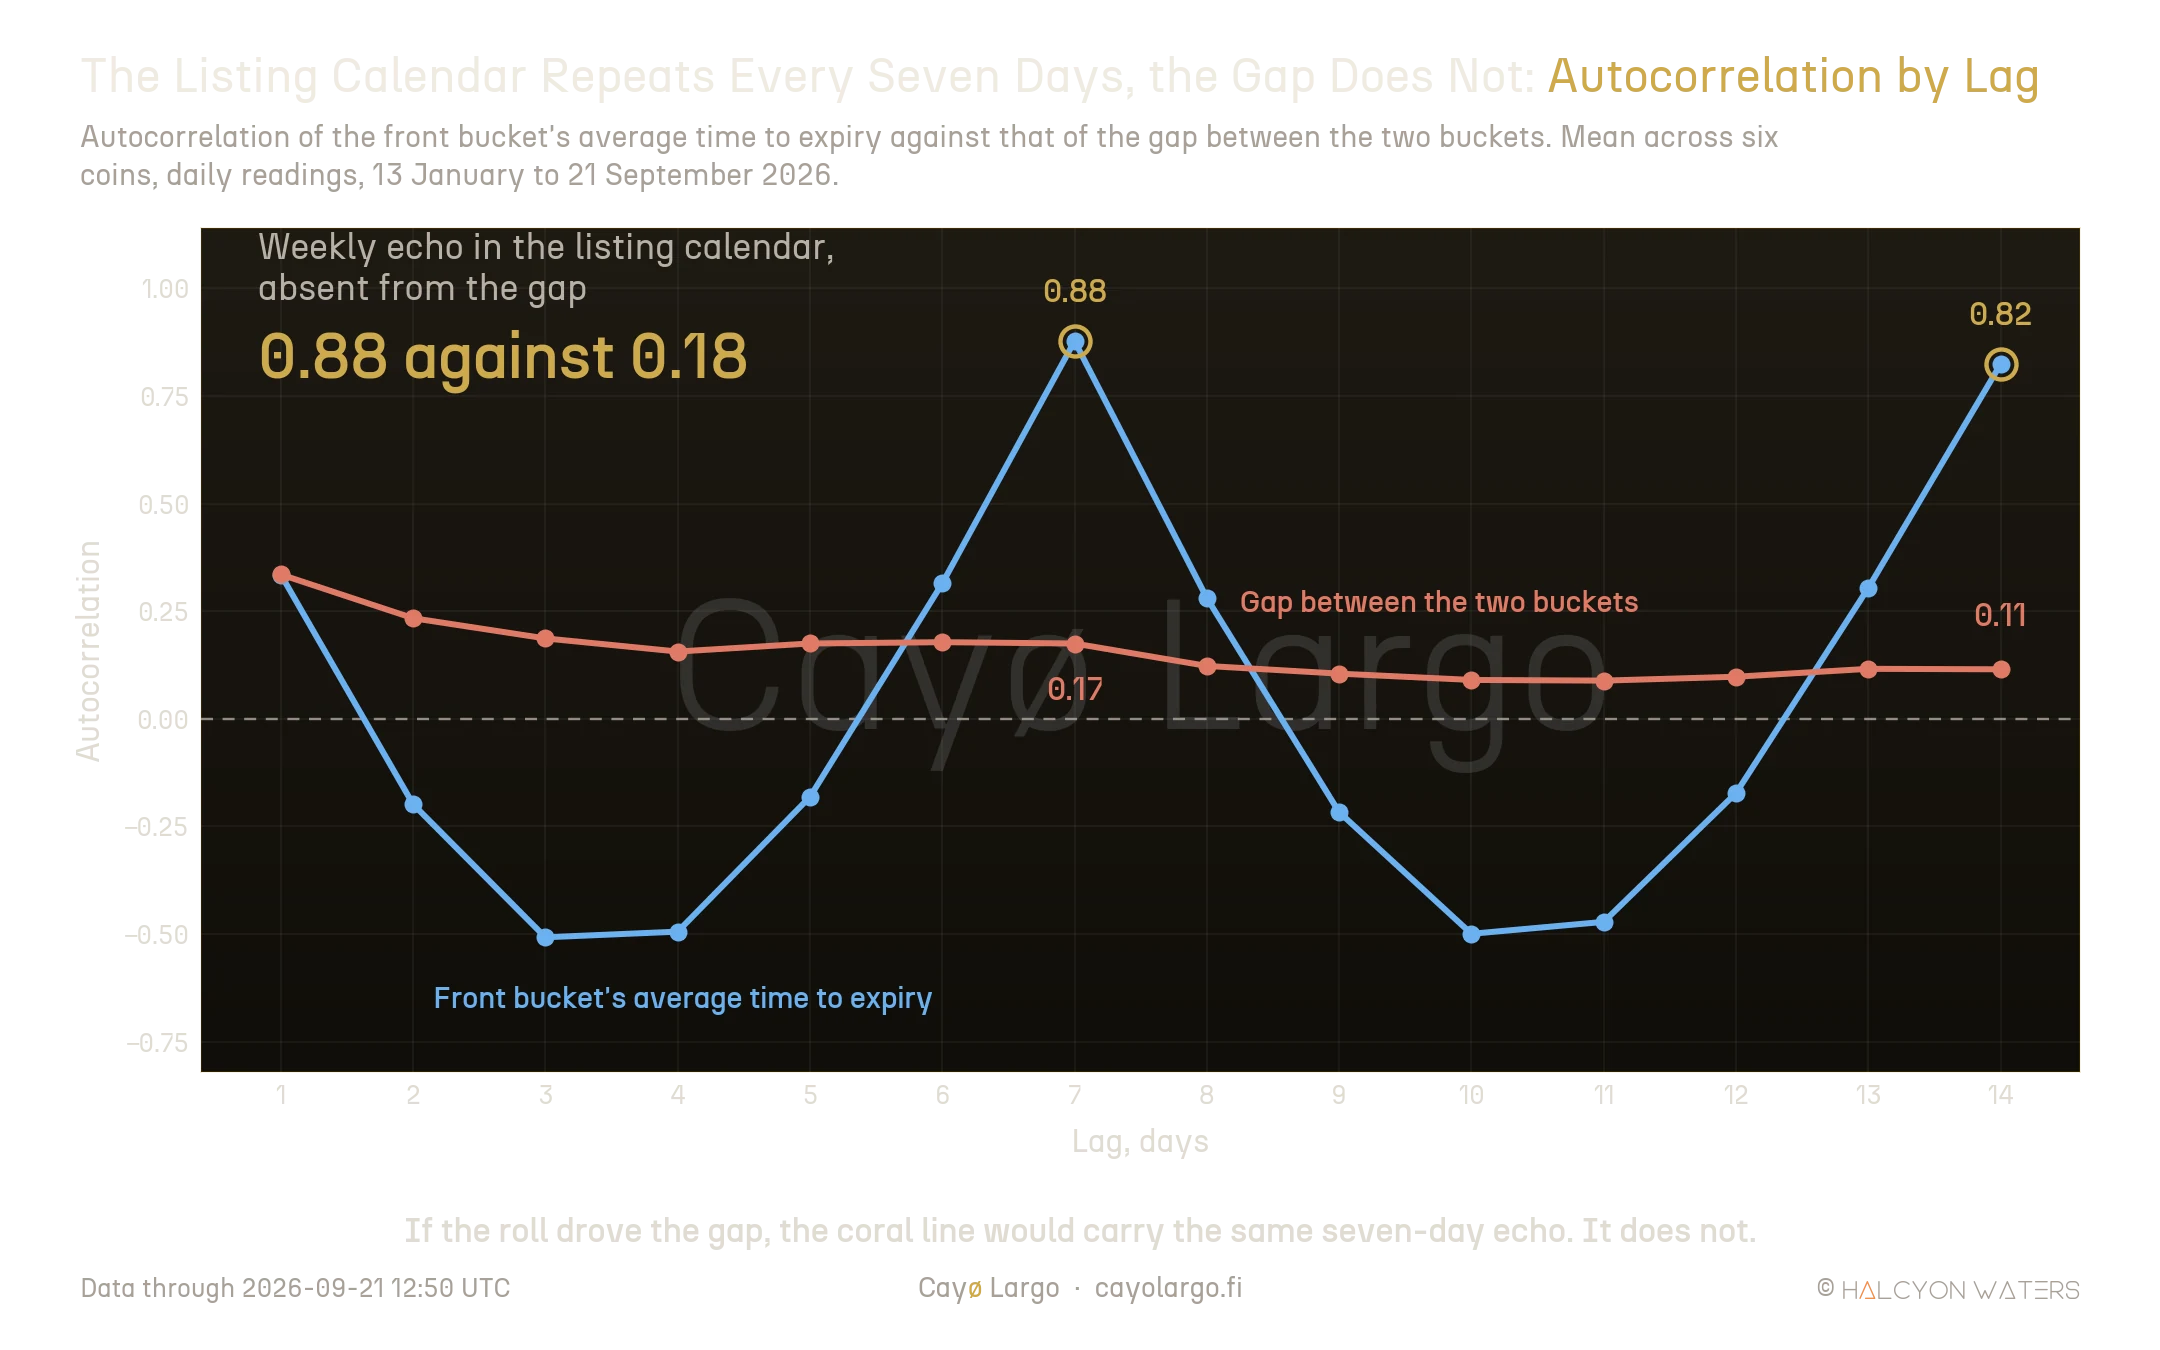
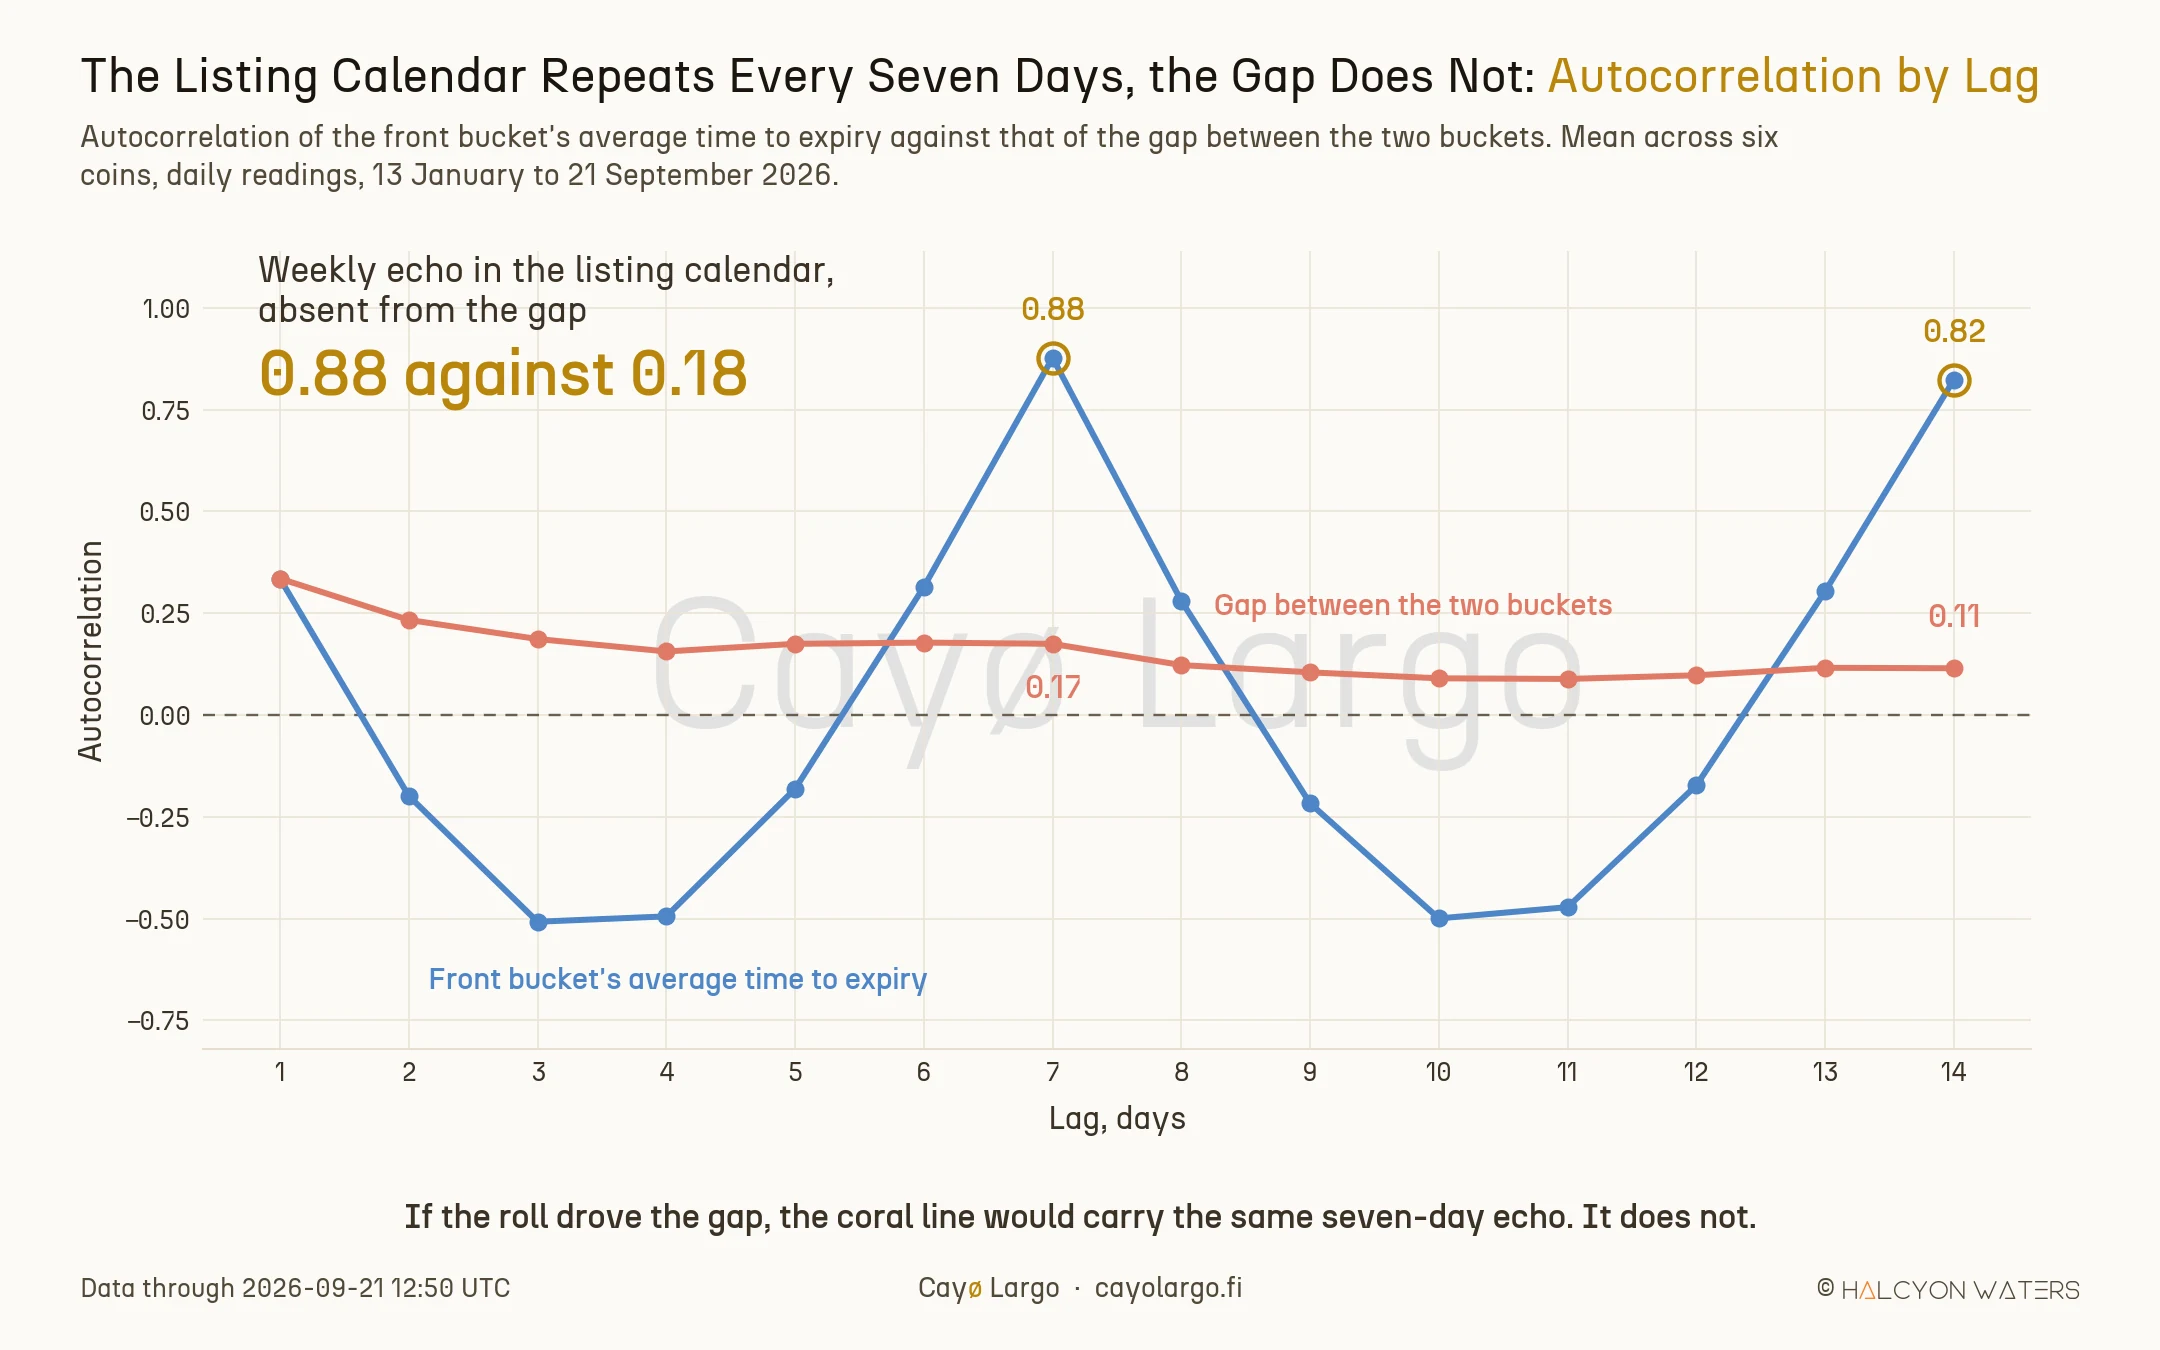
Figure 4: Autocorrelation of the front bucket's average time to expiry, against that of the gap, averaged across six coins. The listing calendar's seven-day signature is unmistakable. The gap carries none of it.
The blue line is as clean a weekly cycle as a time series produces: 0.88 at lag 7 and 0.82 at lag 14, with troughs near -0.5 at lags 3 and 10. The roll is real and it is large.
The gap inherits none of it. Its autocorrelation decays smoothly from 0.34 to about 0.11 and reads 0.175 at lag 7, with no weekly bump whatsoever. Correlation between the gap and the front bucket's own tenor runs from -0.05 to +0.26 across the six coins. A quantity driven by the roll would echo the roll. This one does not, what leaves only one reading: the front leg is reverting from a real repricing, not from a calendar position.
Where the Six Books Sit this Morning?
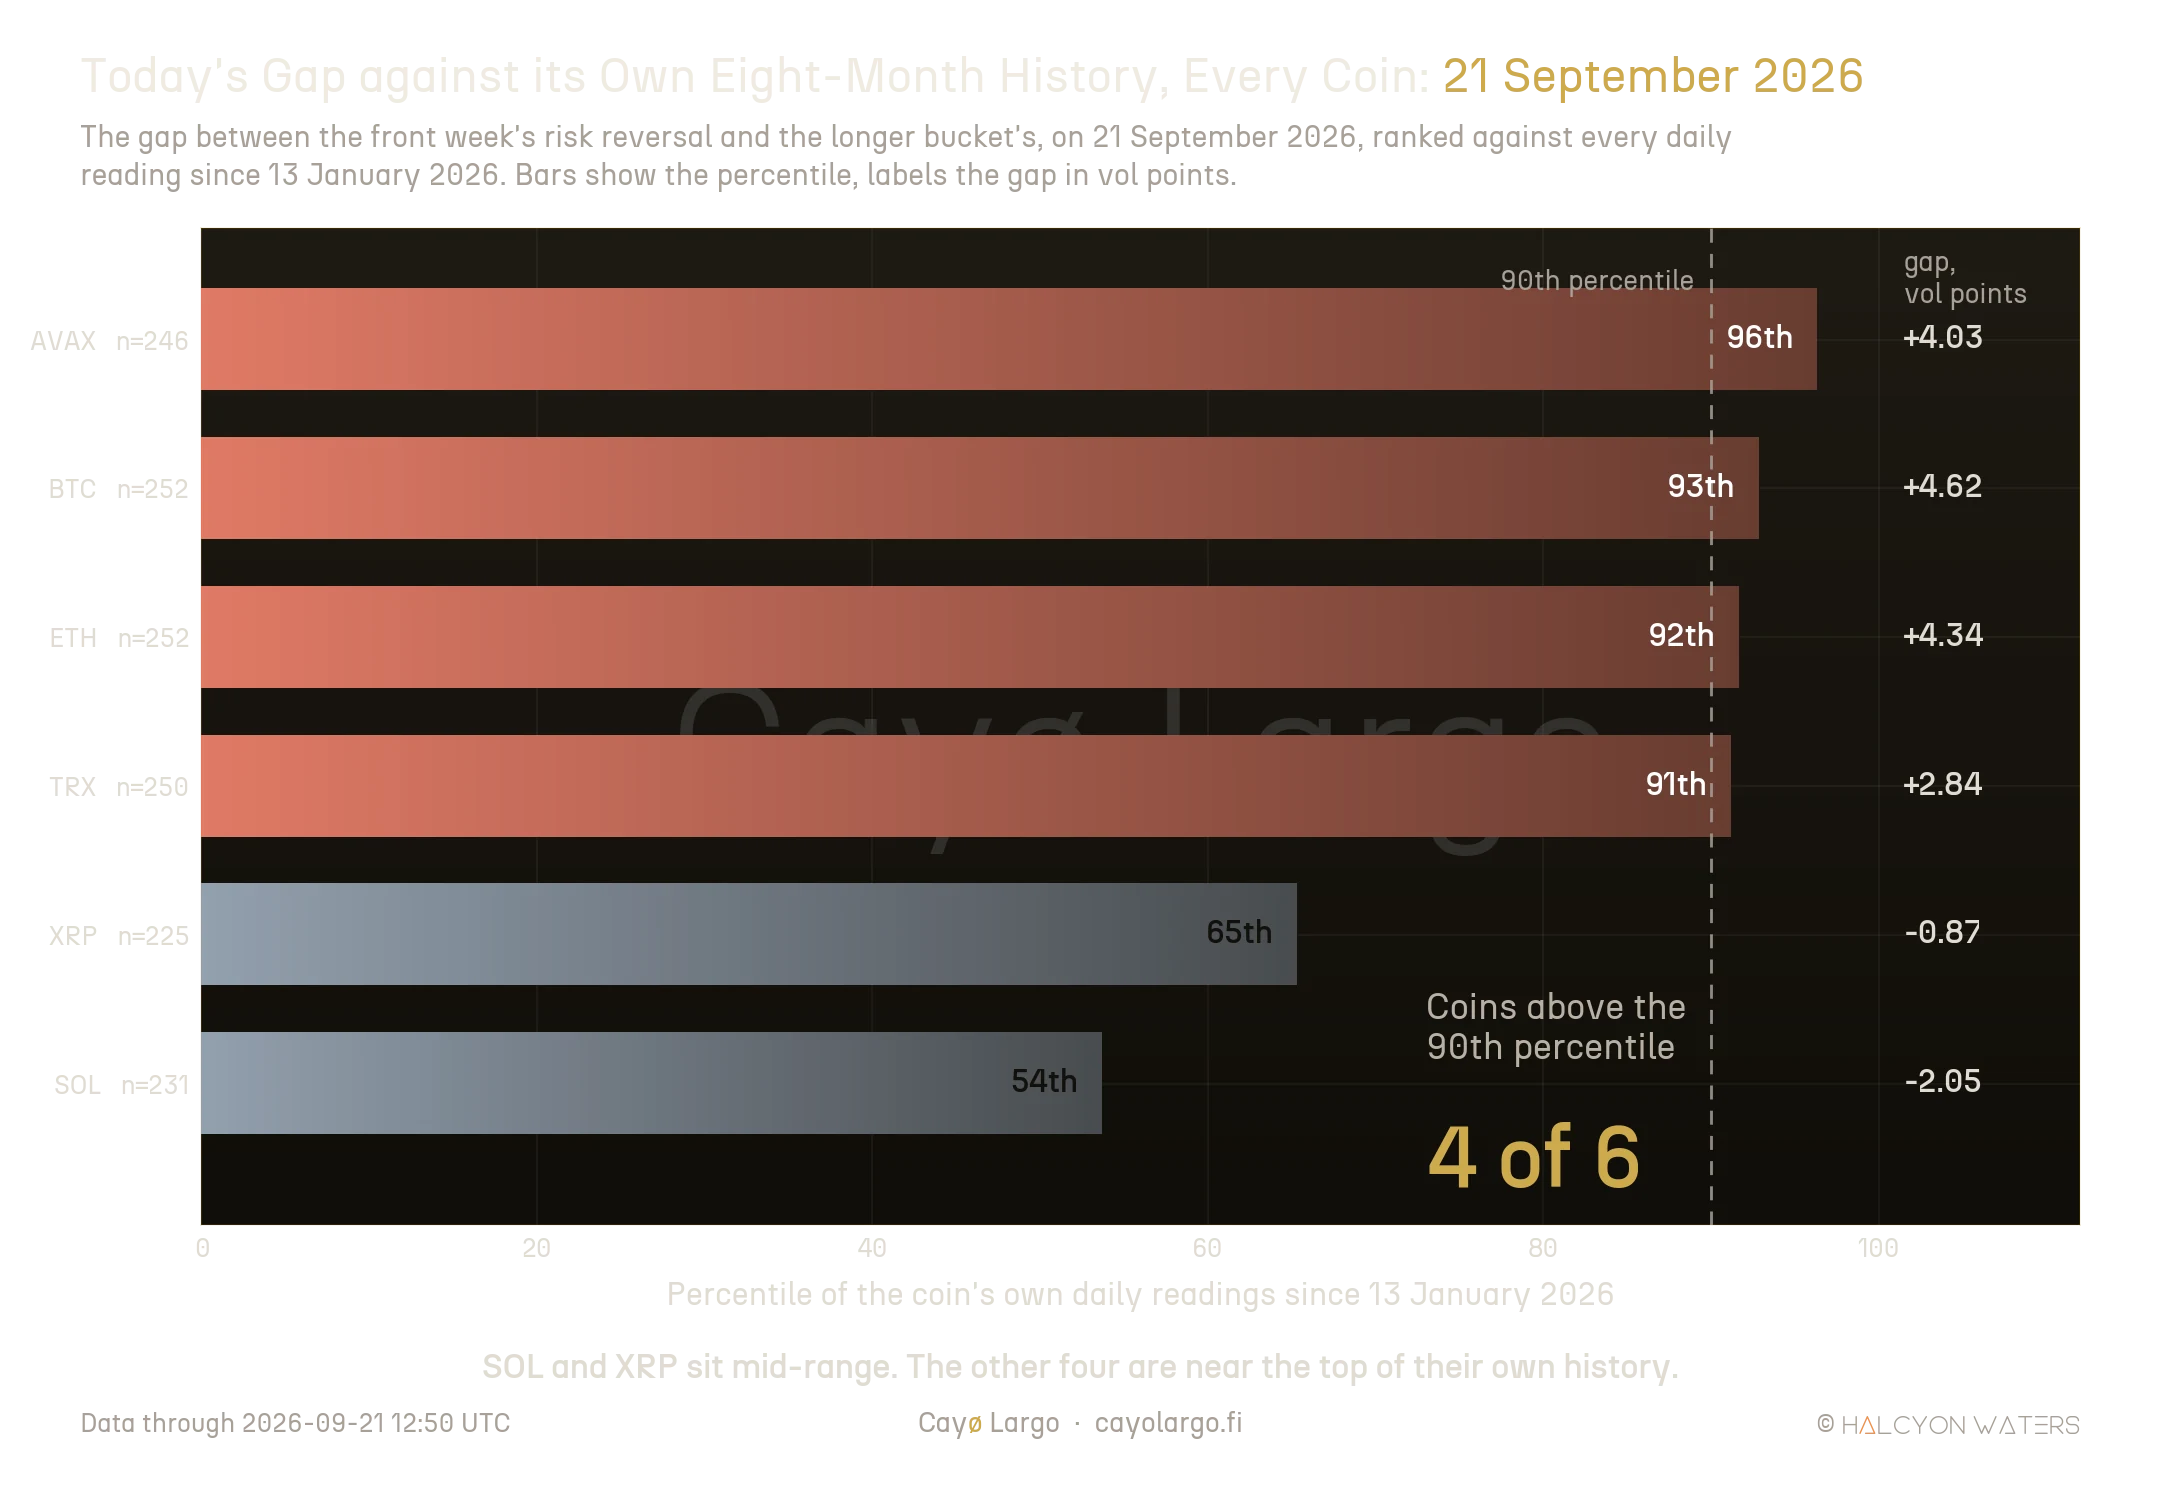
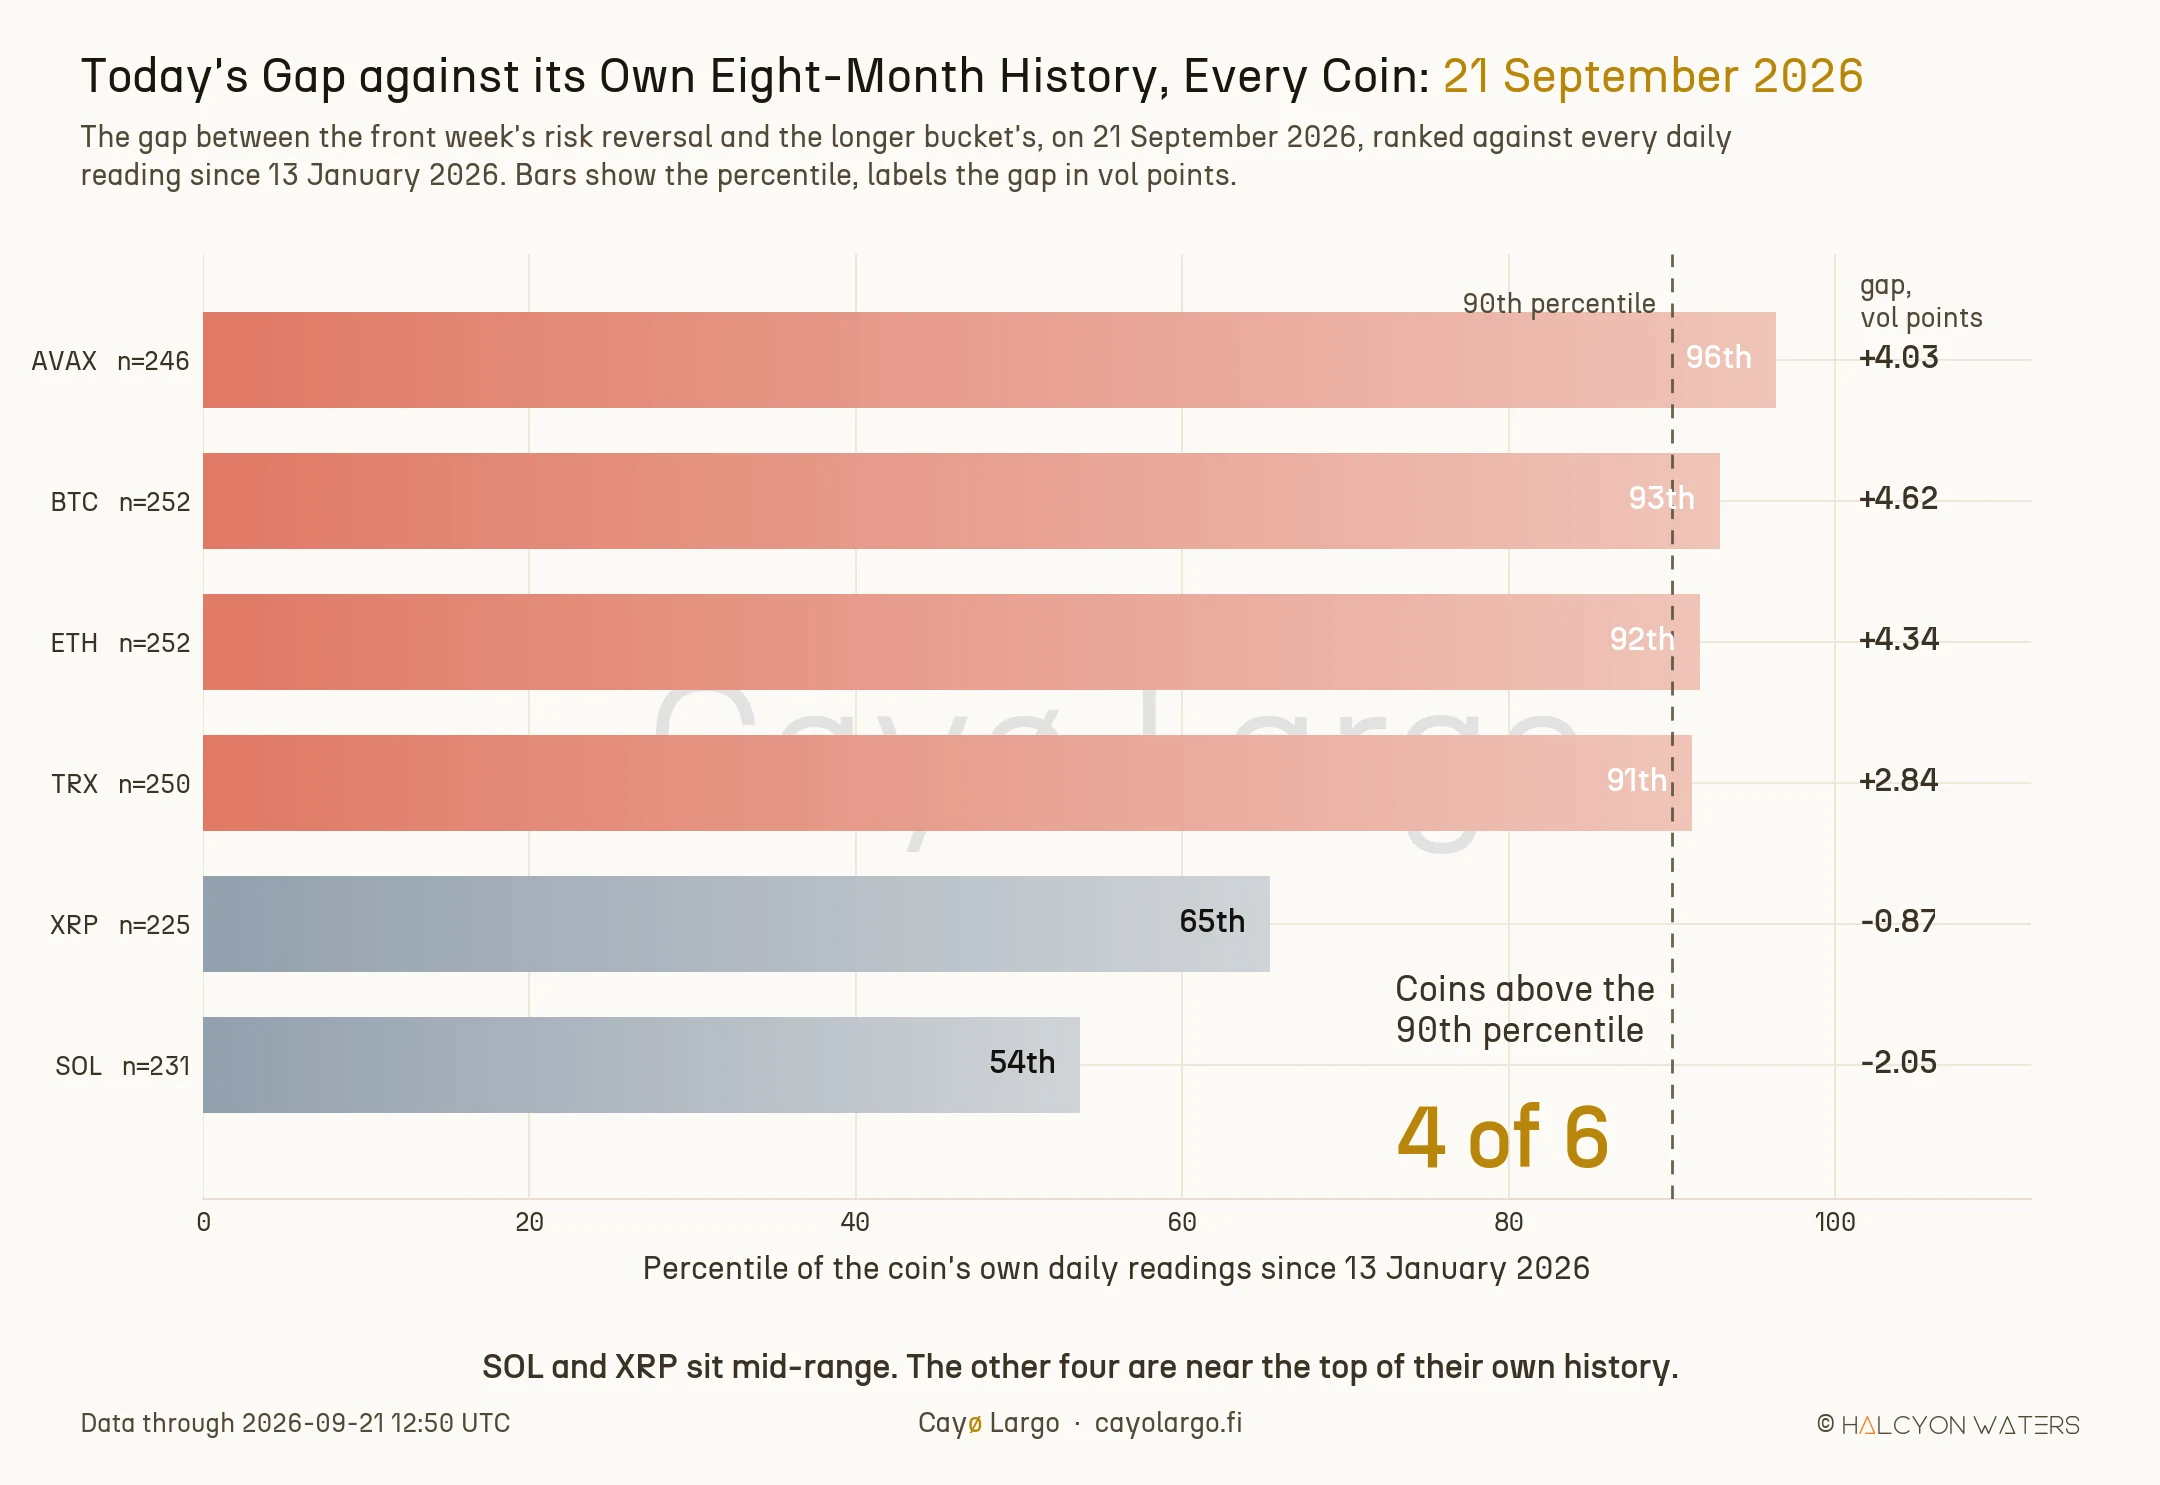
Figure 5: Today's gap ranked against every daily reading of that same coin since 13 January 2026. Four of the six books sit above the 90th percentile of their own history. SOL and XRP are unremarkable.
AVAX is at the 96th percentile of its own history, BTC at the 93rd, ETH at the 92nd, TRX at the 91st. BTC's front week is priced 4.62 vol points above its longer expiries when the eight-month average is 4.31 vol points below. That is a swing of nearly 9 vol points from the typical state. All of it in contracts with days to live. SOL and XRP show nothing unusual. That is its own useful information: this is not a whole-complex repricing.
The study says what normally follows. It does not say it will follow this time.
Five Things our Research Does Not Establish
One venue, eight months. Deribit only, 13 January to 21 September 2026, because that is where the bucketed skew archive begins. Whether the same asymmetry holds across a genuine regime change, one where the longer expiries move first and the front week follows, is a question 251 days cannot answer.
Overlapping windows. Keep in mind that a gap staying beyond the threshold on consecutive days enters the table more than once, and those forward windows are not independent. The direction is not in doubt at these margins, but read the percentages as approximate rather than as clean confidence intervals.
The thresholds are choices, not optima. We used +3 and -5 because they isolate the tails while leaving samples of 7 to 114 per coin. We did not run a grid search, and a different pair would give different magnitudes.
Two coins carry thin samples. SOL has 7 observations above +3 and TRX 17 below -5. Both show the same pattern as the deep books, which is reassuring, but neither would stand alone.
This is not a directional signal. Nothing here forecasts price. It measures where one part of the volatility surface sits relative to another, and which part historically moved afterwards.
What an Options Trading Desk Usually Watches?
The skew tab of the Volatility Landscape carries the live risk reversal across every expiry bucket. Read the longer expiries for the structural view and treat the front week as weather.
The front week is not noise. Nor is it useless. It tells you, loudly and accurately, what near-dated flow is paying for right now, and our companion note on its cycle-to-cycle noise measures how loudly. What it does not do is lead. The longer book is already where the market's considered view lives, and when the two disagree, the evidence says the front week is the one that moves.
On a screen full of numbers, the loudest reading is rarely the one carrying the most information.
In Short
We measured one gap: the front-week risk reversal against the longer-dated one, on Deribit, six coins, 251 days. When it ran wide, the front leg closed it and the longer book stayed put. The front leg carried 74 to 100% of the move and was done inside two days. Deribit's own weekly listing calendar does not explain any of it. A field for further exploration!
References
Vitor Gaspar, "Risk reversal. Trading the skew instead of reading it", LinkedIn, 1 August 2026. Frames the risk reversal as the tradable form of skew and argues that extreme prints mark crowded sentiment, with fading the extreme as the mean-reversion play. This note tests that idea tenor by tenor.
"Major Repricing in Front-End Skew", Deribit Insights, 13 December 2023. Documents a sharp shift in BTC weekly skew to a 3 to 4 vol point put premium, read correctly at the time as a front-end event.
"Major Shift In ETH Skew As Volumes Spike", Deribit Insights, 4 October 2023. Records a front-end ETH skew shift that then "reverted to a neutral position", consistent with the reversion measured here.
Garrett DeSimone, "Gold Volatility Skew and Monday's Selloff", OptionMetrics, 10 August 2021. Measures gold implied volatility skew at the 90th percentile during a spot selloff and notes that large skew extremes frequently resolve as contrarian signals.
Frequently Asked Questions
Does front-week crypto options skew predict the longer expiries?
No. Across 251 days of Deribit data on six coins, when the front week's risk reversal diverged from the longer expiry bucket by more than 3 vol points, the gap closed and between 74% and 100% of the closing came from the front leg moving. The longer bucket never moved more than a quarter of a vol point on average.
How fast does crypto options skew mean revert?
Faster than a week. Pooled across six coins the front leg has made its move by the second day, standing at 93% of its seven-day distance on the larger sample and overshooting on the smaller one. The seven-day horizon is generous rather than tight.
What tenors do Deribit skew buckets actually contain?
Less than their names suggest. Measured across 2026, Cayo Largo's front-week bucket averaged 2.6 to 3.0 days to expiry and the next bucket averaged 14.3 to 16.1 days, swinging between 10 and 24 days as the listing calendar rolls. They are the nearest weeklies against the two-to-three-week expiries.
Related Articles
How Noisy Is the 25-Delta Risk Reversal?
BTC's front-week 25-delta risk reversal moves 2.07 volatility points every ten minutes and travels only a third of the expected distance across a day.
Crypto Put Skew vs Volatility Level: Reading the Gap
Implied volatility fell on all six coins overnight and put skew did not follow. On five of six, skew now ranks higher than the volatility level itself.
Every Crypto Front Implied Volatility Crashed Together
Traders read a front-week vol crash as the market pricing danger passed. On 2026-09-17 six coins crashed inside their own bottom 5% while realised ran hot.