Crypto Put Skew vs Volatility Level: Reading the Gap
Implied volatility fell on all six coins overnight and put skew did not follow. On five of six, skew now ranks higher than the volatility level itself.
Volatility got cheaper on every coin Cayø Largo tracks over the twenty-four hours to 3 September 2026. Watch only that number and you would file the session under calm returning. Downside protection was being bid the whole time. It simply went into the shape of the surface rather than its height.
Rank each measure against that coin's own trailing 90 days and skew now sits higher than the volatility level on five of the six, TRX being the only exception. Two counts run through this note and they are worth separating before the table. Five of six is the relative reading, namely skew ranking above the level. Four of six is the absolute one, namely 30-day put skew above the 79th percentile of its own history. SOL sits at 98.4, ETH at 87.4, XRP at 83.3, BTC at 79.2. TRX at 61.0 and AVAX at 44.5 are below the line.
In this note we put both measures on one scale, coin by coin, then set the reading beside what two practitioners published about the same shape in the same week and what one of them wrote three years ago. Keep in mind throughout what a percentile is. It is a rank, not a forecast.
Two questions, one surface
The at-the-money implied volatility level answers one question: how much is this coin expected to move. Put skew answers a different one: how much more expensive is downside than upside. They get discussed together and they do not have to move together.
Any sailor knows the pair. A forecast gives you wave height and it gives you swell direction and only one of them tells you how to set the boat. The height came down overnight. The swell kept turning to the same quarter.
That distinction is what a reader watching the level alone would have missed. Volatility fell on every coin, XRP by 4.58 vol points on the 7-day at-the-money and SOL by 2.72. That is a market charging less for movement. Three of those same coins charged more for downside in the same session: XRP added 7.49 points of 30-day put skew, SOL 6.47, ETH 1.62.
Protection was still being bought. It went into the shape, not the height.
Where each coin sits in its own history
A level is not comparable across coins. TRX's typical put skew and SOL's are different animals. The only way onto one scale is to rank each coin against its own past. Every figure below is a percentile of that coin's own trailing 90 days.
That rank is an empirical percentile, computed per coin against its own archive.
where is the current reading, runs over that coin's cycles in the trailing 90 days and is the indicator returning one when the condition holds. is printed in the last column of the table, because a percentile computed over 1,171 cycles and one computed over 11,210 are not the same evidence.
| Coin | Put skew, 30d | Skew percentile | IV percentile | 24h skew change | Sample cycles |
|---|---|---|---|---|---|
| SOL | 42.51 | 98.4 | 48.9 | +6.47 | 11,210 |
| ETH | 58.77 | 87.4 | 24.5 | +1.62 | 8,346 |
| XRP | 36.05 | 83.3 | 69.9 | +7.49 | 8,589 |
| BTC | 58.02 | 79.2 | 40.4 | -11.69 | 4,854 |
| TRX | 26.59 | 61.0 | 93.8 | -2.91 | 1,171 |
| AVAX | 21.23 | 44.5 | 7.1 | -1.70 | 9,855 |
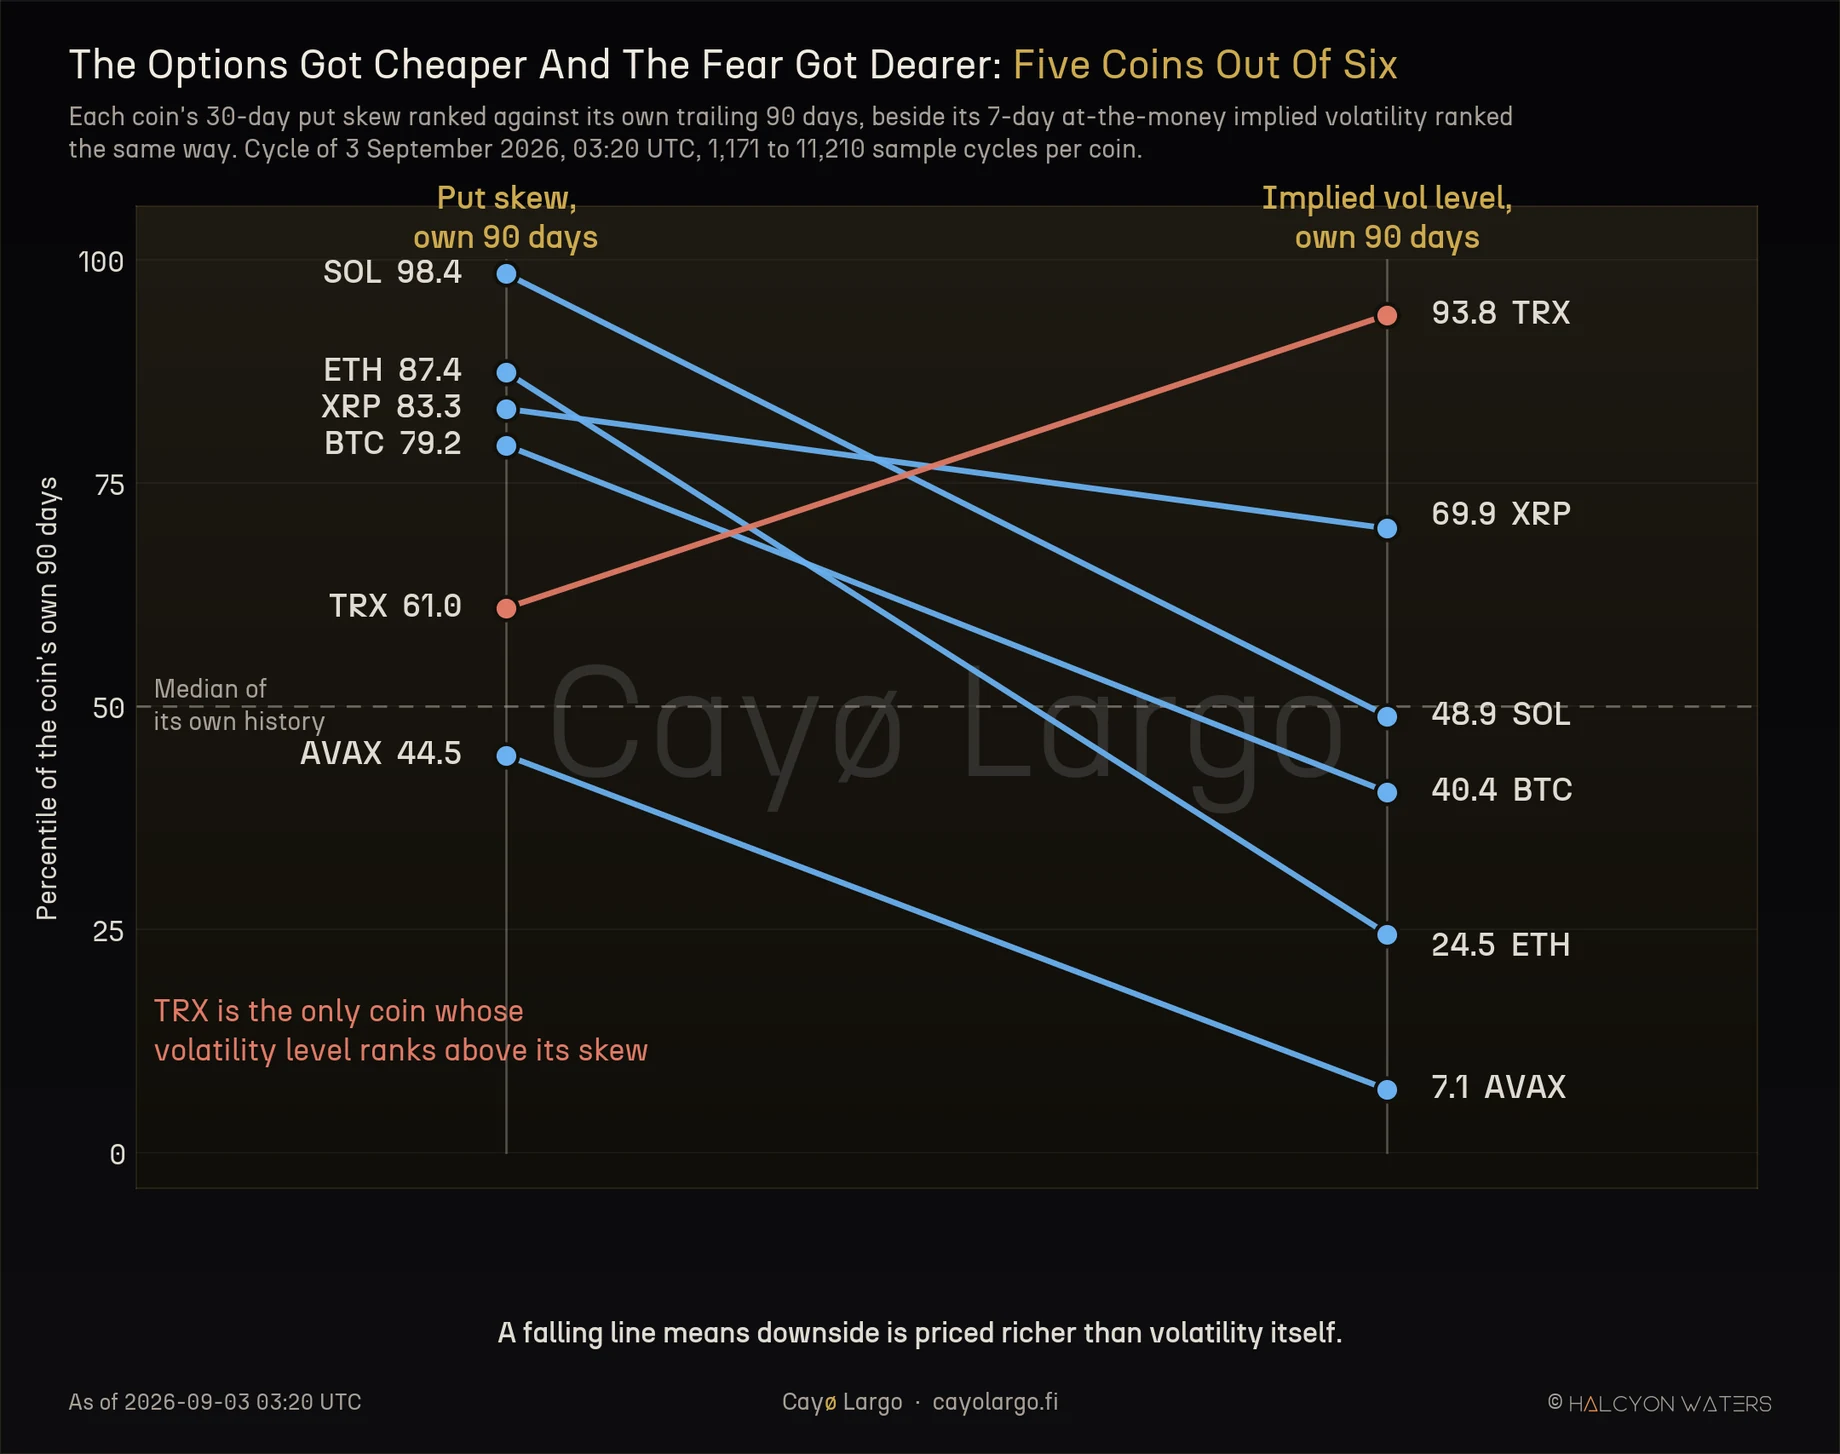
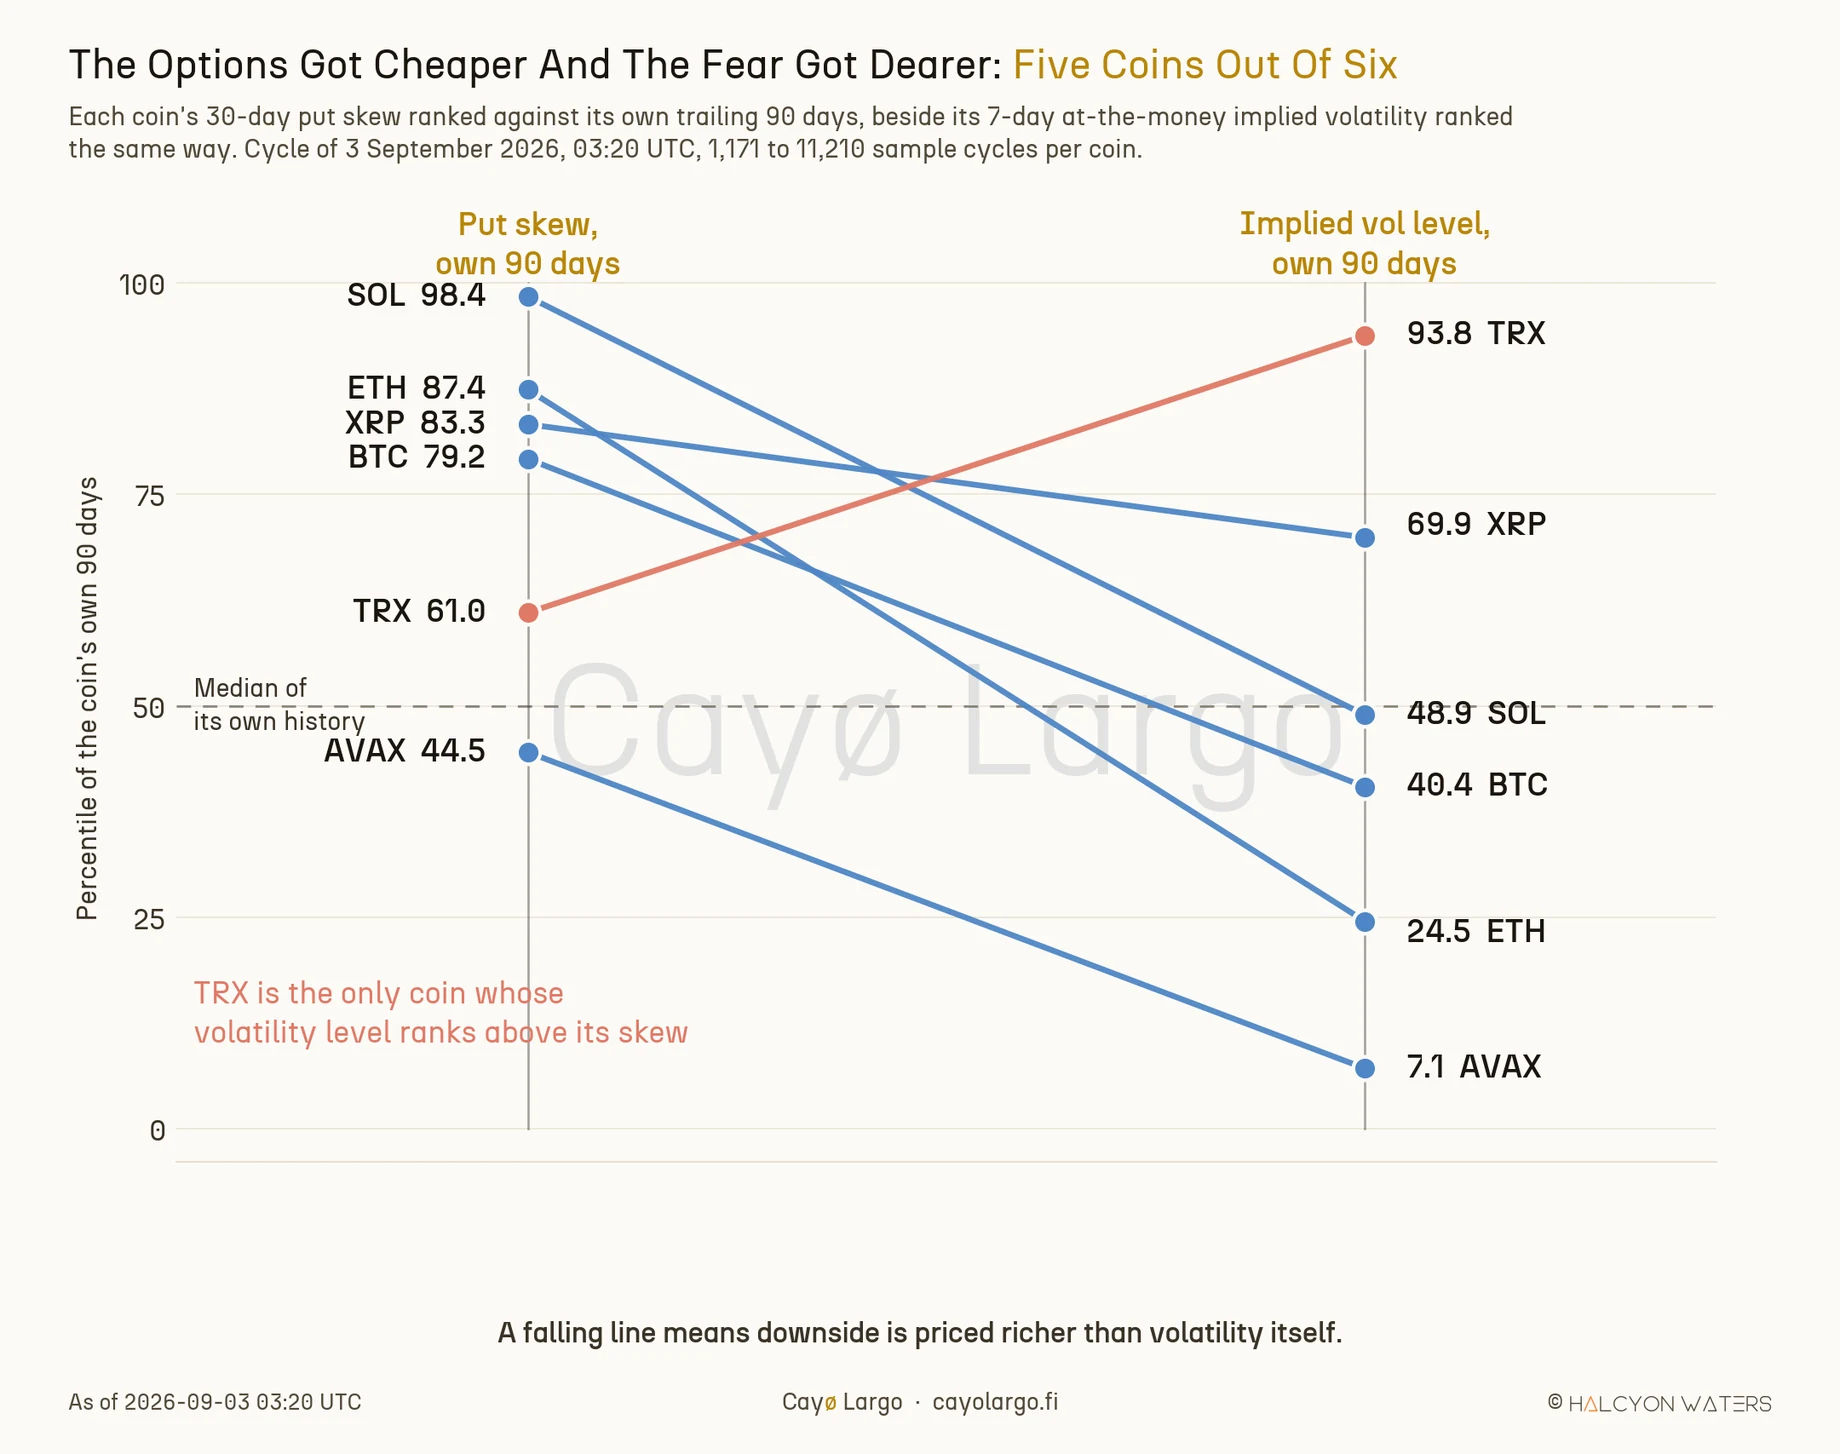
Figure 1: Every coin's two ranks on one scale. The left rail is where its put skew sits in its own 90 days, the right rail where its implied volatility level sits. A falling line means downside is priced richer than movement. Five of six fall and TRX alone rises, the only coin whose volatility level ranks above its skew.
Have a look at ETH first. Skew at the 87.4th percentile, level at the 24.5th, a spread of 63 rank points, what makes it the widest gap in the set. AVAX carries the cheapest volatility of any coin here, the 7.1st percentile of its own history and still ranks its skew nearly forty points higher.
BTC is the divergence and it is worth watching rather than explaining away. Its put skew fell 11.69 points over the day, the largest single move in the set and still landed at the 79.2nd percentile. It did not climb into the top fifth of its own history. It arrived there from above.
The same shape, seen from another market
Two notes published in the days before this reading come at the subject from opposite ends and the difference between them matters as much as the overlap.
Imran Lakha argued on 1 September that the genuinely unusual behaviour was not spot rising with volatility. It was the days when the market ticks down and volatility does nothing at all. He put that down to dealers already holding the volatility nobody needed to buy back. His tell was to watch the down days rather than the up ones.
A day later, VolSignals measured the S&P 500 version: two-week skew at roughly the 88th percentile of the last two years, with the index down less than 1%. His argument was that skew is better read as a position than as sentiment.
Their session was not ours. The difference is the point. On their day the at-the-money level rose as well, with 1-month S&P 500 implied volatility going from about 11.7% to 13.0% while the 25-delta put-call difference widened from 3.7 to 4.6 volatility points. Protection was bid in the level and in the shape together. Their skew measure is also normalised, namely put vol minus call vol divided by at-the-money vol.
where and are the implied volatilities of the two wings and the at-the-money level. Hold the numerator fixed and let fall and the ratio rises on its own. Know that before setting their number beside ours.
What Cayø Largo records is the harder case. It is closer to what Lakha was pointing at. The level fell on every coin and the shape held or steepened anyway. Nothing lifted skew mechanically here, because a vol-point difference has no falling denominator underneath it.
None of this is new behaviour. Lakha documented a major front-end skew repricing in December 2023, when short-dated downside demand pushed weekly skew to a 3 to 4 volatility point put premium and the long end kept its call premium. A year earlier he had described the same rotation toward put premium in August 2023. Ranking skew against its own history is not new either and the VolSignals note above is the clearest recent example of it, placing S&P 500 two-week skew at the 88th percentile of two years.
What we could not find is anyone doing it for crypto skew. The field reads it as a level through time. Amberdata's Q1 2023 review of the BTC volatility surface is typical: its risk-reversal section plots 25-delta skew across five tenors as a time series. That same review does reach for a distributional view, a box plot of 2022 against 2023 and spends it on the futures basis rather than on skew. What is new here is running that rank across six coins at once, every ten minutes. The cross-sectional picture then arrives on the day rather than in a quarterly review.
How this was measured
Put skew comes from put_skew_dte30 and the volatility level from atm_iv_dte_7, both on Cayø Largo's own volatility surface, rebuilt from Deribit every ten minutes and documented on the skew endpoints. The reading is the 03:20 UTC cycle of 3 September 2026.
Each percentile is the share of that coin's cycles in the trailing 90 days at or below the current value, computed on the all-cycles basis rather than a same-hour basis. All-cycles uses roughly ten thousand observations per coin against roughly six hundred for same-hour and the thin basis has produced misleading ranks before. The live surface these readings come from is on the Vol Surface Explorer.
What this does not say
Sample depth is uneven and it is printed beside every figure for a reason. Over the same 90 days, put_skew_dte30 carries 11,210 cycles on SOL and 1,171 on TRX. TRX's 61st percentile rests on the thinnest history in the set. BTC's 4,854 is less than half of SOL's.
The 7-day tenor is not reportable today. put_skew_dte7 was NULL on every coin except SOL at this cycle, so every skew figure here is the 30-day series. A note claiming a front-end reading today would be claiming something the surface did not carry.
A percentile is a rank, not a forecast. It says where today sits against ninety days of the same coin and ninety days is a short history for a market this young. It says nothing about what comes next and we make no claim about direction.
The cause is unestablished. Lakha's explanation is dealer inventory and we cannot read dealer inventory cleanly enough to confirm it or reject it. What we can show is the configuration. It is present across most of the complex at once.
Related and measured yesterday: how often each coin's implied volatility responds to price at all. It found the response far weaker than the textbook implies and different on every coin. This note is the other half of that picture, the response that shows up in the shape rather than the level. For the deep-out-of-the-money version of the same surface question, see reading deep OTM implied volatility.
What to watch
The reading that settles the competing stories is the skew path on a day the level does move. If skew holds its rank through a session where volatility climbs as well, the protection bid is structural. If it collapses the moment the level catches up, it was positioning waiting to clear, which is exactly what Lakha's argument predicts.
That test costs nothing to run, because you are already looking at both numbers. Watch the shape on the day the height comes back.
References
- Amberdata, 20 April 2023, The BTC Volatility Surface: Q1 2023, Deribit Insights, Risk-Reversal Skew section: 25-delta skew plotted as a time series across five tenors, the ordinary treatment. Note that the section is headed "Skew 30 box plot" but the chart is not one; the review's only true box plot sits further down, on the futures basis. https://insights.deribit.com/industry/the-btc-volatility-surface-q1-2023/#Risk-Reversal-Skew
- Imran Lakha, 2 August 2023, Shift In Sentiment Away From Bullish Expectations, Deribit Insights: BTC skew rotating toward put premium across the curve. https://insights.deribit.com/industry/shift-in-sentiment-away-from-bullish-expectations/
- Imran Lakha, 13 December 2023, Major Repricing in Front-End Skew, Deribit Insights: short-dated downside demand pushing weekly skew to a put premium while the long end held a call premium. https://insights.deribit.com/industry/major-repricing-in-front-end-skew/
- Imran Lakha, 1 September 2026, on X: down days producing no volatility bid, read as a positioning signal rather than ordinary behaviour. https://x.com/options_insight/status/2094796922963783873
- VolSignals, 2 September 2026, on X: S&P 500 two-week skew at roughly the 88th percentile of two years with the index down under 1% and the argument that skew is a position. Their at-the-money level rose on the same session, about 11.7% to 13.0% and their skew measure is normalised by at-the-money vol, so it is a comparison rather than a match. https://x.com/VolSignals/status/2095135752799609082
Cayø Largo data referenced throughout: 30-day put skew and 7-day at-the-money implied volatility, six coins, ten-minute cadence, ranked against a 90-day trailing window from 5 June 2026. Field definitions are published in the skew API documentation.
Frequently Asked Questions
Is crypto put skew high right now?
Yes, on most of the complex. At the 03:20 UTC cycle on 3 September 2026, 30-day put skew sat above the 79th percentile of its own trailing 90 days on four of six coins: SOL at 98.4, ETH at 87.4, XRP at 83.3 and BTC at 79.2. AVAX at 44.5 and TRX at 61.0 were below it. Measured differently, against each coin's own implied volatility rank rather than against a fixed percentile, skew ranks higher on five of the six.
What does it mean when skew rises while implied volatility falls?
It means the market is paying more for asymmetry and less for movement. The at-the-money level prices how much a coin is expected to move; skew prices how much more expensive downside is than upside. When the level falls and skew holds or rises, protection is being bought in the shape of the surface rather than in its height.
Why measure skew as a percentile rather than a level?
A skew of 58 vol points is a fact a reader cannot act on without knowing what is normal for that coin. A skew at the 87th percentile of its own 90 days is a finding. Coins differ enormously in their typical skew, so only a rank against each coin's own history makes them comparable to one another.
Which crypto coin has the most extreme put skew today?
SOL, at the 98.4th percentile of its own trailing 90 days, computed over 11,210 sample cycles. It is also the only coin in the set whose skew term shape reads front-loaded fear, meaning near-dated downside is priced richer than far-dated downside.
Related Articles
The Crypto Leverage Effect, Measured Coin By Coin
The crypto leverage effect holds on Bitcoin 72.2% of the time and on XRP 55.8%. Six months of implied volatility measured against price, coin by coin.
Why Deep-OTM IV Momentum Is Noise, Not Signal
A stable IV smile but wild IV momentum at deep-OTM strikes. Why thin-strike microstructure is noise, not repricing, shown live on Deribit multi-coin data.
Crypto Variance Risk Premium: Live IV vs RV on Six Coins
How to read IV vs RV charts and the variance risk premium to figure out whether crypto options are overpriced, underpriced, or fairly valued. Live AVAX example from Deribit.