How Noisy Is the 25-Delta Risk Reversal?
BTC's front-week 25-delta risk reversal moves 2.07 volatility points every ten minutes and travels only a third of the expected distance across a day.
A number. Two decimal places. Quoted in a desk note, printed on a dashboard, repeated in a weekly wrap as though the market had made up its mind. Front-week skew gets treated as a level and levels are things you can lean on.
Look underneath it and the floor moves.
Between 13 January and 8 September 2026, Bitcoin's front-week 25-delta risk reversal (call implied volatility minus put implied volatility at the 25-delta point) moved an average of 2.07 volatility points from one ten-minute cycle to the next, across 33,777 consecutive steps. Its own average absolute level over the same window was 9.74. The 30-day risk reversal on the same coin moved 0.194 points per cycle. A ratio of 10.7 to 1. A single reading of front-week skew carries about a fifth of its own magnitude in movement that arrives and leaves before you finish writing the number down.
In this note we run three tests on that number, in order. How far it moves between two glances. Whether any of that movement goes anywhere. And whether the clock on the wall moves it as much as the market does. Each test kills the explanation you would reach for first and the deliverable at the end is a habit, not a signal.
1. What gets quoted and what sits underneath
In Major Repricing in Front-End Skew, published on Deribit Insights on 13 December 2023, Imran Lakha notes under "Big Repricing of Skew" that the weekly skew had shifted to a 3 to 4 volatility put premium. Good observation, correctly read at the time. It is also a number without an hour and without a window, which is how front-end skew gets reported everywhere. One snapshot, one moment, stated as a level.
Cayø Largo samples the full Deribit option chain every ten minutes and keeps every cycle. That opens a question a daily snapshot cannot answer, namely: over the life of one of these quotes, how far does the quantity itself actually travel?
Anyone who has worked with time series knows the trap waiting here. Film a wheel at the wrong frame rate and it appears to spin backwards, or to stand still. Nothing is wrong with the wheel and nothing is wrong with the camera. The sampling rate and the thing being sampled simply do not agree and what comes out is an artefact you can measure to two decimal places. A skew quote taken once a day is a frame rate. Let's find out what it is missing.
2. The front week moves ten times faster
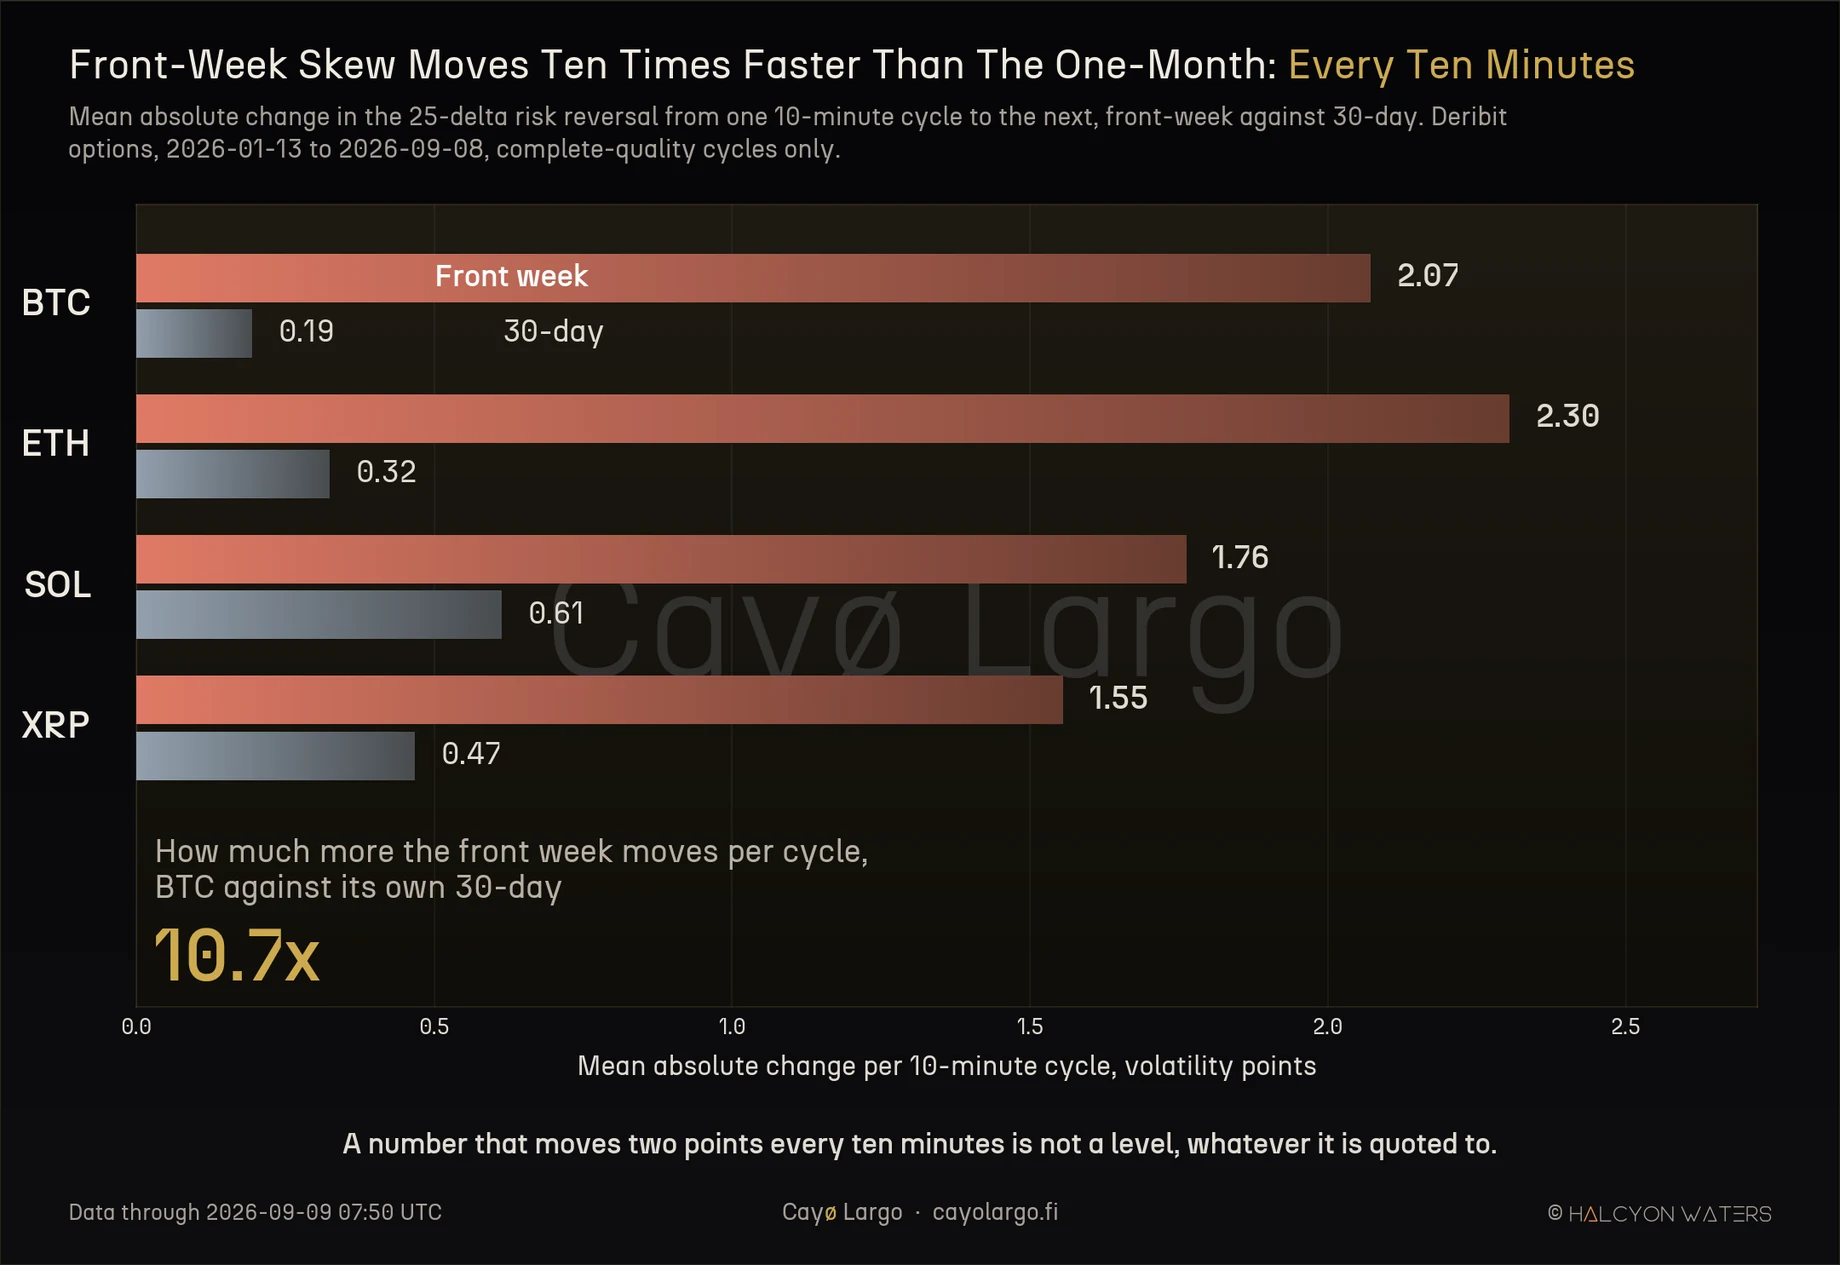
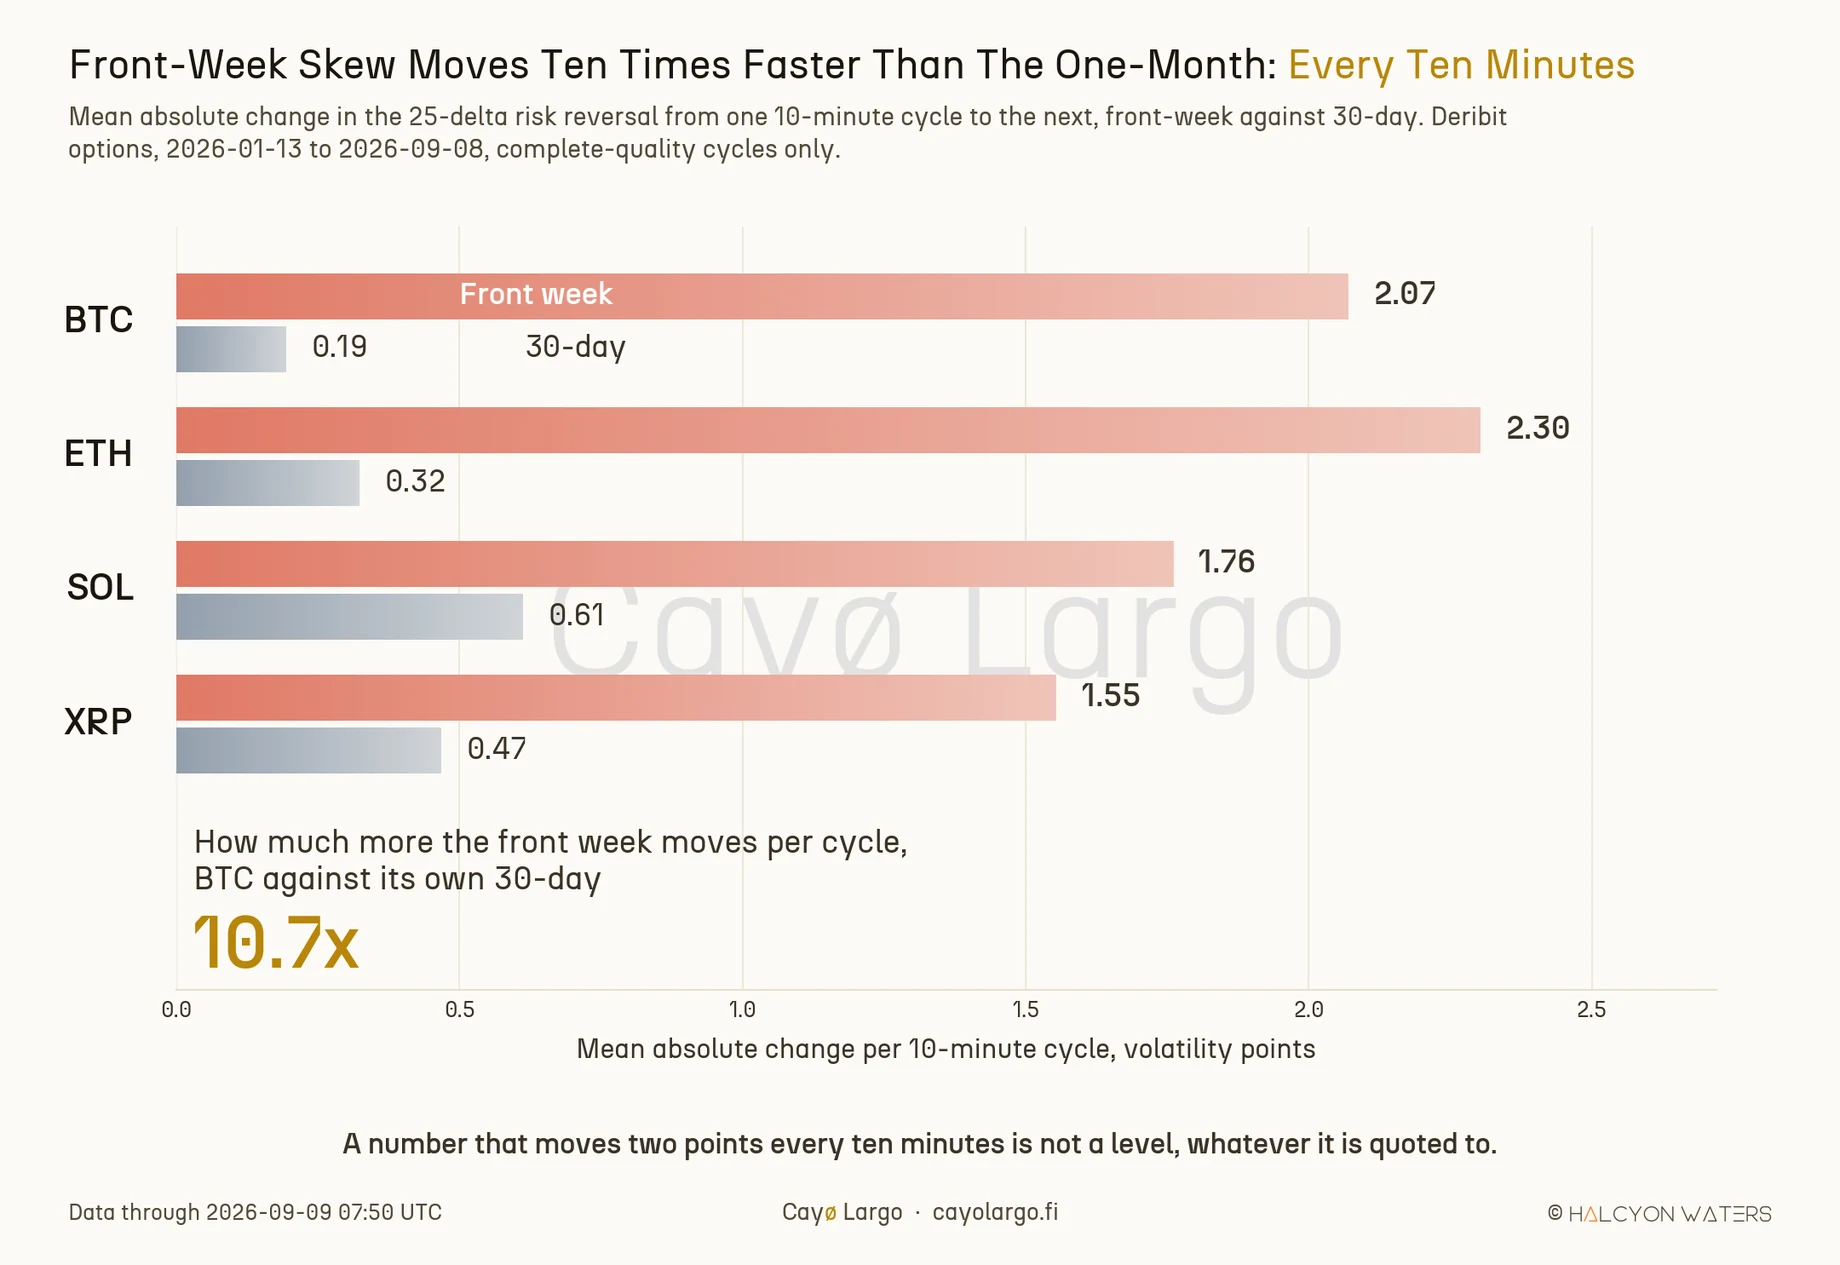
Figure 1: Coral bars are the front-week bucket, silver the 30-day. Bar length is how far the risk reversal moves from one cycle to the next. The gap between the pairs tells the story.
| Coin | Front week, per 10 min | 30-day, per 10 min | Ratio | Steps measured |
|---|---|---|---|---|
| ETH | 2.303 | 0.323 | 7.1x | 33,807 |
| SOL | 1.761 | 0.612 | 2.9x | 33,596 |
| XRP | 1.554 | 0.467 | 3.3x | 33,019 |
| BTC | 2.070 | 0.194 | 10.7x | 33,777 |
Same direction on all four coins. Values in volatility points.
The quantity in those first two columns is a mean absolute step and it is the whole note in one line.
where is the 25-delta risk reversal at cycle and the pairs counted are consecutive cycles separated by 8 to 12 minutes, so a gap in collection cannot enter as a jump in the market. It measures distance travelled, not direction, which is exactly the quantity a reader of a single quote is blind to.
Keep in mind what the ratio column is really saying. On Bitcoin the front week is 10.7 times as jumpy as the one-month, i.e. the two quantities are not the same measurement at different tenors. They are different measurements wearing the same name.
Your first instinct is probably the one everyone has, ours included. Fewer options in a front-week smile means a wider interpolation, what means more noise. Worth killing before going further, because the data says the opposite.
Have a look at what happens when we sort BTC's front-week cycles by how many options priced in each one:
| Options in the cycle | Cycles | Mean options | Move per 10 min |
|---|---|---|---|
| Under 120 | 2,496 | 103 | 2.039 |
| 120 to 159 | 8,774 | 142 | 1.772 |
| 160 to 199 | 11,502 | 179 | 1.844 |
| 200 to 249 | 8,345 | 221 | 2.378 |
| 250 and over | 2,660 | 270 | 3.090 |
Read the last column downwards. It rises. The fullest books move the most, half again as much as the thinnest, 3.090 against 2.039. Whatever drives this, it is not a sparse smile.
That distinction matters, because it separates this finding from one of our own. Our note on deep out-of-the-money implied volatility momentum found that strike-level implied volatility flicker in the wings is thin-strike microstructure. Two different quantities, two different mechanisms and the tests point in opposite directions. Same house, opposite verdicts and both stand.
3. The distance it never covers
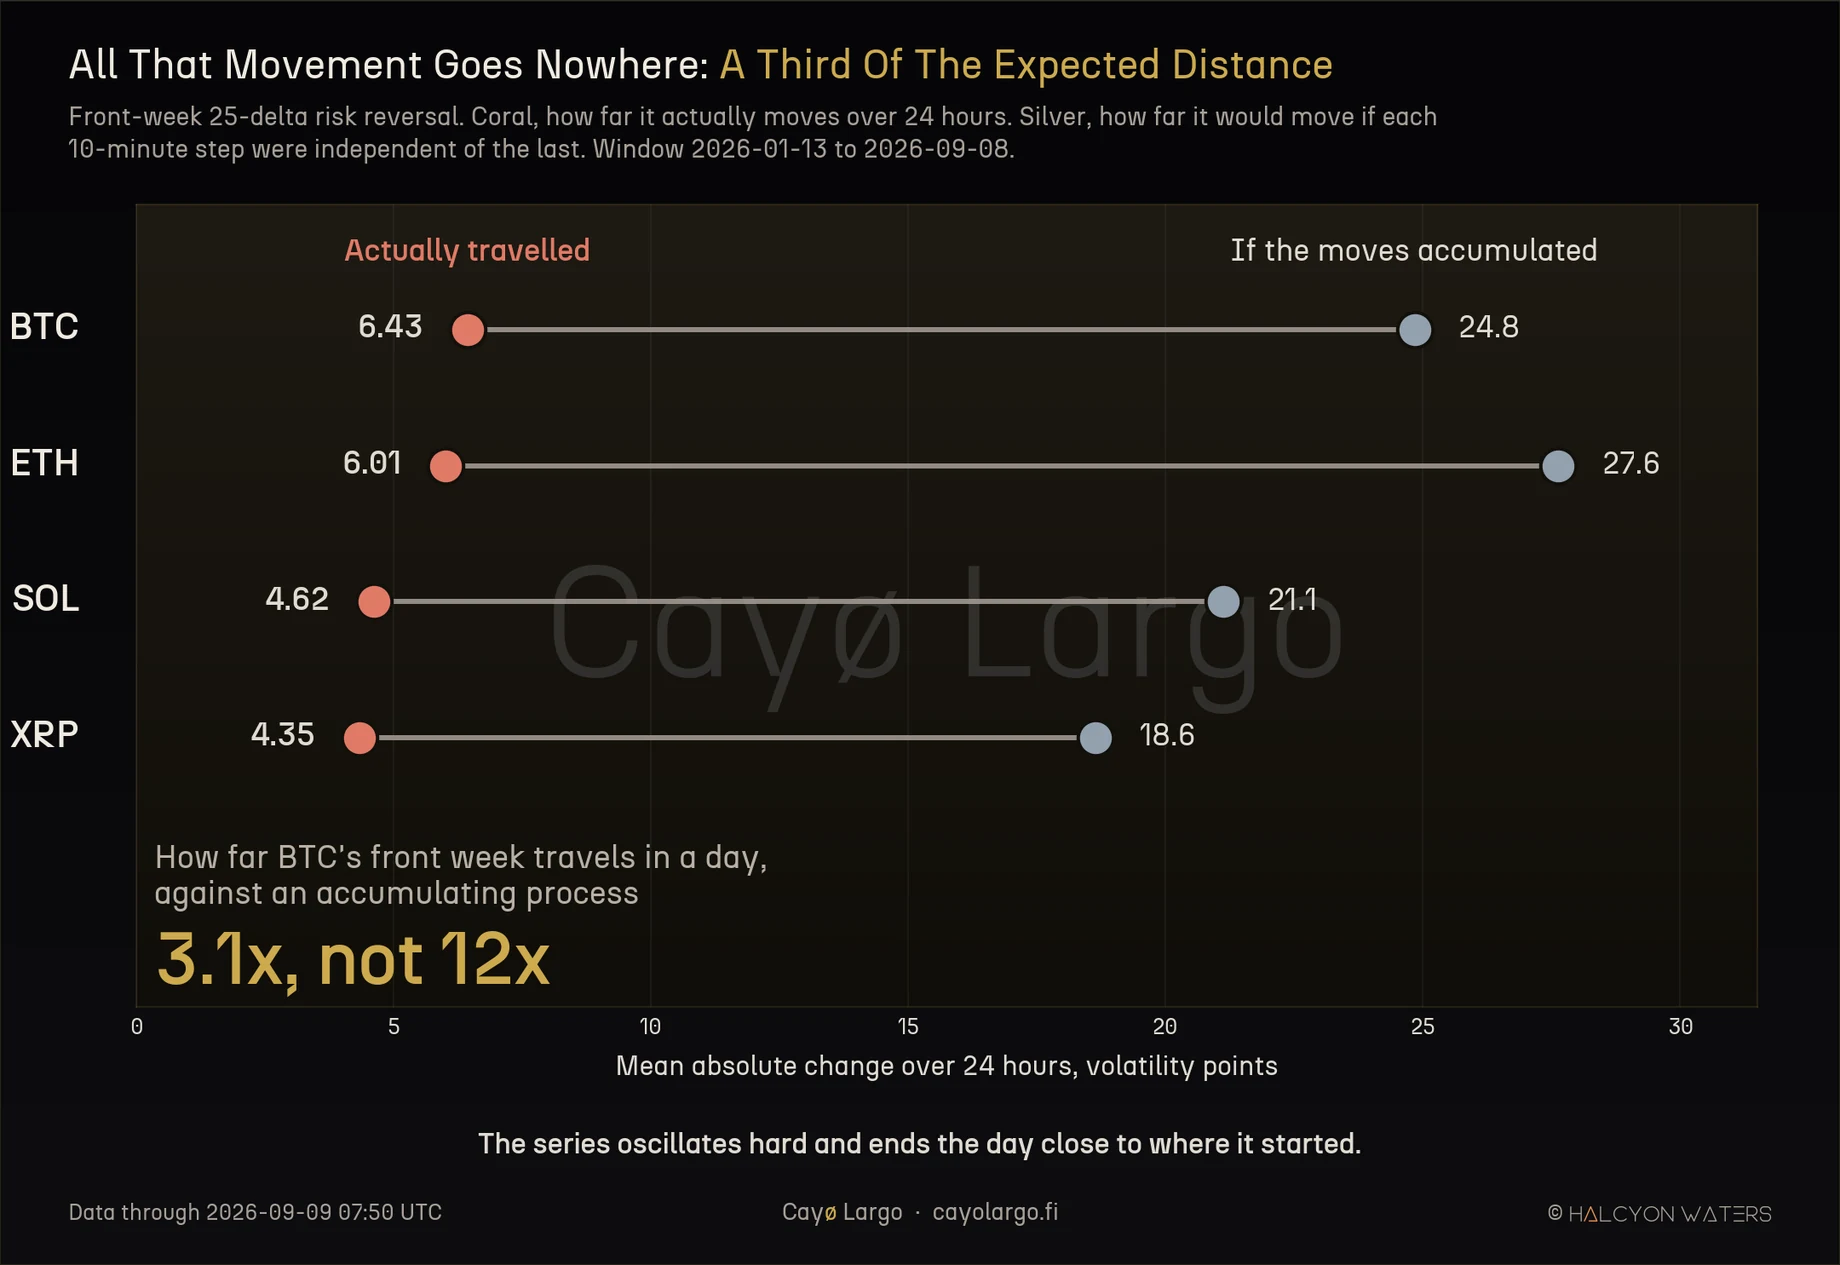
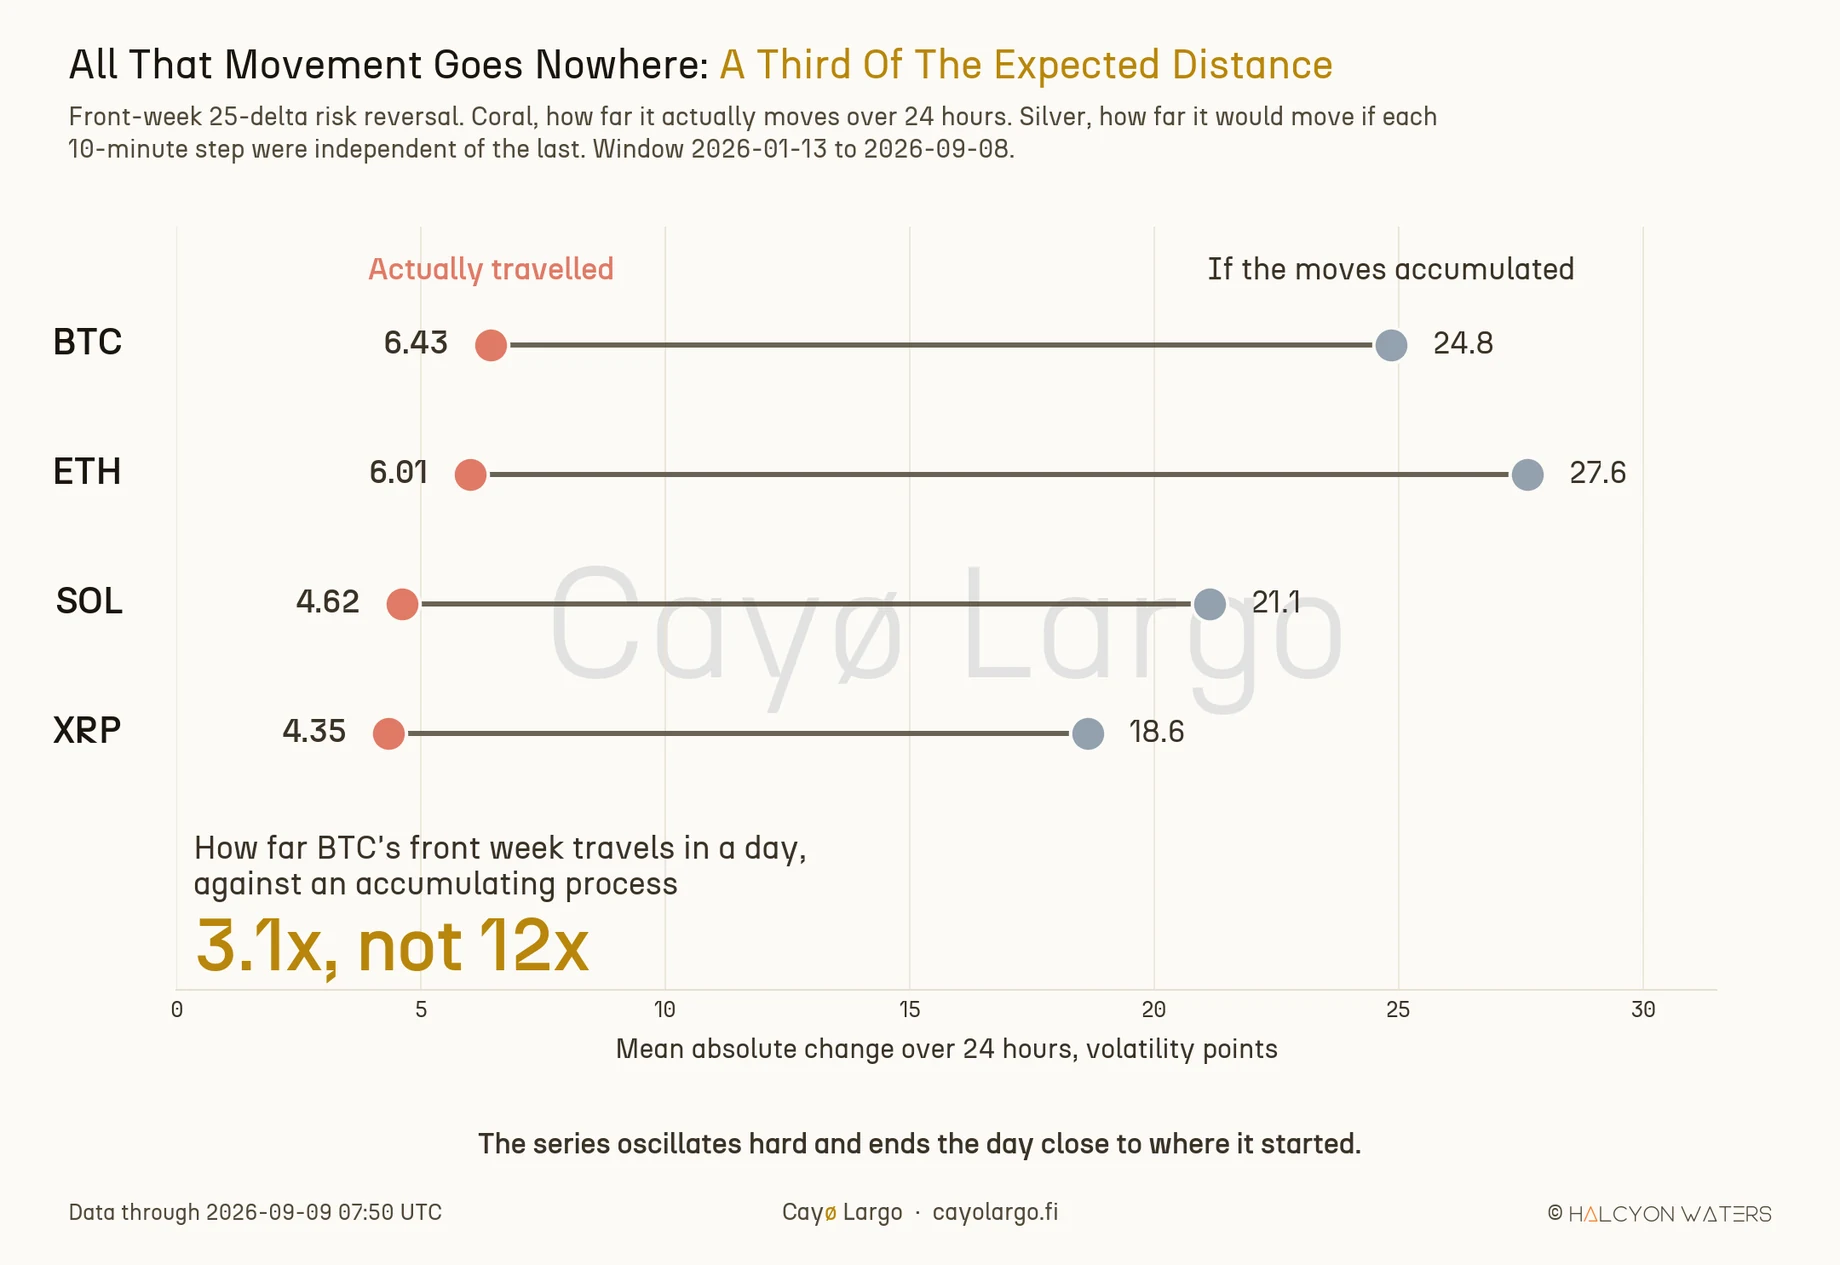
Figure 2: Coral marks how far the reading actually travels in 24 hours. Silver marks how far it would go if each step were independent. The connecting bar is the distance it fails to cover.
Here is where the number gets interesting.
If each ten-minute move were independent of the last, 144 of them would carry the reading twelve times as far as a single step. That is the square-root-of-time rule and it is the null hypothesis any wandering series should satisfy.
where is the change over consecutive cycles, the change over one and the ratio between the two typical absolute moves. A day is 144 cycles, so an accumulating series must return . Anything materially below that is a series being pulled back rather than wandering away. BTC's front-week risk reversal moves 2.07 points per cycle. An accumulating process would therefore put it 24.8 points from where it started a day earlier.
The actual distance: 6.44. A factor of 3.1 where 12 was the prediction.
The gap is already open at one hour, 3.24 observed against 5.07 predicted and it widens as the horizon lengthens. That widening is the signature. A series pulled back toward a level behaves this way; a series wandering away from one does not. ETH reads 6.02 against 27.6, SOL 4.62 against 21.1, XRP 4.35 against 18.6. Four coins, one verdict.
In other words, most of what front-week skew does between two glances is oscillation around a slower-moving level. The wheel is spinning. Your camera caught one frame.
4. The clock moves it as much as the day does
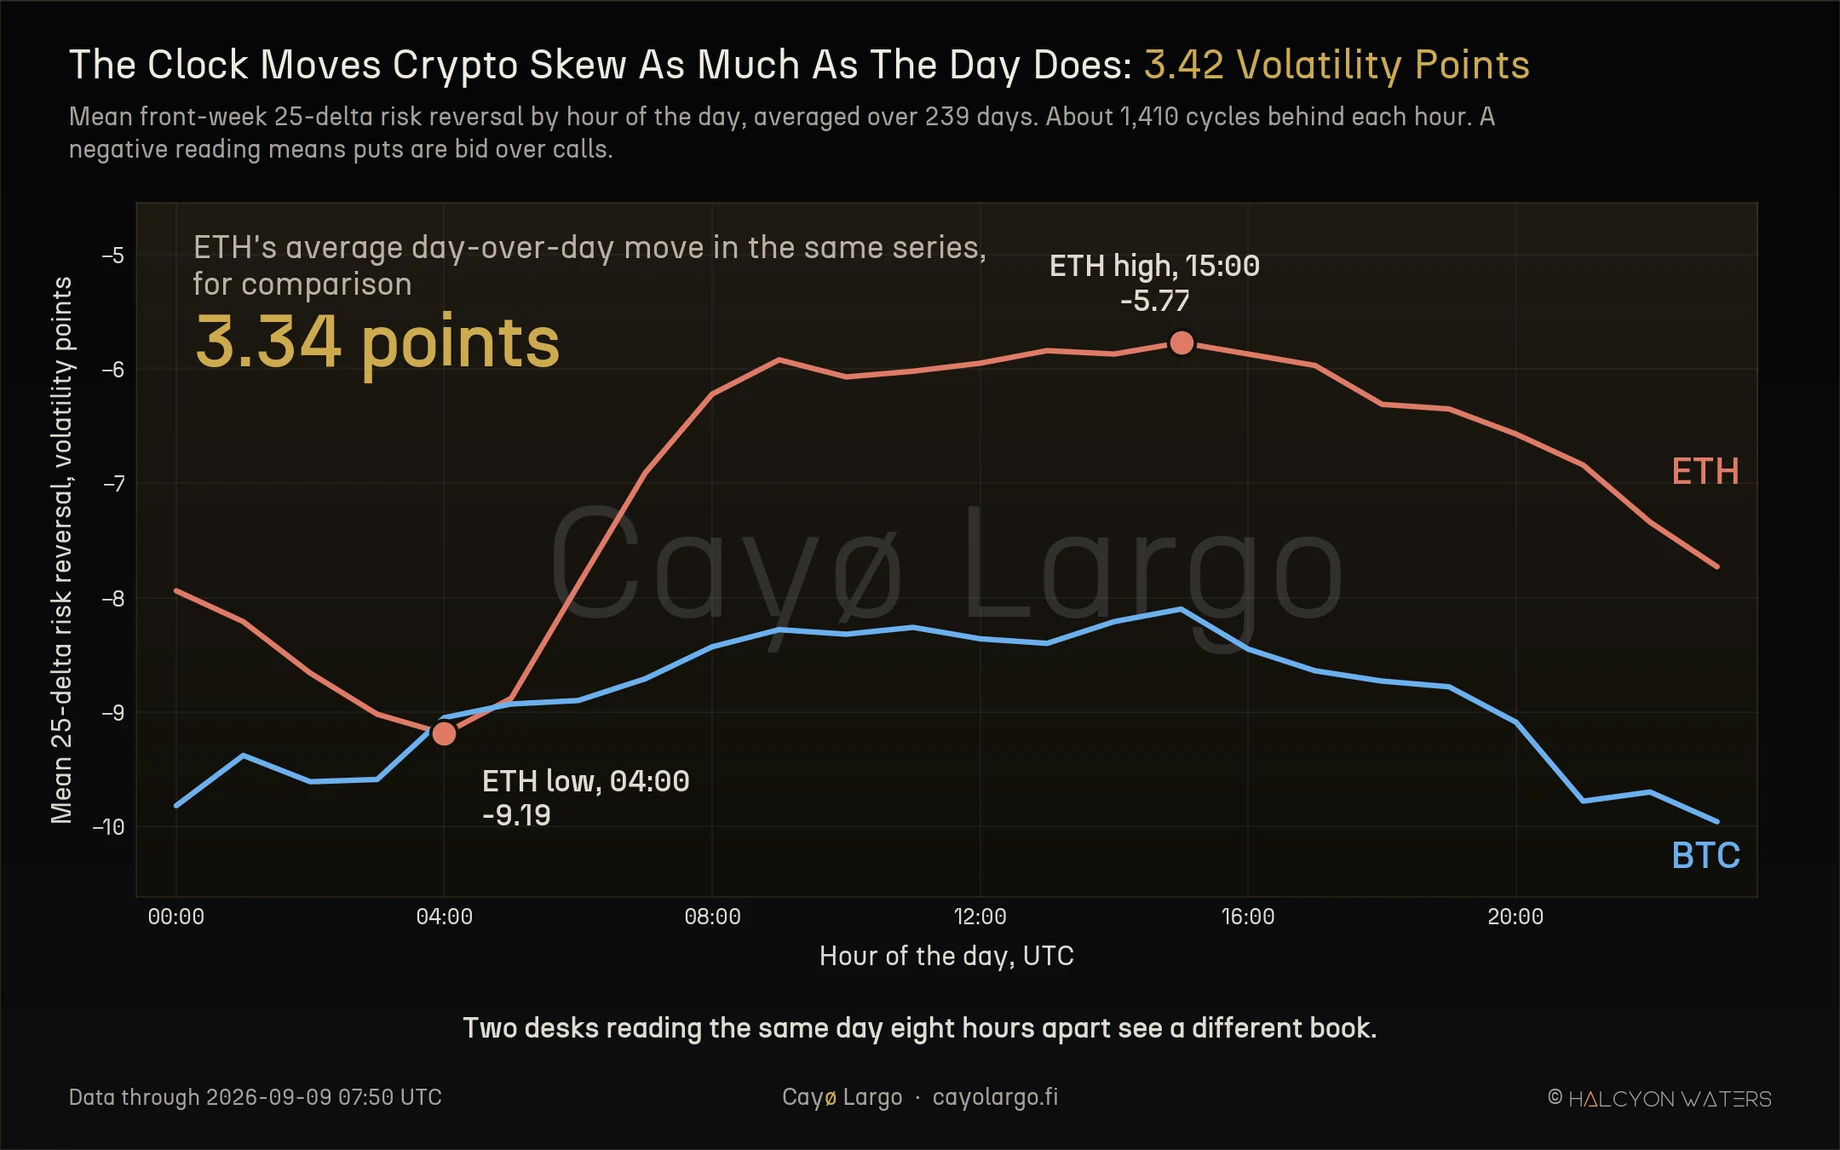
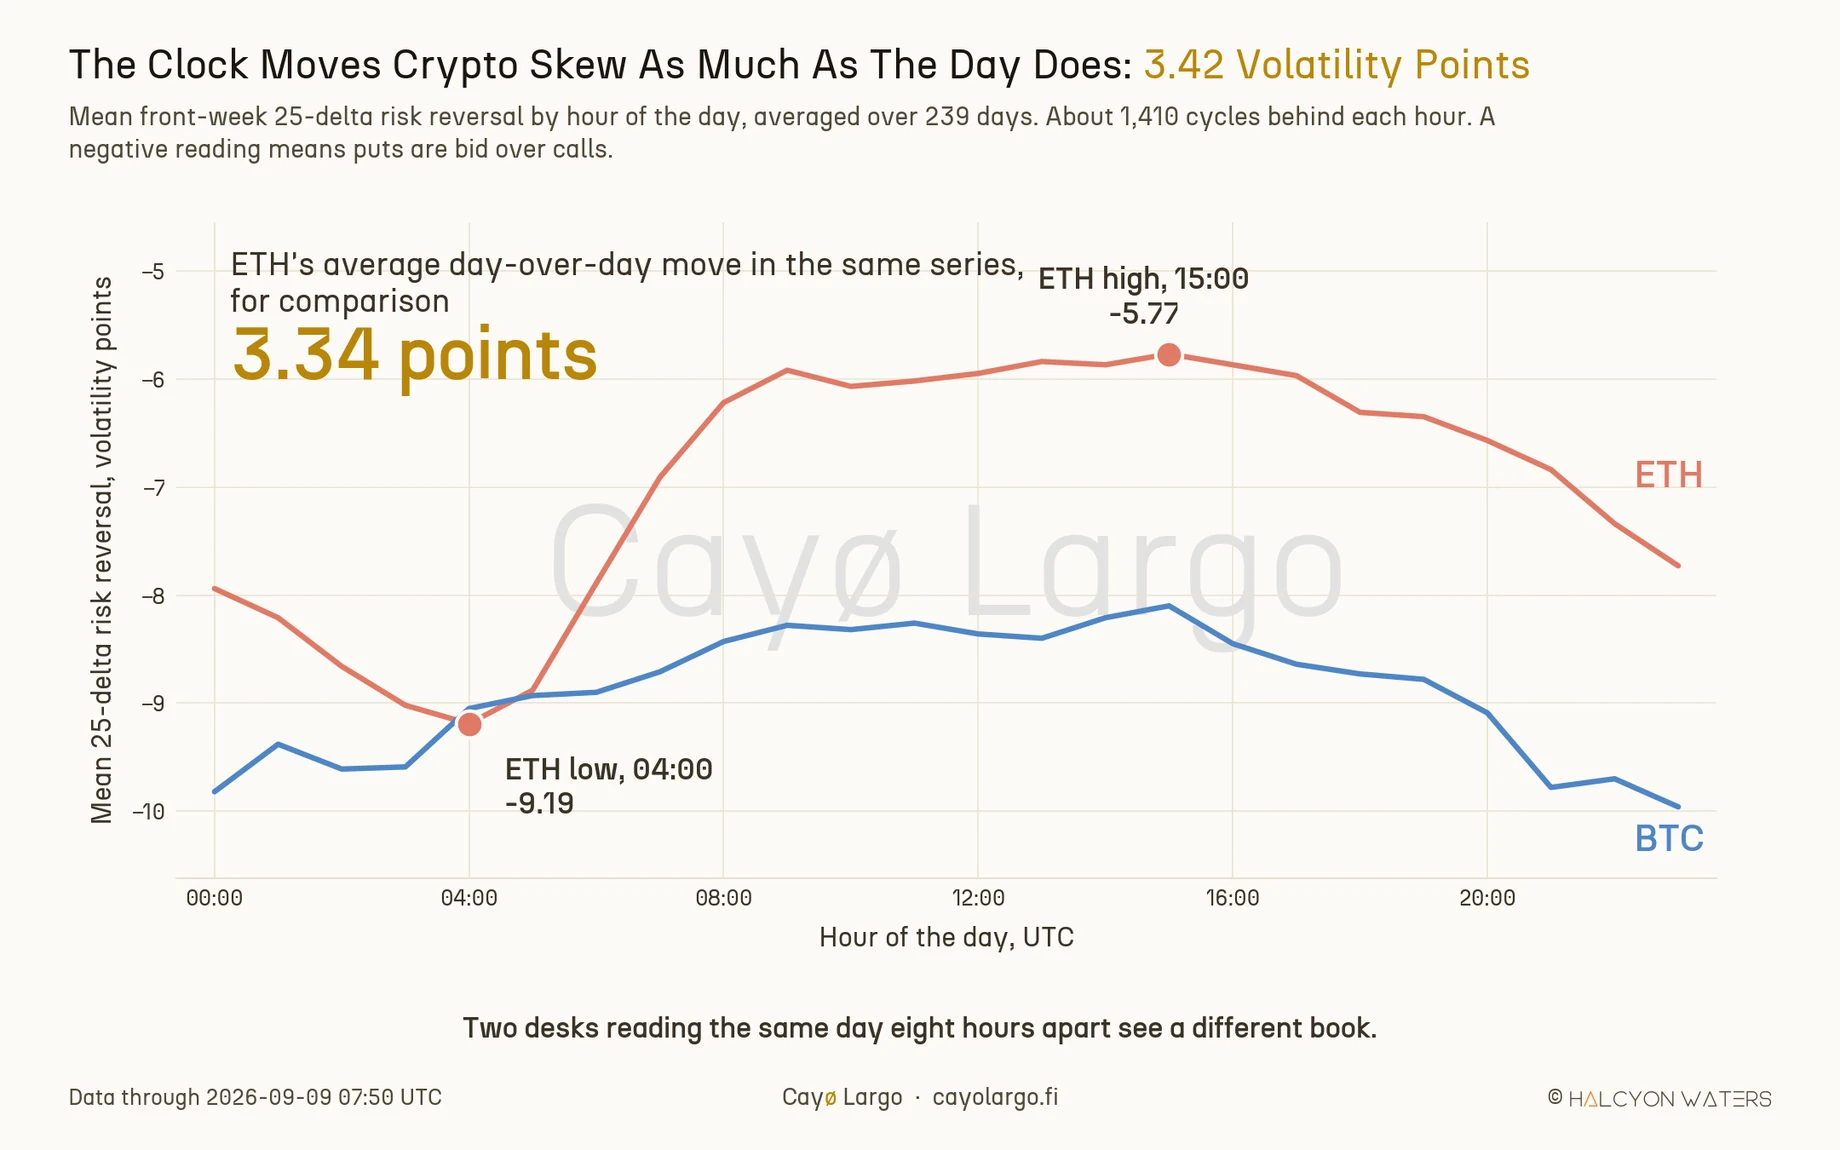
Figure 3: Each point averages about 1,410 cycles at that UTC hour, across 239 days. More negative means puts are bid over calls. This shape is what survives after everything else has averaged out.
Average 239 days of ten-minute cycles by hour of the UTC day and something survives that should have washed out. ETH's front-week risk reversal reads -9.19 at 04:00 and -5.77 at 15:00, a 3.42 point swing from nothing but the clock. BTC traces the same arc, shallower: -9.96 at 23:00 against -8.10 at 15:00, a swing of 1.86.
Now set that beside how much the series genuinely moves from one day to the next. ETH's front-week daily mean changes by 3.34 points on average, across 235 consecutive day pairs. The hour-of-day bias and a full day of real movement are the same size. Read ETH skew at 04:00 on Monday and at 15:00 on Tuesday and roughly half of what you see is the clock.
Not the option count, either. ETH prices 154 front-week options at 15:00 and 139 at 04:00, a 10% difference, against a 3.42 point swing in the reading.
5. How this was measured
Every figure comes from deribit_options_oria_cohort_iv_skew, the table behind the 25-delta skew endpoint, read at Cayø Largo's native ten-minute cadence. The field is risk_reversal_25d_pct, the 25-delta call implied volatility minus the 25-delta put implied volatility, taken from the DTE_7 and DTE_30 expiry buckets. The window runs 13 January to 8 September 2026, 239 days.
Only cycles with data_quality_tier = 'COMPLETE' are included and only consecutive pairs separated by 8 to 12 minutes, so a gap in collection cannot masquerade as a jump in the market. That leaves between 33,019 and 33,807 usable steps per coin per bucket. The daily figures require 100 or more cycles in the day. The same surface is drawn live, without the history, on the volatility landscape skew page.
The 24-hour comparison uses the table's own risk_reversal_change_24h_pct field. For a process with independent increments the typical absolute move scales as the square root of the horizon, what gives the factor of twelve over 144 steps.
6. What this does not say
The front-week risk reversal is not meaningless and we are not arguing that it is. Its daily mean is a usable quantity. ETH's day-over-day movement of 3.34 points in that mean is real market information. A single reading of it, without context, is something else.
The mechanism is still open and we would rather say so than dress a guess as a conclusion. Ruling out the thin book kills the obvious answer without supplying a better one. Our two best candidates are the extreme strike sensitivity of a 25-delta point as expiry approaches zero days and the changing composition of the bucket as contracts roll through it. We have tested neither here. The effect is measured and unexplained and those are two different achievements.
None of this extends past crypto. In le Roux's model of the S&P 500 implied volatility surface, published in October 2007, almost all variation out to two years is captured by the volatility level and one or two further factors. Whether an equity front week behaves the way a crypto one does is a question this data cannot reach.
And it is one window. Nine months of one exchange's book, in a year that had its own character.
7. What a desk would watch next
Quote the window with the number. Every time. A front-week skew reading needs the hour it was taken and the period it was averaged over, the same way an implied volatility print needs its tenor. Two desks reading the same day eight hours apart are looking at books that differ by more than the day itself moved.
There is a version of this that people already do without naming it. When Amberdata's Samneet Chepal backtested the risk reversal on Deribit in Harvesting BTC's Risk-Reversal Premium, in the section of that name, the model entered weekly at a 30-day maturity and hedged on end-of-day exposure. The 30-day maturity was chosen, in the author's words, discretionarily, for liquidity. The numbers above give that choice a second reason the study did not need at the time. At 30 days the quantity being traded moves 0.194 points between observations. At the front week, 2.07.
The wider question of how much to trust an implied volatility number is alive enough that OptionMetrics devoted a July 2026 podcast to it with Brett Friedman, Accuracy of Implied Volatility, comparing implied against realised on the S&P 500. That work asks whether the number forecasts well. This one asks something earlier and simpler: whether the number holds still long enough to be read.
Measure fast things slowly and they will lie to you politely, in decimals.
References
M. le Roux, A Long-Term Model of the Dynamics of the S&P500 Implied Volatility Surface, OptionMetrics research library, October 2007. Argues that almost all variation in the S&P 500 implied volatility surface, out to two years, is captured by the volatility index and one or two uncorrelated factors.
Samneet Chepal (Amberdata), Harvesting BTC's Risk-Reversal Premium, Deribit Insights, 24 January 2023. Backtests the risk reversal on Deribit Bitcoin options from April 2019 to December 2022, entering weekly at a 30-day maturity and delta-hedging on end-of-day exposure.
Imran Lakha, Major Repricing in Front-End Skew, Deribit Insights, 13 December 2023. Reports the weekly skew shifting to a 3 to 4 volatility put premium as short-dated downside protection was bid, in the section headed "Big Repricing of Skew".
Brett Friedman, Accuracy of Implied Volatility, OptionMetrics, 1 July 2026. Examines S&P 500 and volatility index history to ask how well implied volatility forecasts what the market goes on to do.
Frequently Asked Questions
How much does the 25-delta risk reversal move between readings?
On Bitcoin's front-week expiry bucket it moves 2.07 volatility points from one ten-minute cycle to the next, averaged over 33,777 consecutive steps between 13 January and 8 September 2026. That is 21% of the metric's own average absolute level. The same measure on the 30-day bucket is 0.194 points, about 4% of its level.
Is front-week skew noise just a thin option book?
No. Sorting Bitcoin's front-week cycles by how many options priced in each one, the cycles with fewer than 120 options moved 2.04 points per cycle and the cycles with 250 or more moved 3.09. The movement is larger on fuller books, so a sparse smile and a wide 25-delta interpolation cannot be the cause.
Does the front-week risk reversal trend or oscillate?
It oscillates. If each ten-minute move were independent of the last, 144 of them would carry the number 12 times as far as one. Bitcoin's front-week risk reversal travels 6.44 points over 24 hours against 2.07 per cycle, a factor of 3.1. Most of the movement reverses inside the day.
Does the time of day affect a crypto skew reading?
Yes, measurably. Ethereum's front-week 25-delta risk reversal averages -9.19 at 04:00 UTC and -5.77 at 15:00 UTC across 239 days, a swing of 3.42 volatility points from the clock alone. Its average day-over-day move in the same series is 3.34 points, so the hour you read it matters as much as the day.
Related Articles
Why Deep-OTM IV Momentum Is Noise, Not Signal
A stable IV smile but wild IV momentum at deep-OTM strikes. Why thin-strike microstructure is noise, not repricing, shown live on Deribit multi-coin data.
Crypto Put Skew vs Volatility Level: Reading the Gap
Implied volatility fell on all six coins overnight and put skew did not follow. On five of six, skew now ranks higher than the volatility level itself.