Does Copying Deribit Block Trades Pay Off?
Block-trade feeds post big crypto options trades with a button to copy them, as if size meant knowledge. We tested the tape they draw on: 24,079 Deribit Bitcoin and Ether blocks, each copied minutes after the print and held to settlement. On average the copier lost money. The print told a copier too little and the spread did the rest.
Introduction
At 03:43 UTC on 9 October 2026 someone sold 200 Bitcoin puts on Deribit. Strike 88,000 USD, 30 October expiry, 0.0736 BTC. Eighty-one seconds later, at 03:44 UTC, Global Option Monitor, the block-trade feed Paradex launched on X in September, posted it as a payoff chart: receive 1.2 million USD, risk 16.4 million USD, plus a link to copy the trade on Paradex (Figure 1).
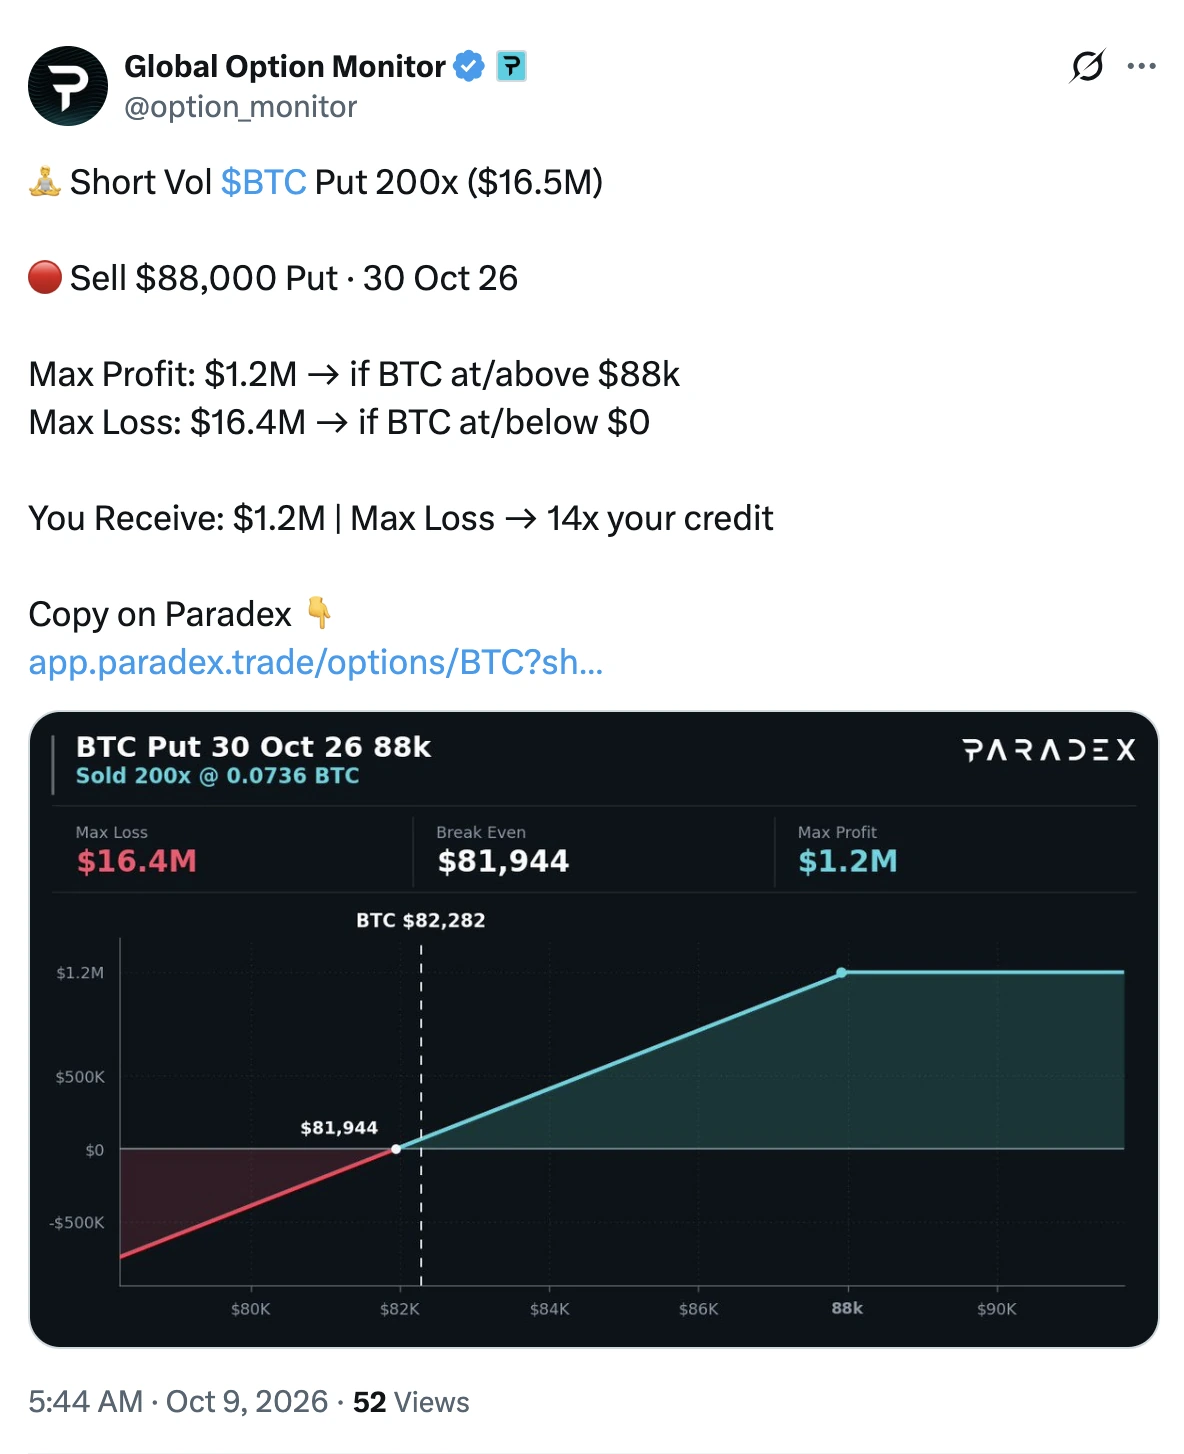
Figure 1: The post as Global Option Monitor published it on X at 03:44:37 UTC on 9 October 2026, captured by us the same day. Its strike, expiry, size, price and Bitcoin level of 82,282 USD match block BLOCK-302351 on our Deribit tape, printed at 03:43:16 UTC, 81 seconds before the post. The time of the print and the five other prints of the same put come from our tape, not from the post.
Feeds like this rest on an old belief that traders have argued about for years: a big trade knows something. In January 2021 Tony Stewart, writing on Deribit Insights about a run of aggressive Bitcoin call buying, saw possible copy cats behind "The One" buyer in the open interest. When the buying stopped on a fall in price, the "he knows something" speculation cooled. In equities the belief has academic weight. Pan and Poteshman (around 2004) showed that option volume from buyers opening new positions predicted stock returns well enough for a strategy built on it to earn about 40 basis points a day. Keep in mind where their data came from, though: the exchange's own record of who opened what, which nobody outside it could see in real time.
A copy button turns the belief into a trade. Hence the question a follower would ask: if you had copied every Deribit block a few minutes after it printed, at the prices on the screen and then held it to expiry, what would you have made? To answer it we read 29,701 Bitcoin and Ether blocks printed between 17 January and 9 October 2026, of which 25,572 had fully settled by 8 October. In section 1 we follow that 88,000 put minute by minute on our tape. Sections 2 and 3 grade two of the feed's own posts that have settled, one that lost and one that made money. Section 3 also names who stands on each side of a block. Sections 4 to 6 grade every copy against settlement, test whether the print carried any information and split the result by structure. The deliverable is one number a follower can act on, namely what a copy costs. Readers who trade blocks can skip to section 4, What a copier would have made.
One distinction matters before any number. We test Deribit's block tape, not any feed's selection. Global Option Monitor picks blocks from five venues and we cannot see how it picks them. Of its posts that have settled, we grade two below, each picked by a rule we state. The copy that lost the most lost all of it. The first one that matched our tape made money.
Figure 2 puts the whole result on one page before we take it apart. Every dot is a block a follower could have copied.
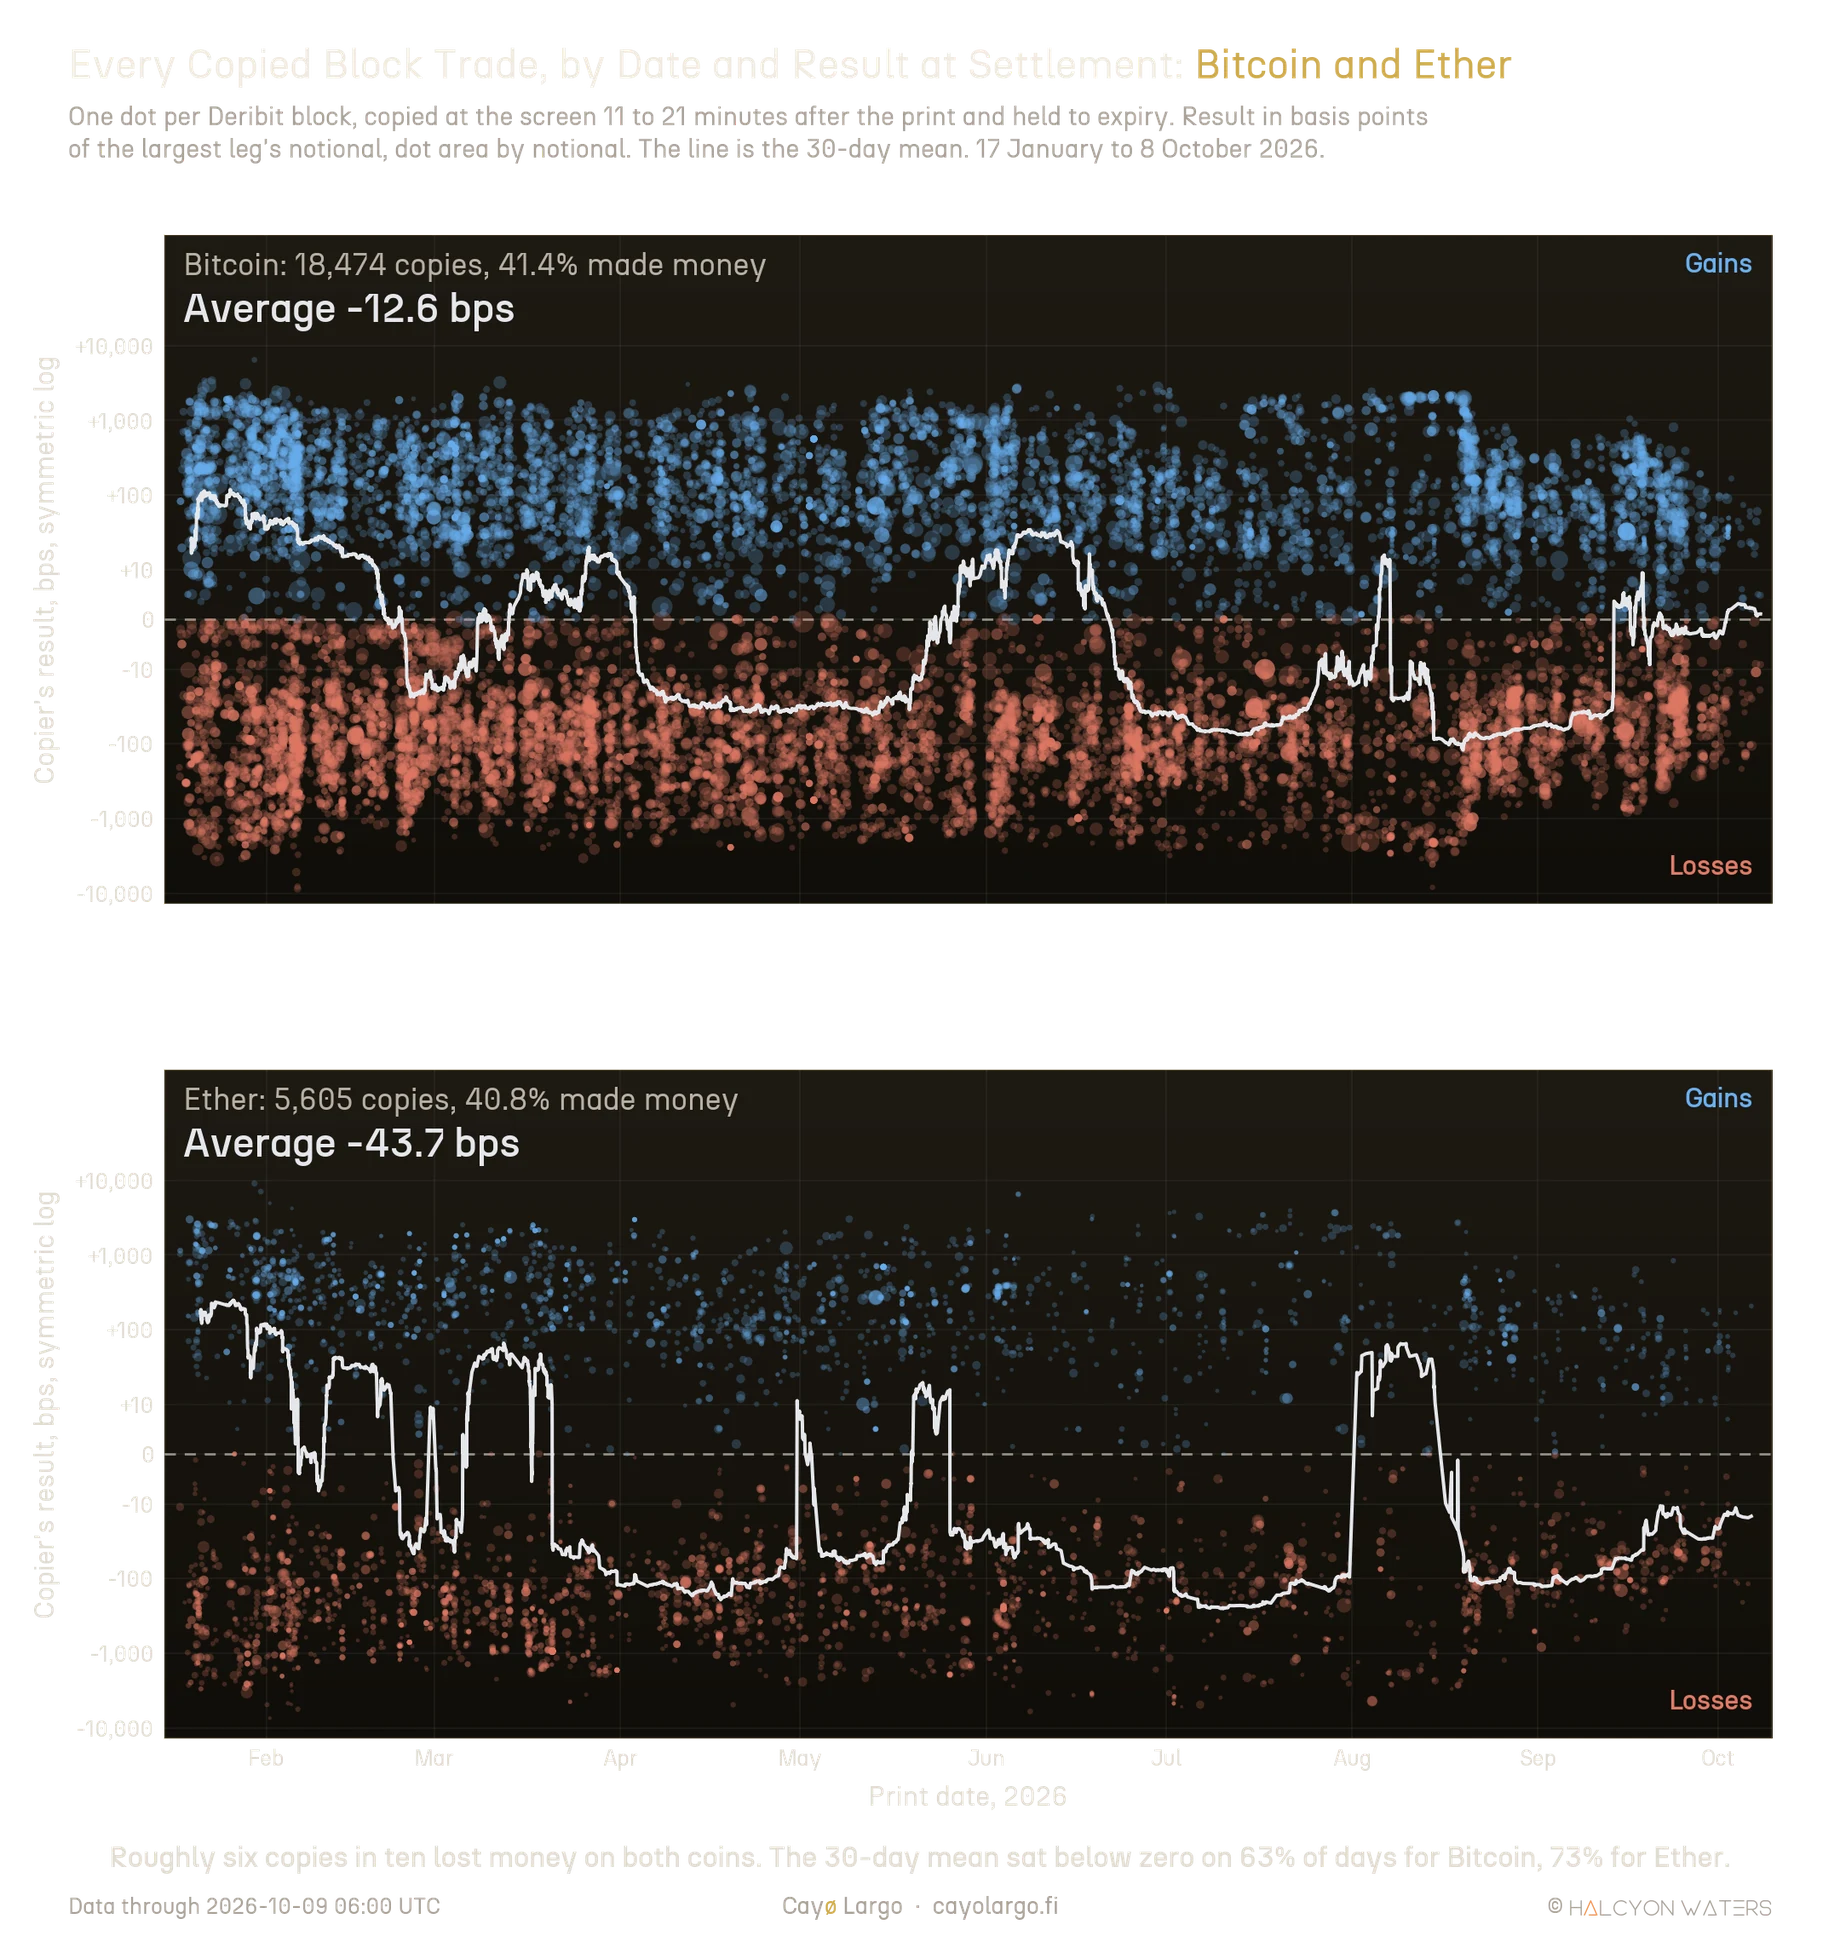
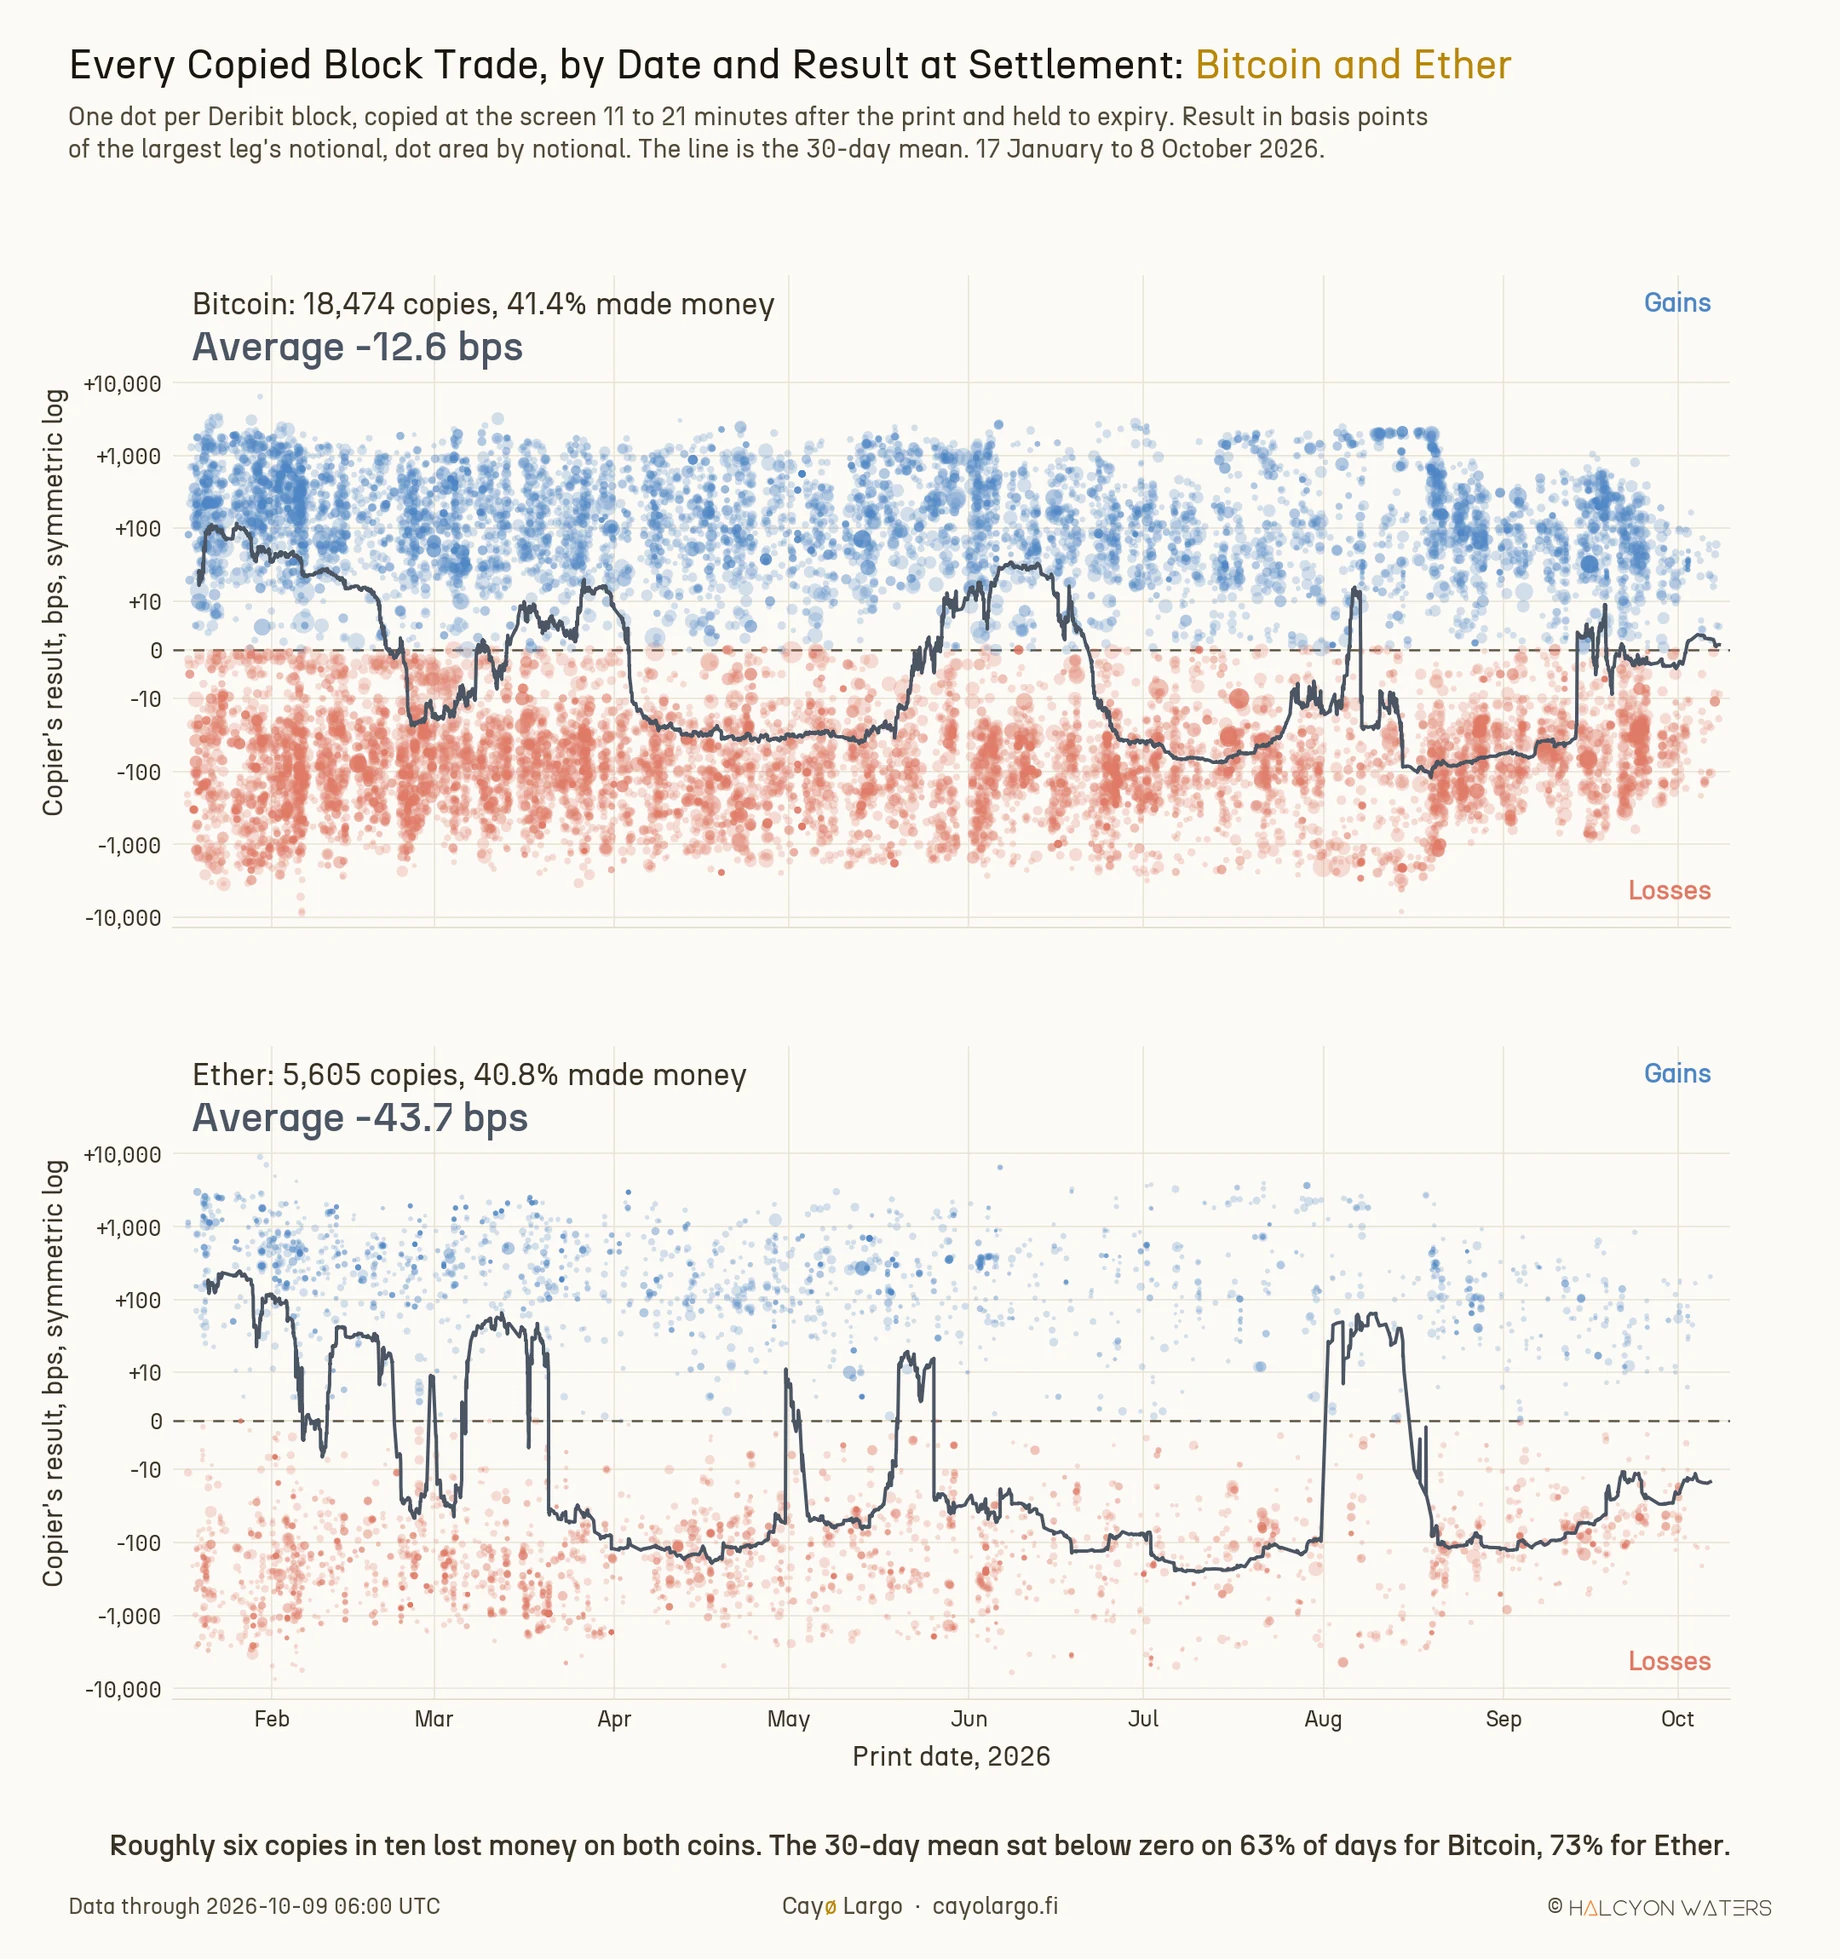
Figure 2: Every Bitcoin and Ether block a follower could have copied, by the day it printed and what the copy returned at settlement. Blue made money and coral lost it. The vertical axis is logarithmic on both sides of zero, so a dot at -1,000 bps lost ten times as much as one at -100. The line, the 30-day mean, sat below zero on 63% of days for Bitcoin and 73% for Ether.
1. The posted put, minute by minute
Our tape holds the 03:43 print to the fourth decimal. It also holds what one post cannot show. Between 03:11 and 04:34 UTC that put printed as a block six times, from 100 to 444 contracts each and 1,588 contracts in all. That looks less like six ideas than one desk working one order.
Table 1 lists the six prints as they reached the tape, each beside the best bid the screen showed at the last ten-minute snapshot before it.
| Time, UTC | Contracts | Block price, BTC | Screen bid before it, BTC (size) |
|---|---|---|---|
| 03:11:37 | 100 | 0.0769 | 0.0750 (1) |
| 03:43:16, posted 03:44:37 | 200 | 0.0736 | 0.0735 (1) |
| 03:45:43 | 244 | 0.0732 | 0.0735 (1) |
| 04:01:48 | 300 | 0.0725 | 0.0720 (45.9) |
| 04:17:24 | 300 | 0.0724 | 0.0715 (1) |
| 04:34:46 | 444 | 0.0716 | 0.0715 (1) |
| All six | 1,588 | 0.0728 avg | 1 to 45.9 on the bid |
Prices are per put, in BTC. The figure in brackets is how many contracts the screen bid was good for.
All six printed below the exchange mark. The first sat 0.0019 BTC over the last screen bid. The five after it, including the posted one, sat between 0.0003 BTC under the bid and 0.0009 BTC over it. The seller paid for size, not for a better price. The implied volatility on the prints was 31.41% on the first and 29.29% on the last, while Bitcoin rose. The screen bid was one contract deep on 10 of the 15 snapshots from 02:40 to 05:00 UTC and never deeper than 47.3. In other words, a copier wanting to sell the posted 200 puts on Deribit's screen would usually have found one contract waiting. Figure 3 shows the same 83 minutes as a picture.
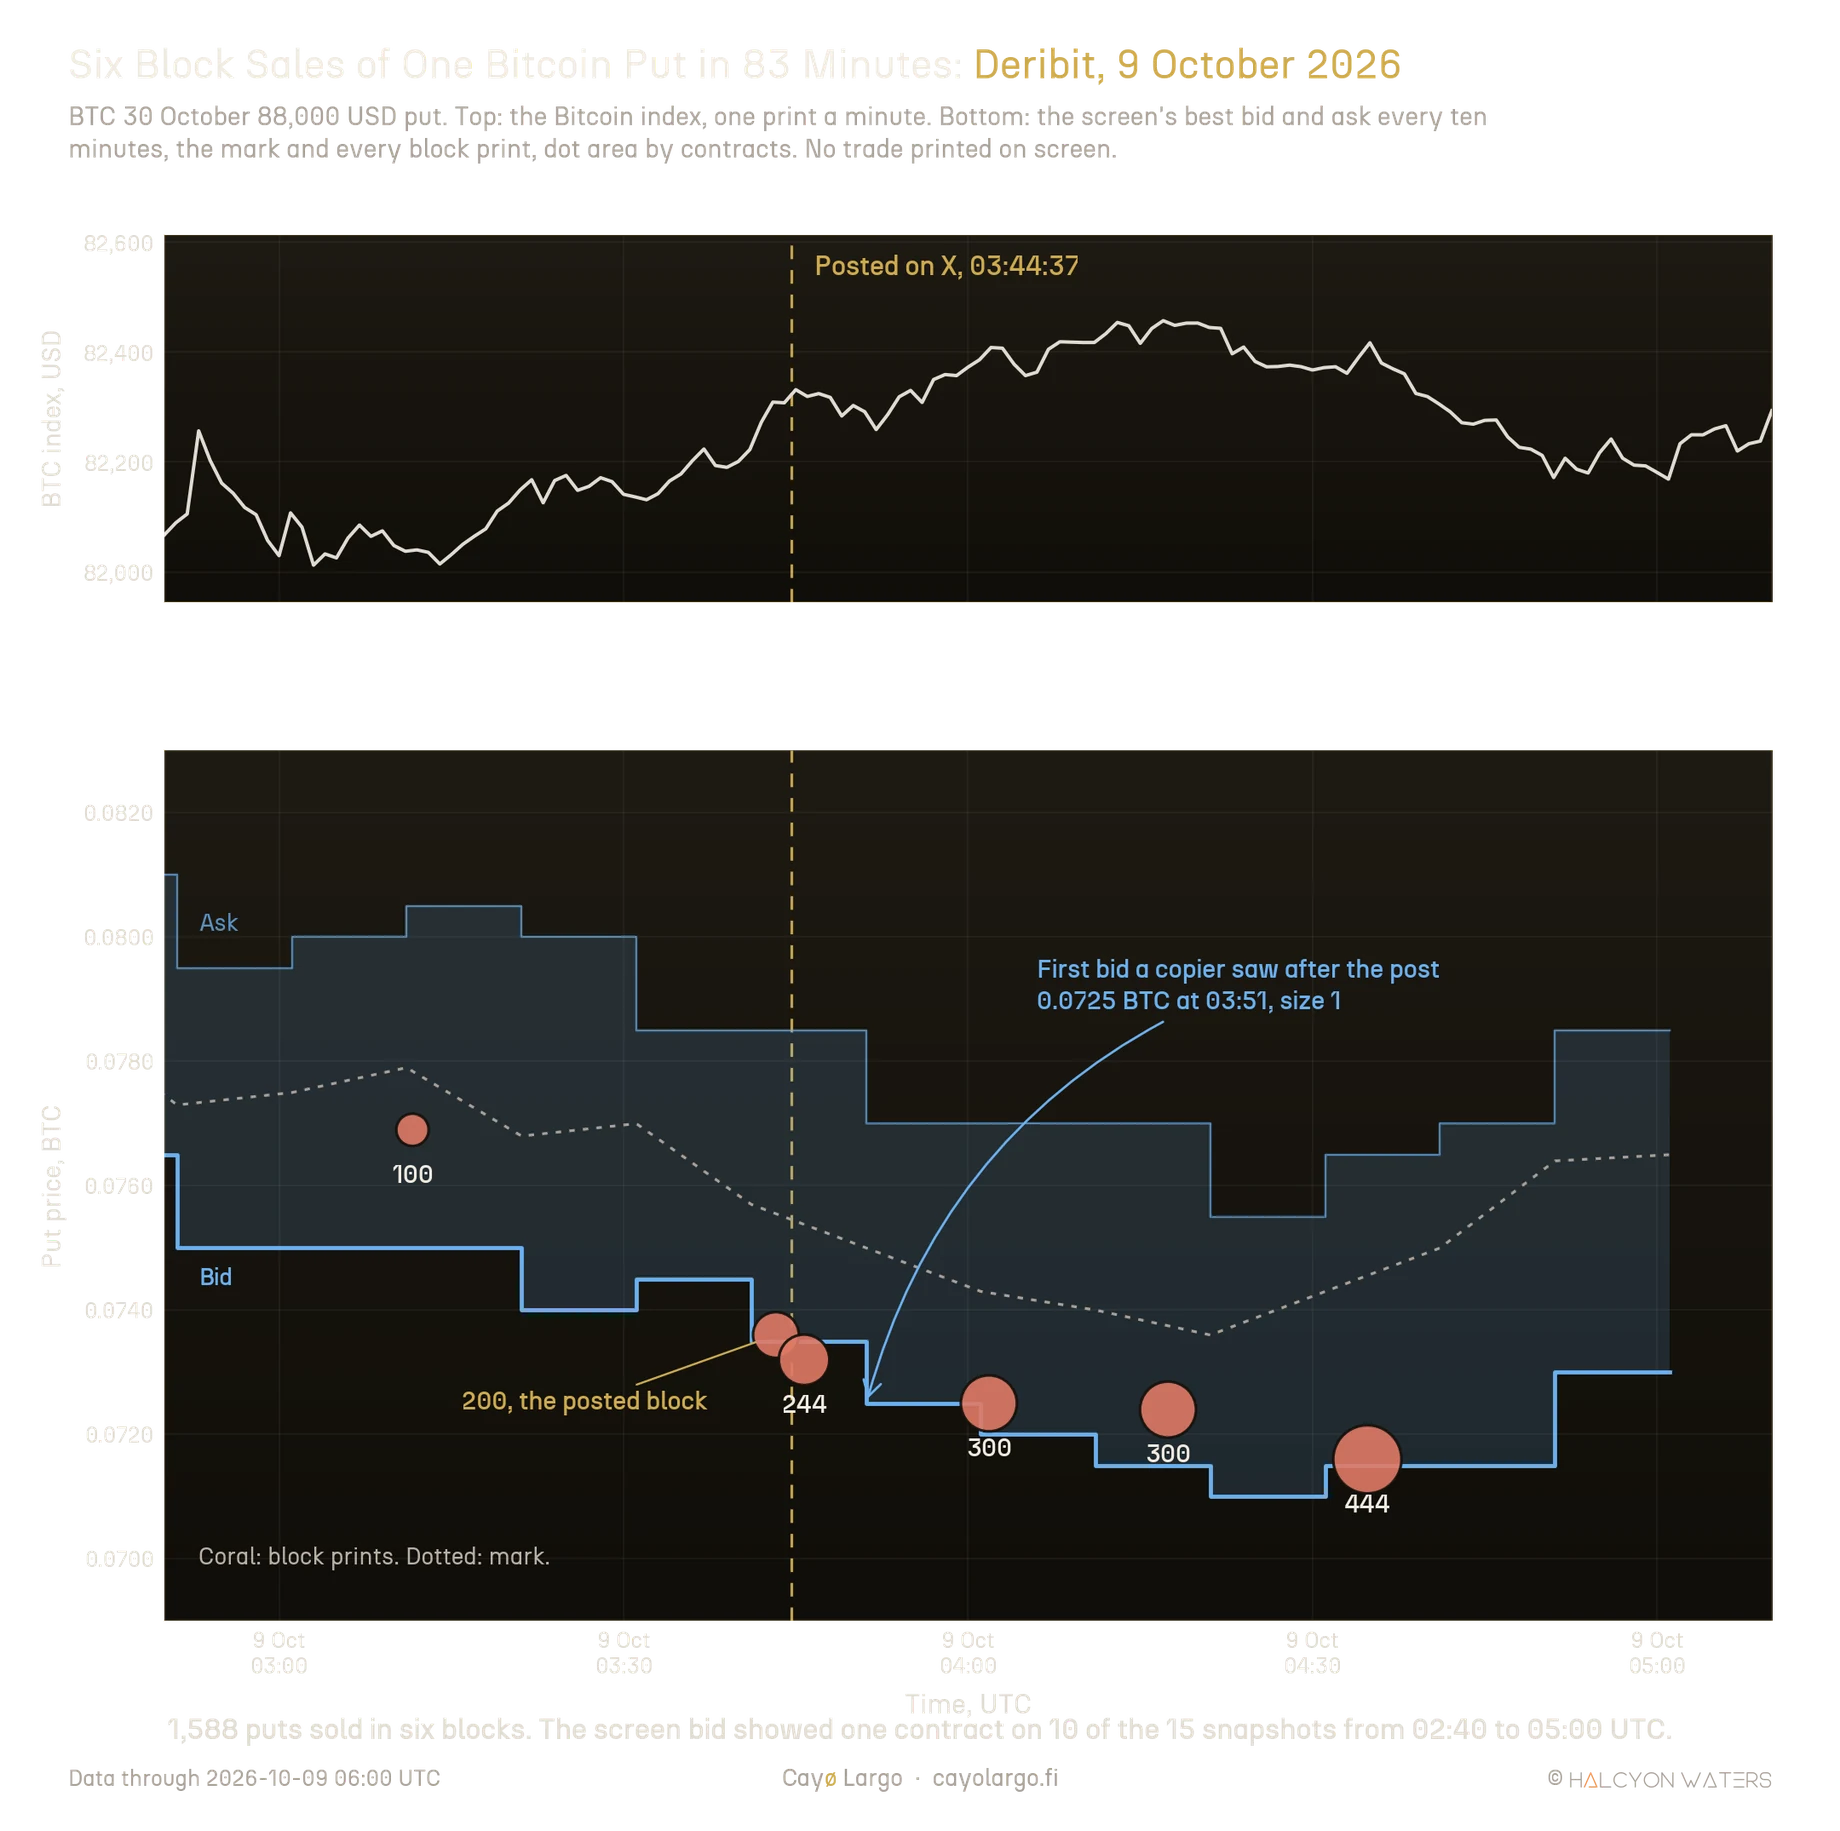
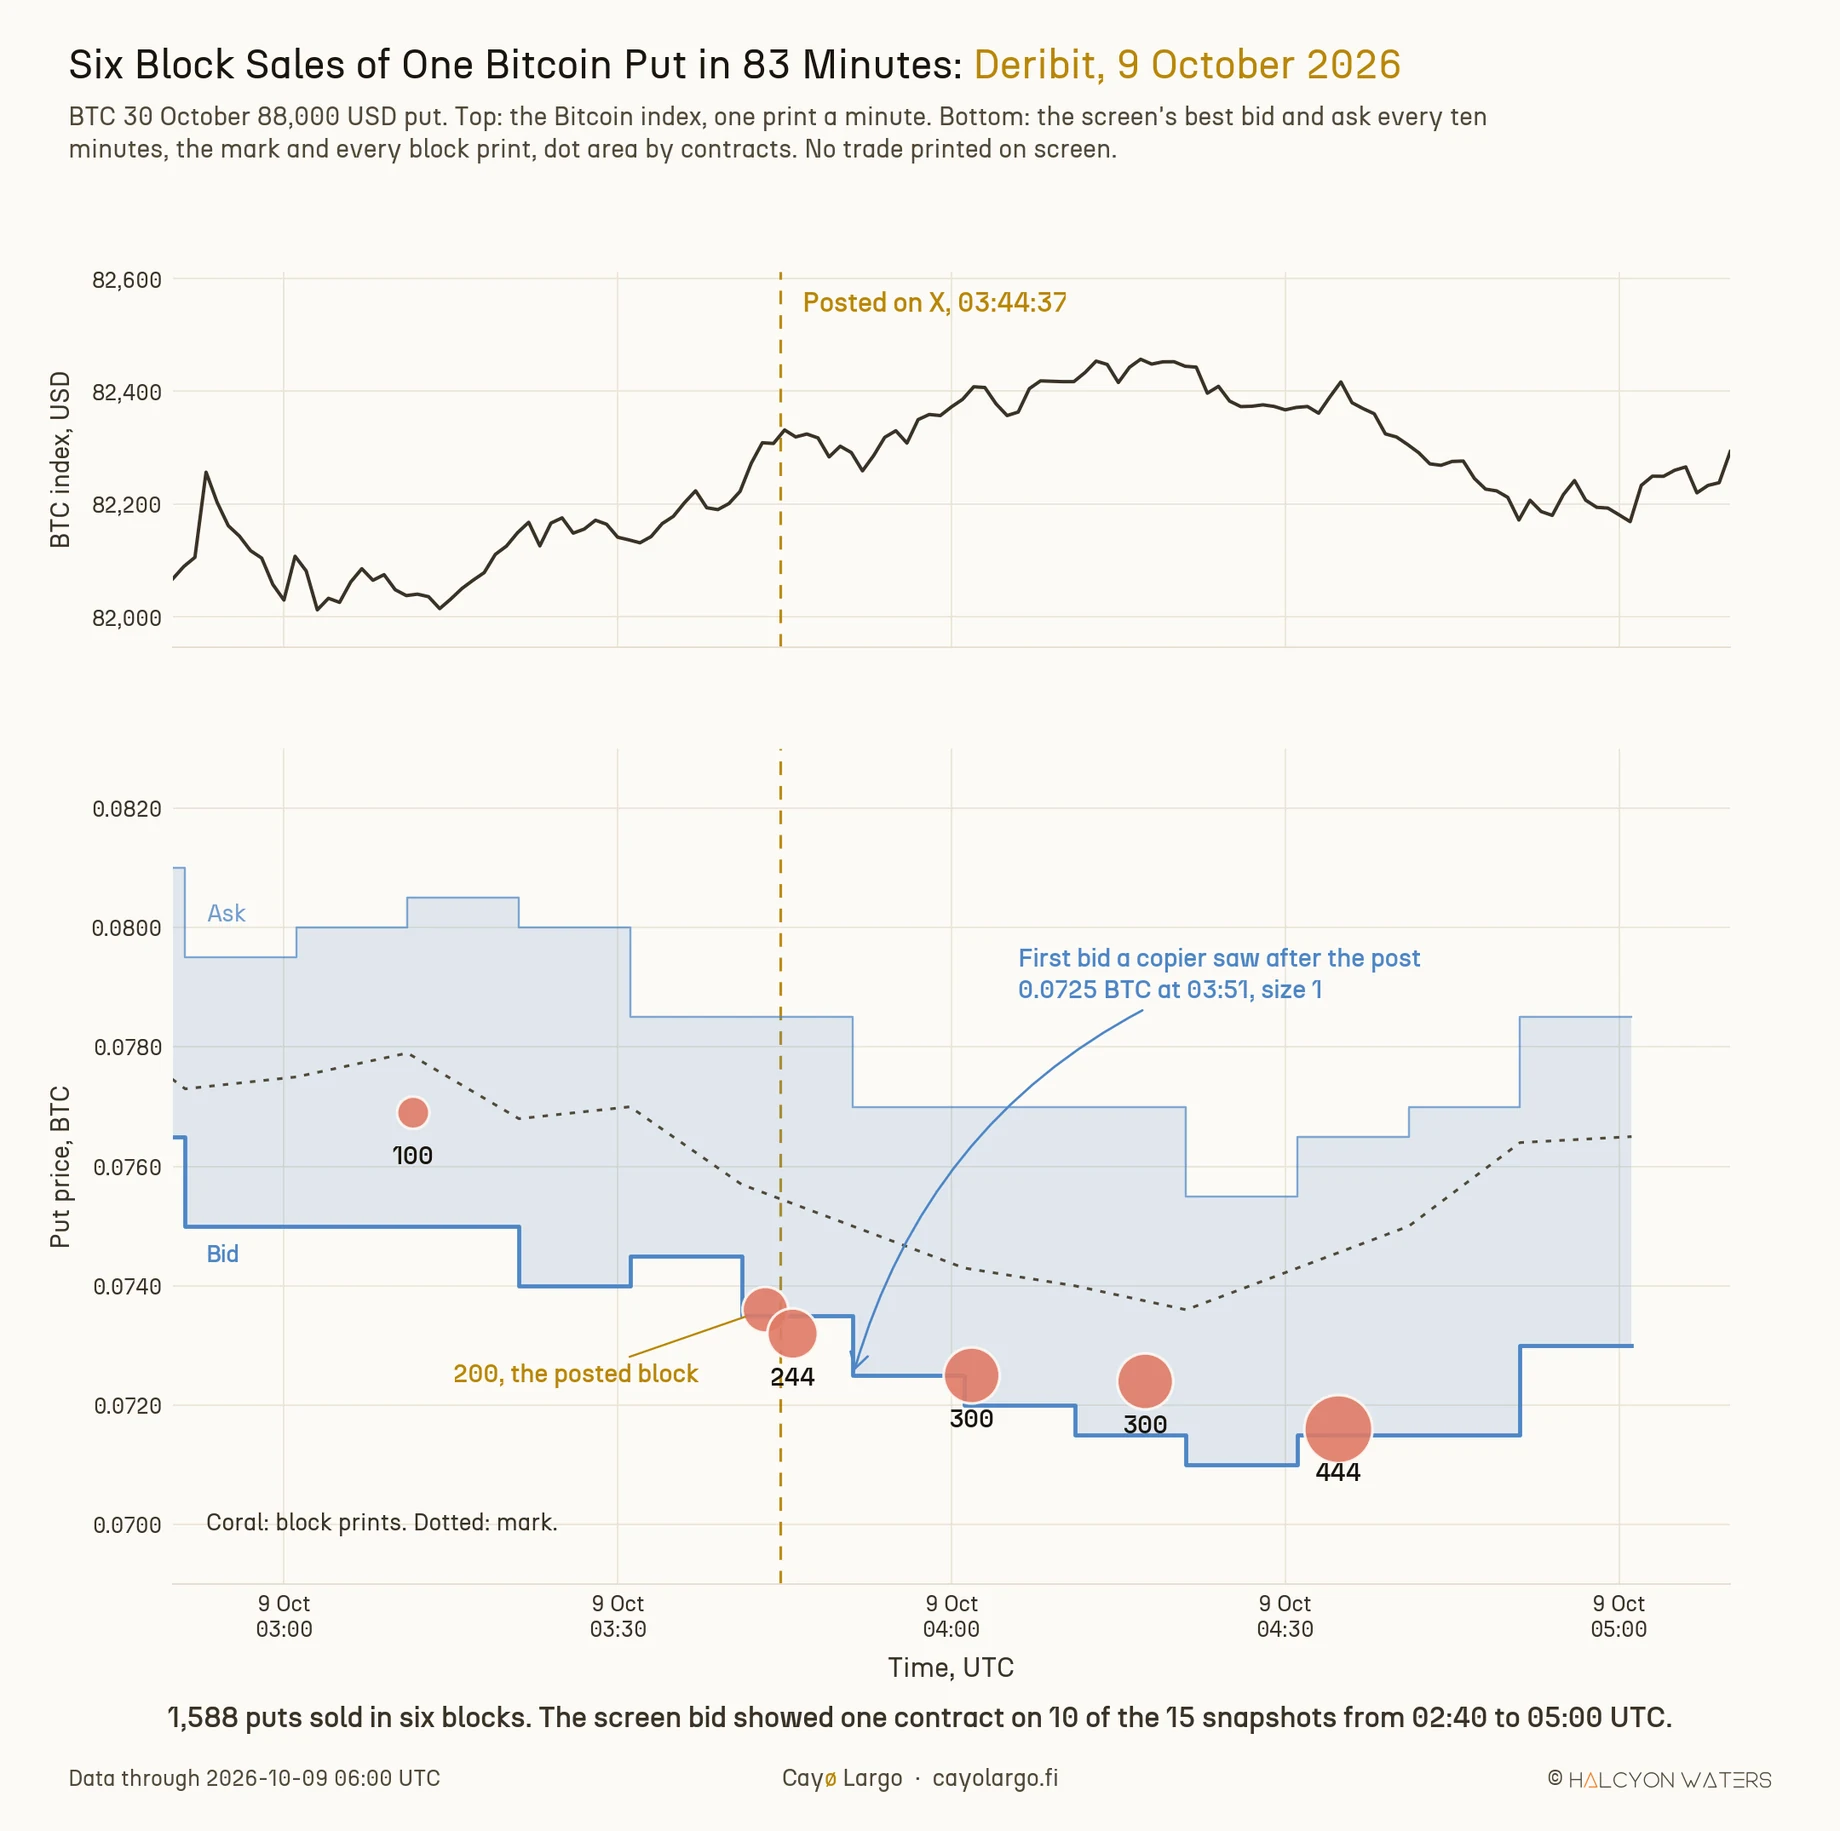
Figure 3: The 9 October 88,000 put from 02:50 to 05:10 UTC. Six block sales, coral, stepped down from 0.0769 to 0.0716 BTC while Bitcoin rose. The blue band is the screen's bid and ask, read every ten minutes. Nothing traded on the screen in these hours. The first bid a copier could have hit after the post was 0.0725 BTC, for one contract.
Figure 4 draws the posted trade at expiry for both sides. The block sold the put at 0.0736 BTC, $1,211,195 of premium with Bitcoin at 82,282 USD. A copier following our rule, which waits for the first snapshot at least ten minutes after the print, sold at the 04:00 UTC bid of 0.0720 BTC for $1,186,026, a bid good for 45.9 contracts against the 200 posted. Their break-evens at expiry are 81,944 USD and 82,070 USD. The lower panel follows both positions every ten minutes. At the mark the taker was $46,093 down at 05:00 UTC, $103,573 up at 12:10 and $20,639 down again at 13:40. All inside ten hours. The put has about 508 hours to run before it expires on 30 October. The copier ended that stretch $45,809 down at the mark and $75,492 down had it bought the put back at the ask. The put settles on 30 October and only then can it be graded.
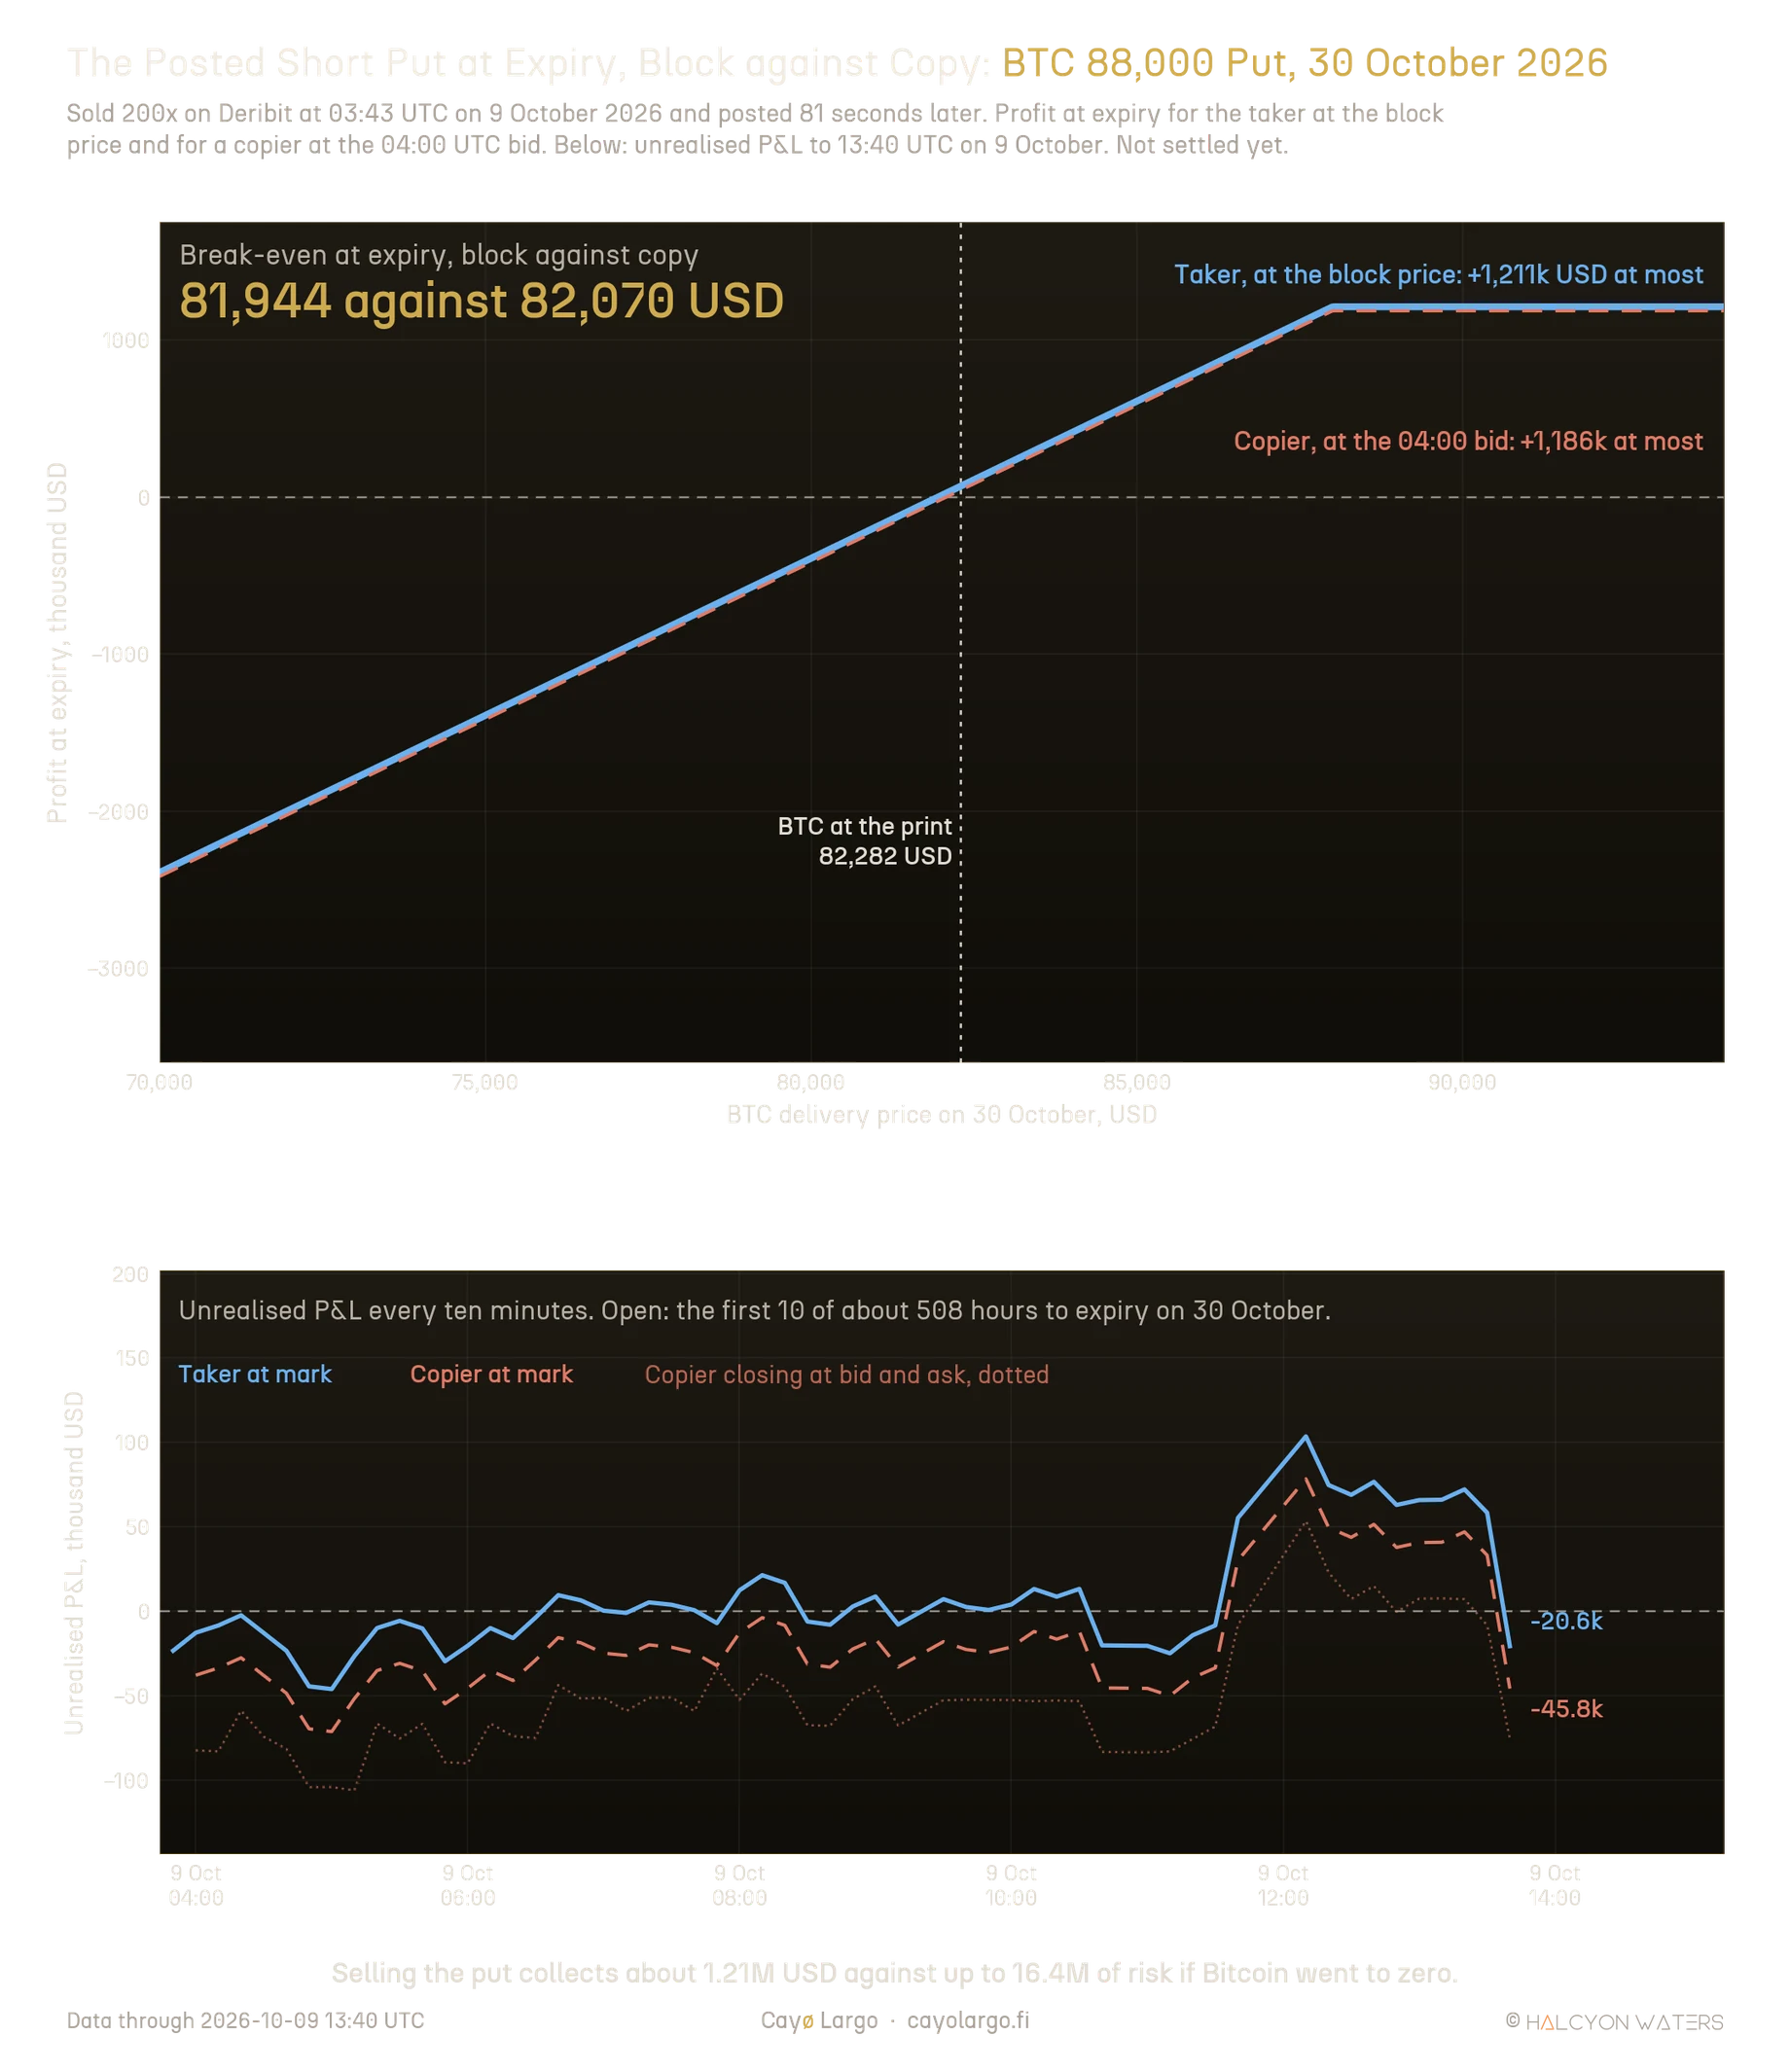
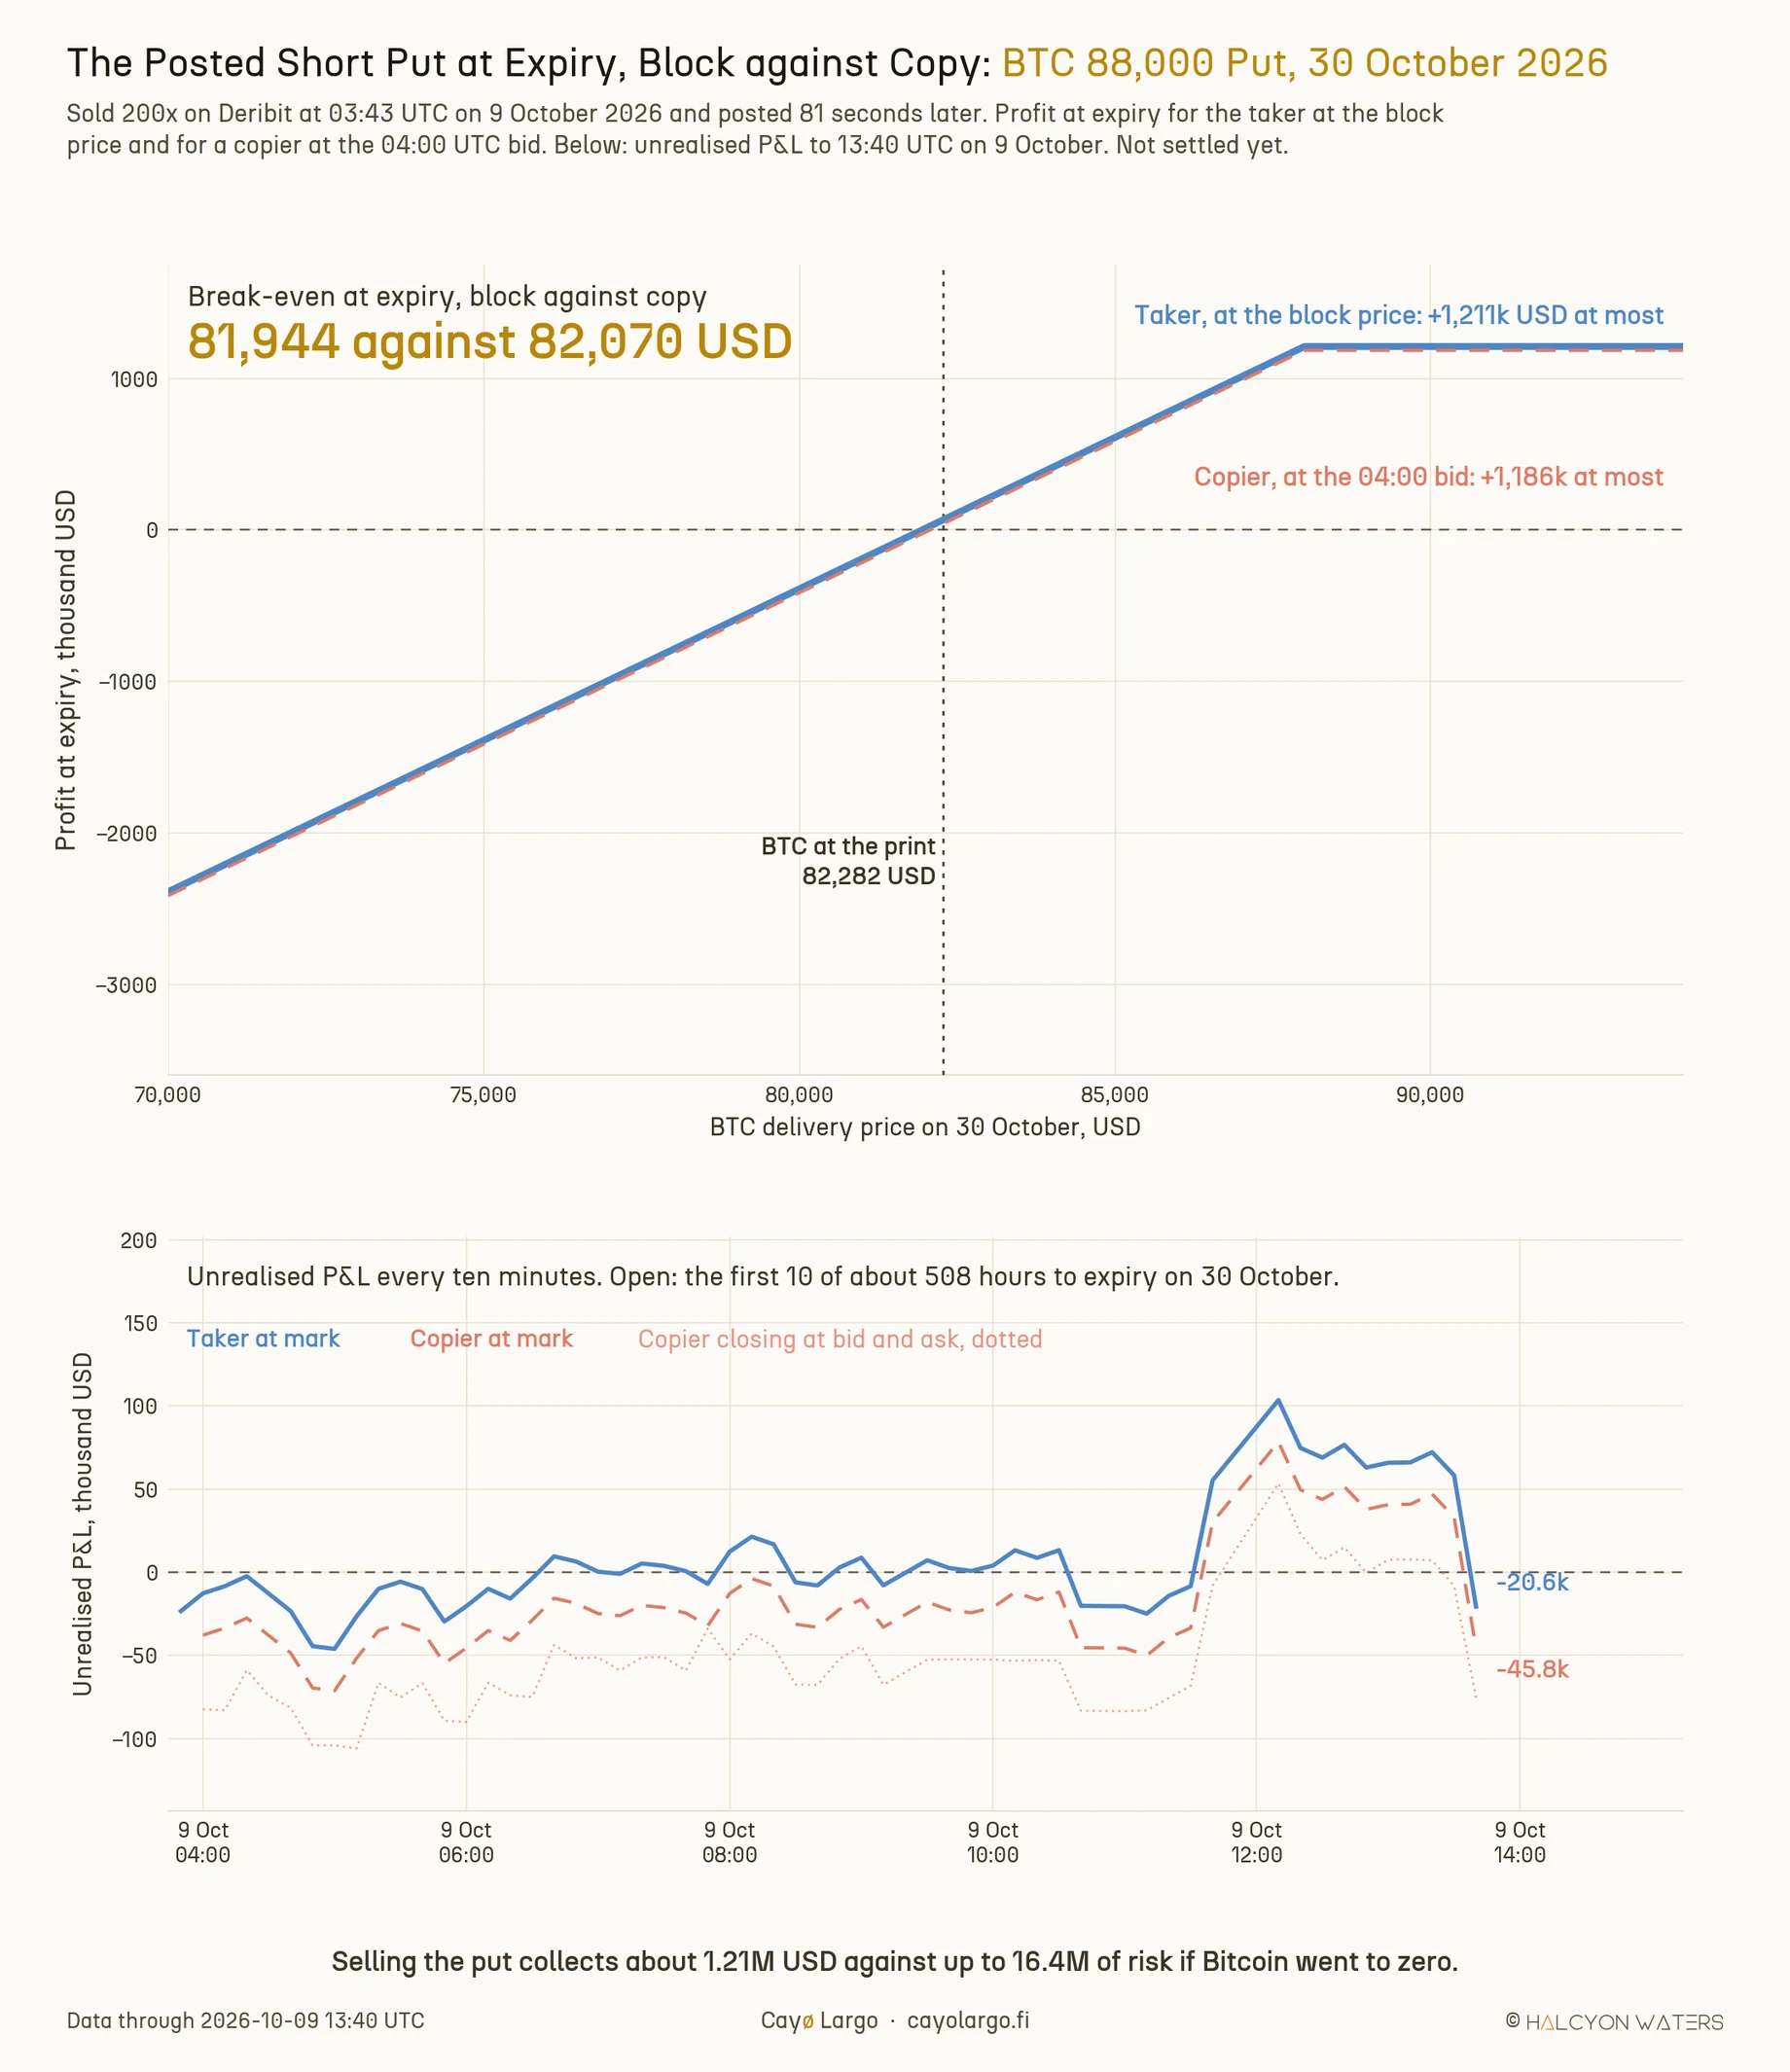
Figure 4: Top: the posted short put at expiry, for the block's seller and for a copier at the 04:00 UTC bid. The two lines differ by the 25,169 USD the copier gave up on entry. Bottom: unrealised P&L every ten minutes to 13:40 UTC on 9 October, the first 10 of about 508 hours to expiry, at the mark for both sides and, dotted, for the copier buying the put back at the ask. Not settled.
2. Three calls that expired worthless
Two of the feed's own posts have settled and can be graded here, each picked by a rule stated up front. We start with the worst. We looked for the posted trade whose copy lost the most. Among the Deribit calendars, diagonals and structures of three or more legs printed since the feed's first post, with every leg settled by 8 October, a largest leg of at least 2 million USD and no futures hedge inside the block, we ranked all 109 by what a copier lost. Then we checked the feed from the top of that list. The first block on it had been posted (Figure 5). Keep in mind that copies of 47.7% of those 109 blocks lost money, so what follows is the bad tail of the pool, not its rule.
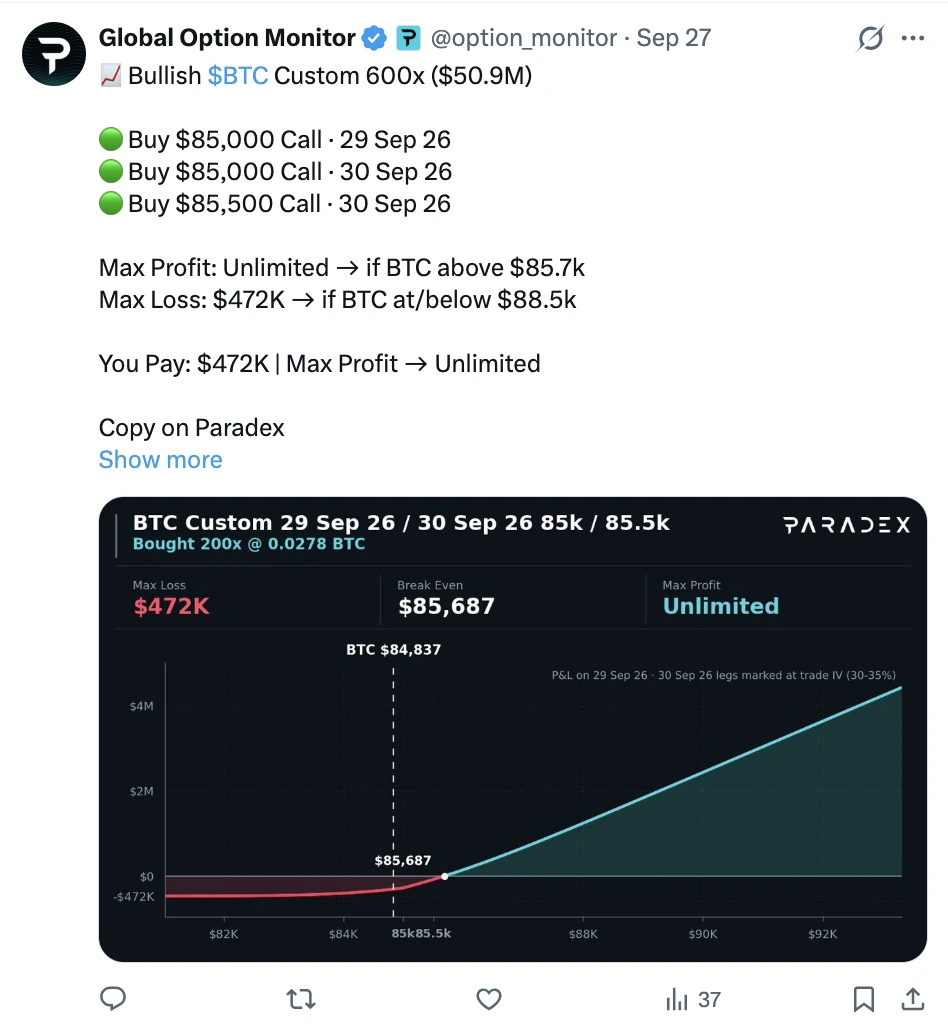
Figure 5: Global Option Monitor's post of 27 September 2026, captured by us on 9 October. Its three legs, size of 200, net price of 0.0278 BTC and Bitcoin level of 84,837 USD match block BLOCK-289462 on our Deribit tape, printed at 11:48:22 UTC. The card shows only the date. The post's ID on X records the time it went out, 11:49:52 UTC, 90 seconds after the print.
The block bought 200 of each of three Bitcoin calls: the 85,000 USD strike expiring on 29 September and the 85,000 and 85,500 USD strikes expiring on 30 September. It paid 0.0278 BTC per set of three, $471,696 in all, for a bet that Bitcoin would stand above 85,000 USD at one of the next two settlements. The post called the upside unlimited, which is true of every long call. A copier acting at the 12:00 UTC snapshot paid the ask on each leg (Table 2).
| Leg, expiry | Block, BTC | Copier paid, BTC | Settled at, USD |
|---|---|---|---|
| Buy 200x 85,000 call, 29 Sep | 0.0090 | 0.0080 | 84,004.63 |
| Buy 200x 85,000 call, 30 Sep | 0.0115 | 0.0105 | 83,349.34 |
| Buy 200x 85,500 call, 30 Sep | 0.0073 | 0.0080 | 83,349.34 |
| Paid, USD | 471,696 | 449,961 | 0 back |
Prices are per call, in BTC. The last row converts each side's total premium to USD at the index of the moment it was paid. The copier paid less than the desk because the desk had paid the maker $64,404 over mark at the print, more than the $25,469 spread the copier crossed. What went to zero was the position itself.
Bitcoin rose to 85,089.70 USD at 13:34 UTC, an hour and three quarters after the print. It spent nine minutes in all above 85,000 USD (Figure 6). It never reached 85,500 USD. It settled at 84,004.63 USD on 29 September and 83,349.34 USD on 30 September. All three calls expired worthless. The block's buyer lost $471,696 and the copier lost every dollar of the $449,961 it paid. The post's own break-even of 85,687 USD was never touched. At the mark the trade was never in profit. The lower panel of Figure 6 tracks it every ten minutes. The block's buyer was at its best at 14:00 UTC on 27 September, still $22,710 down, the copier $976 down. From there the value drained away over two and a half days. It never recovered.
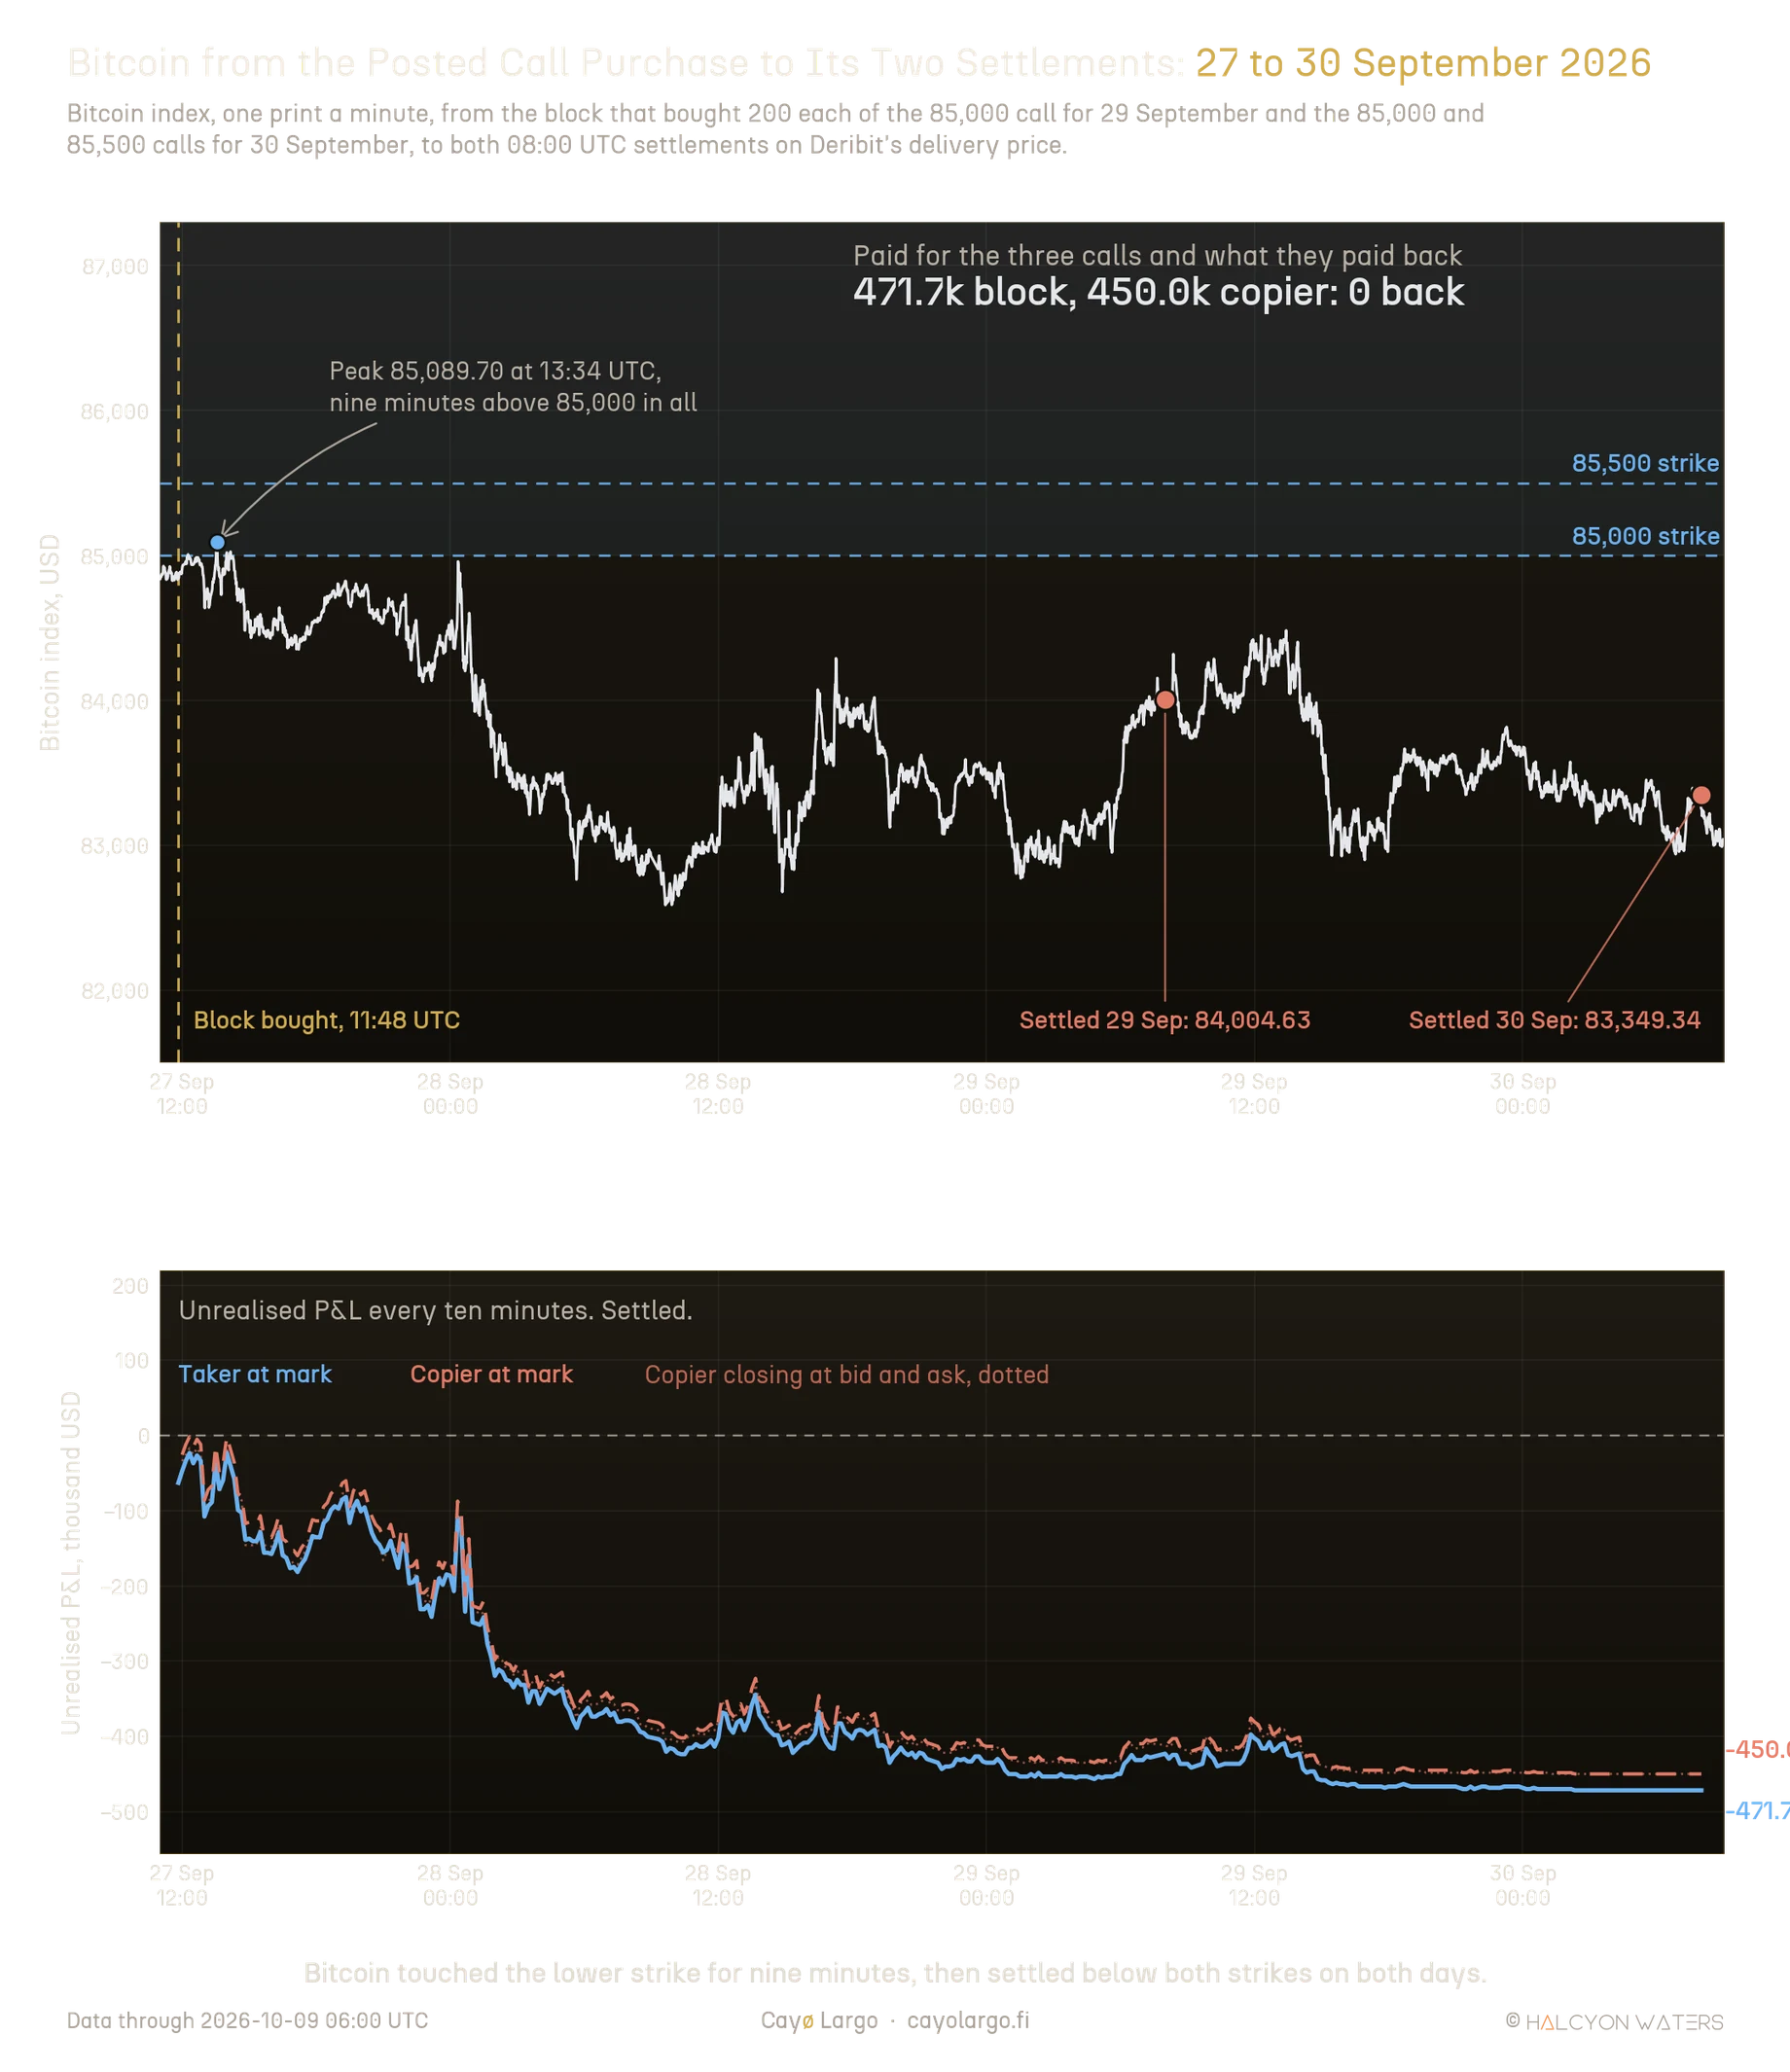
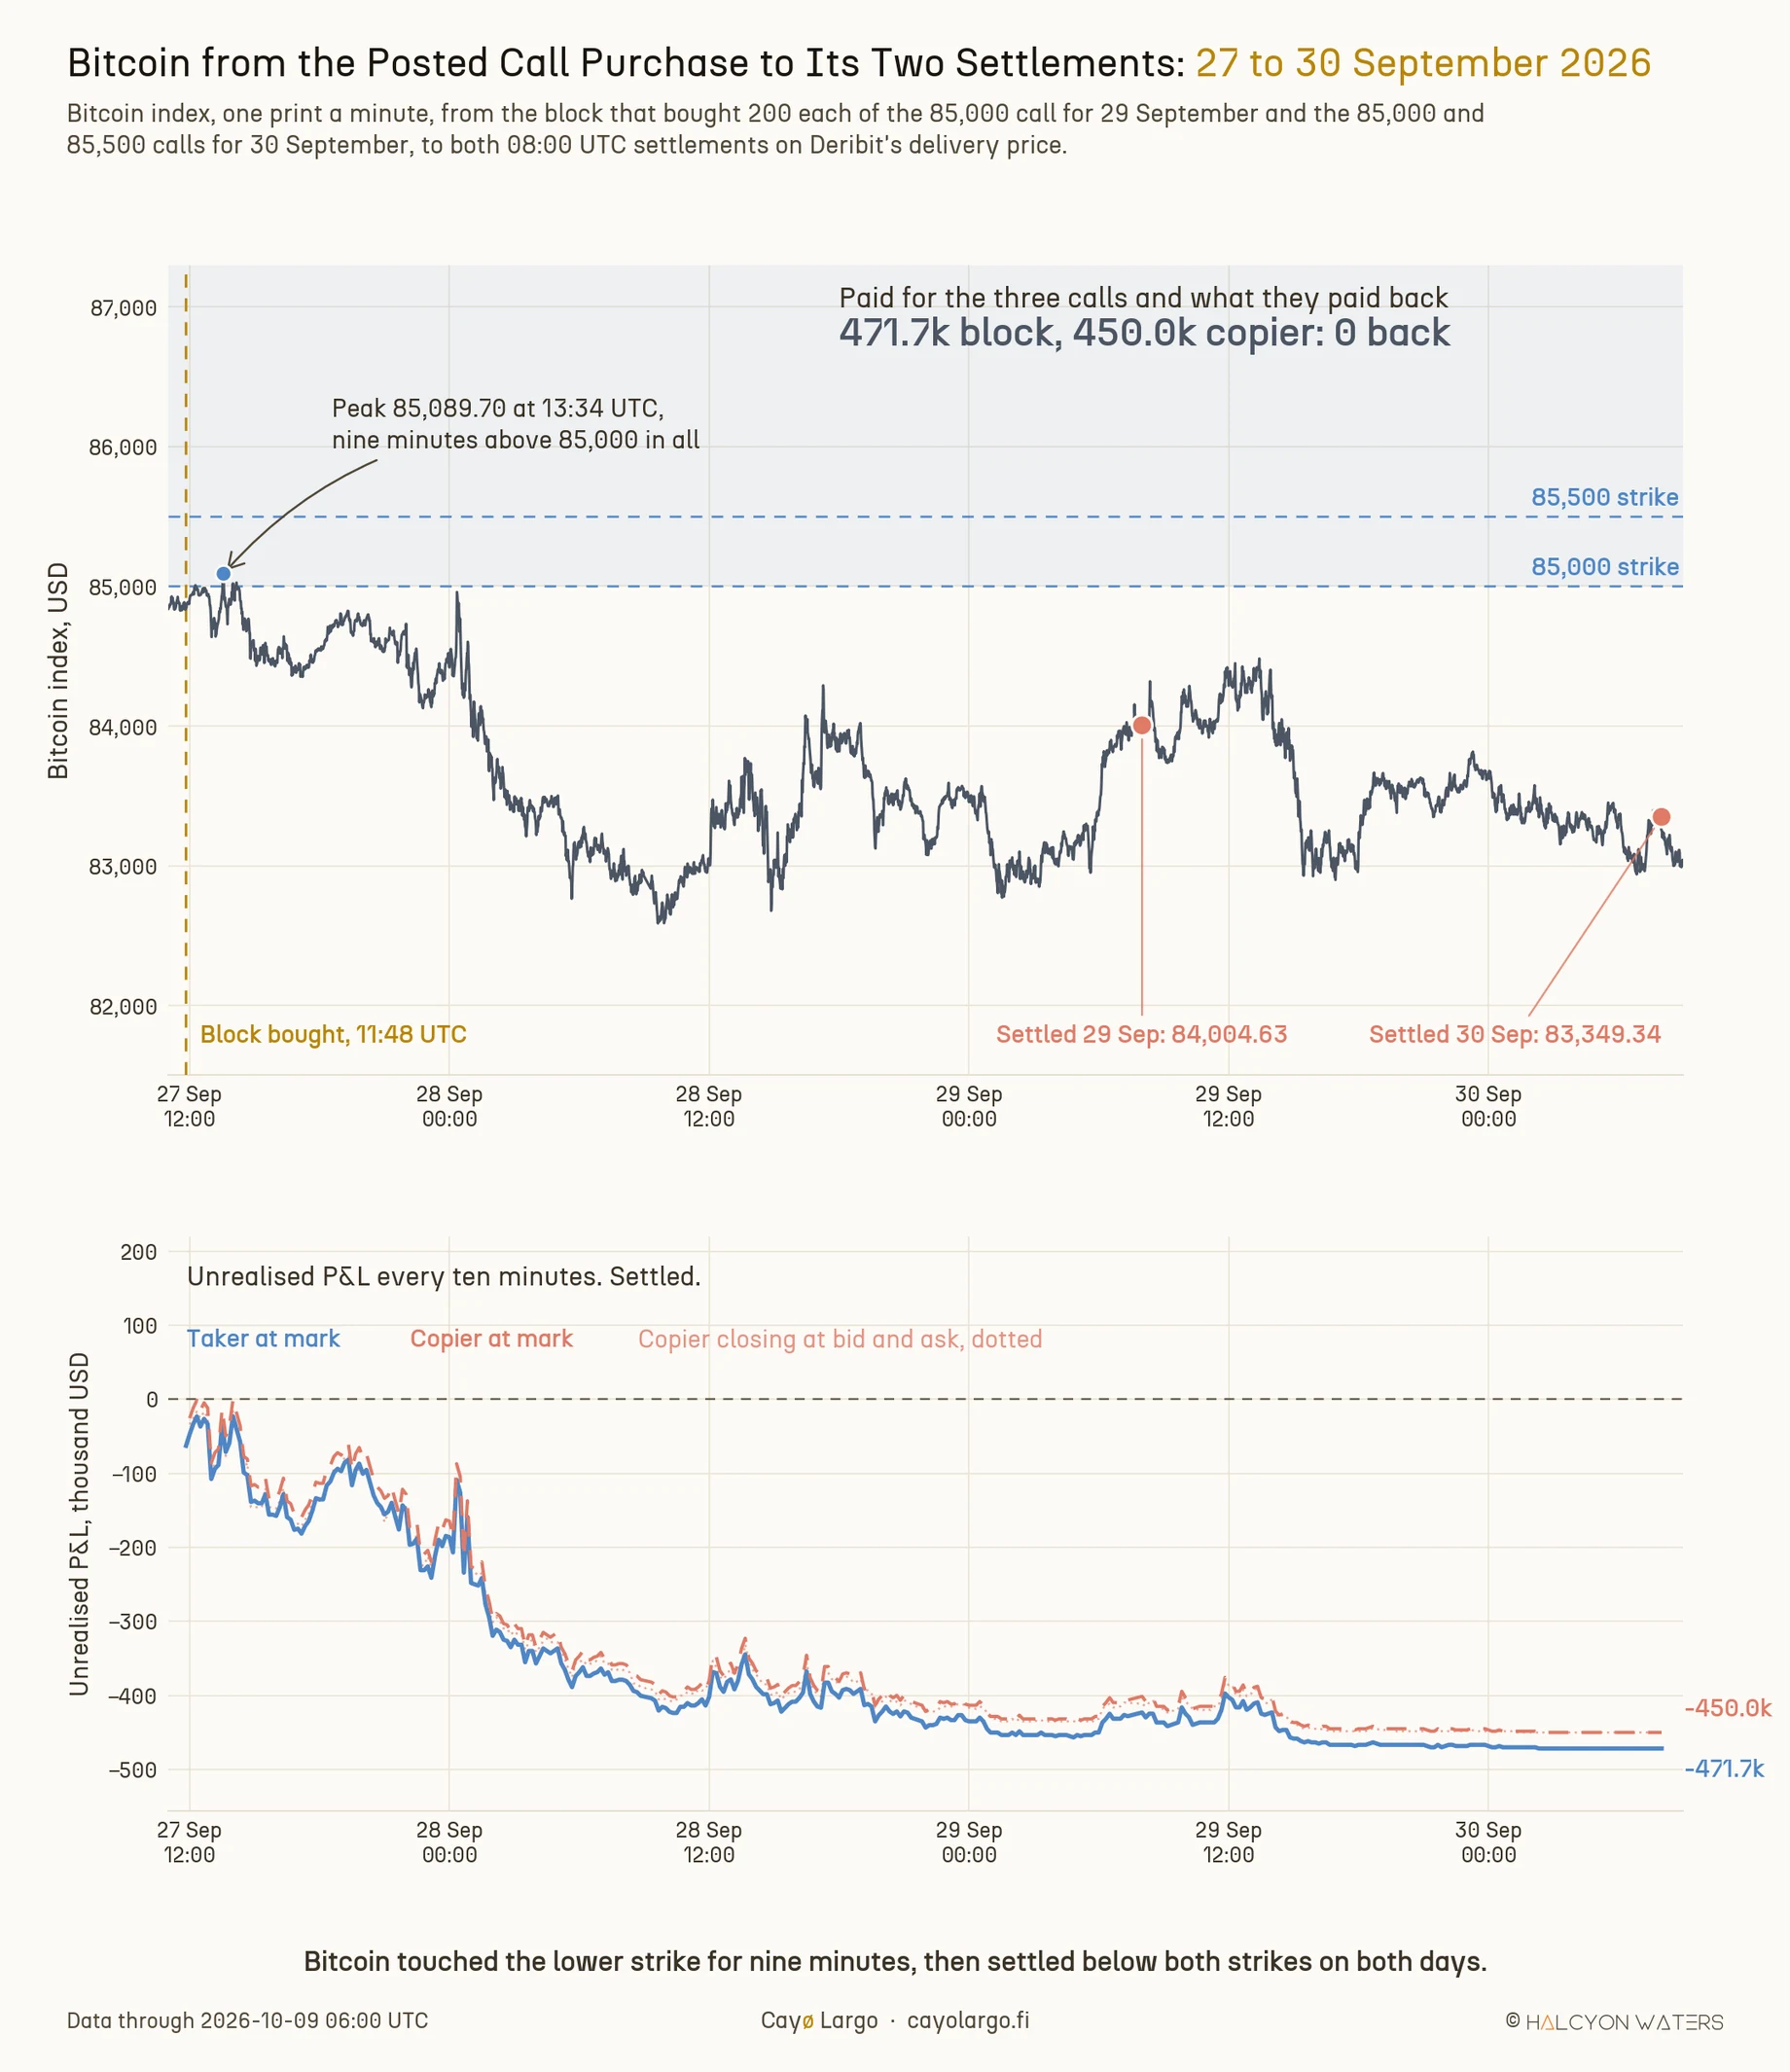
Figure 6: Top: Bitcoin from the moment the three calls were bought to both settlements. The shaded band is where the calls would have paid. Bitcoin entered it for nine minutes on the first afternoon and settled below it on both days. Bottom: unrealised P&L every ten minutes for the block's buyer and the copier, ending on the realised loss at the 30 September settlement.
3. Who is on each side of a block?
A block trade is negotiated privately and then reported to the exchange, which clears it as if it had crossed on screen. Our study of the block share of Deribit volume found that blocks carry about half of Bitcoin options notional. Every block has two sides. In Deribit's own RFQ workflow, as Cryptarbitrage describes it, the requester is the taker. It asks for a price on a structure, makers quote and the taker trades against the best quote. The direction printed on the public tape is the taker's side.
The tape agrees. Cayø Largo records every Deribit option trade with its block ID, the same tape the options trades endpoint serves. On 77.6% of 56,362 block legs the taker paid above the exchange mark to buy or accepted below it to sell, by a median of 0.73% of the option's mark. That is what paying a market maker for size looks like. In other words, the side a monitor reports is the side that asked for the trade, which is also the side we copy.
The second post we grade was picked by a different rule. We took the first post we could grade, set before we looked at its outcome: the earliest post from the account's start on 21 September with every leg settled by 8 October, a simple structure and a match on our Deribit tape. The post before it, a 21 September call spread expiring on 30 October, fails twice. It has not settled yet and it is priced in dollars at 7.8x, which places it on another venue. The first one that qualifies is a Bitcoin put spread posted on 22 September (Figure 7).
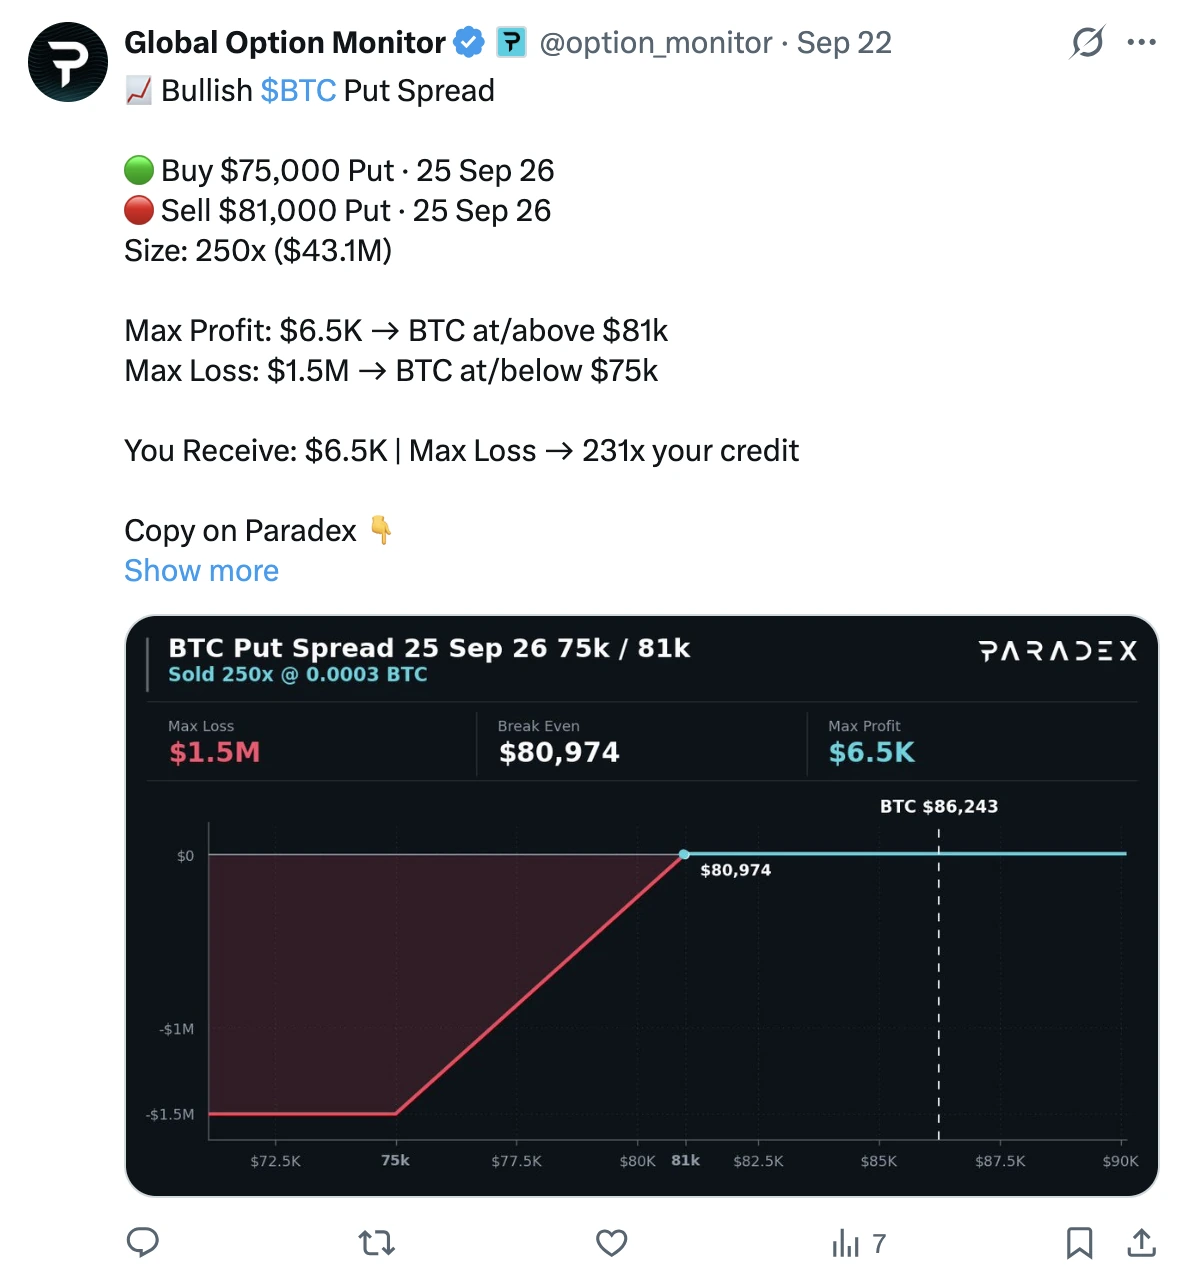
Figure 7: Global Option Monitor's post of 22 September 2026, captured by us on 9 October. Its strikes, expiry, size of 250, net price of 0.0003 BTC and Bitcoin level of 86,243 USD match block BLOCK-288492 on our Deribit tape, printed at 15:13:32 UTC. The card shows only the date. The post's ID on X records the time it went out, 15:14:49 UTC, 78 seconds after the print.
On our tape the taker sold 250 of the BTC 25 September 81,000 USD put at 0.0008 BTC and bought 250 of the 75,000 USD put at 0.0005 BTC in the same block. That is a put spread sold for a credit: a bet that Bitcoin would stay above 81,000 USD for three days, with the loss capped by the 6,000 USD gap between the strikes. With Bitcoin at 86,243 USD the net 0.0003 BTC came to $6,468. A copier acting at the 15:30 UTC snapshot sold the 81,000 put at the bid of 0.0007 and bought the 75,000 put at the ask of 0.0004, the same net 0.0003 BTC, collecting $6,471. Figure 8 draws both positions at settlement.
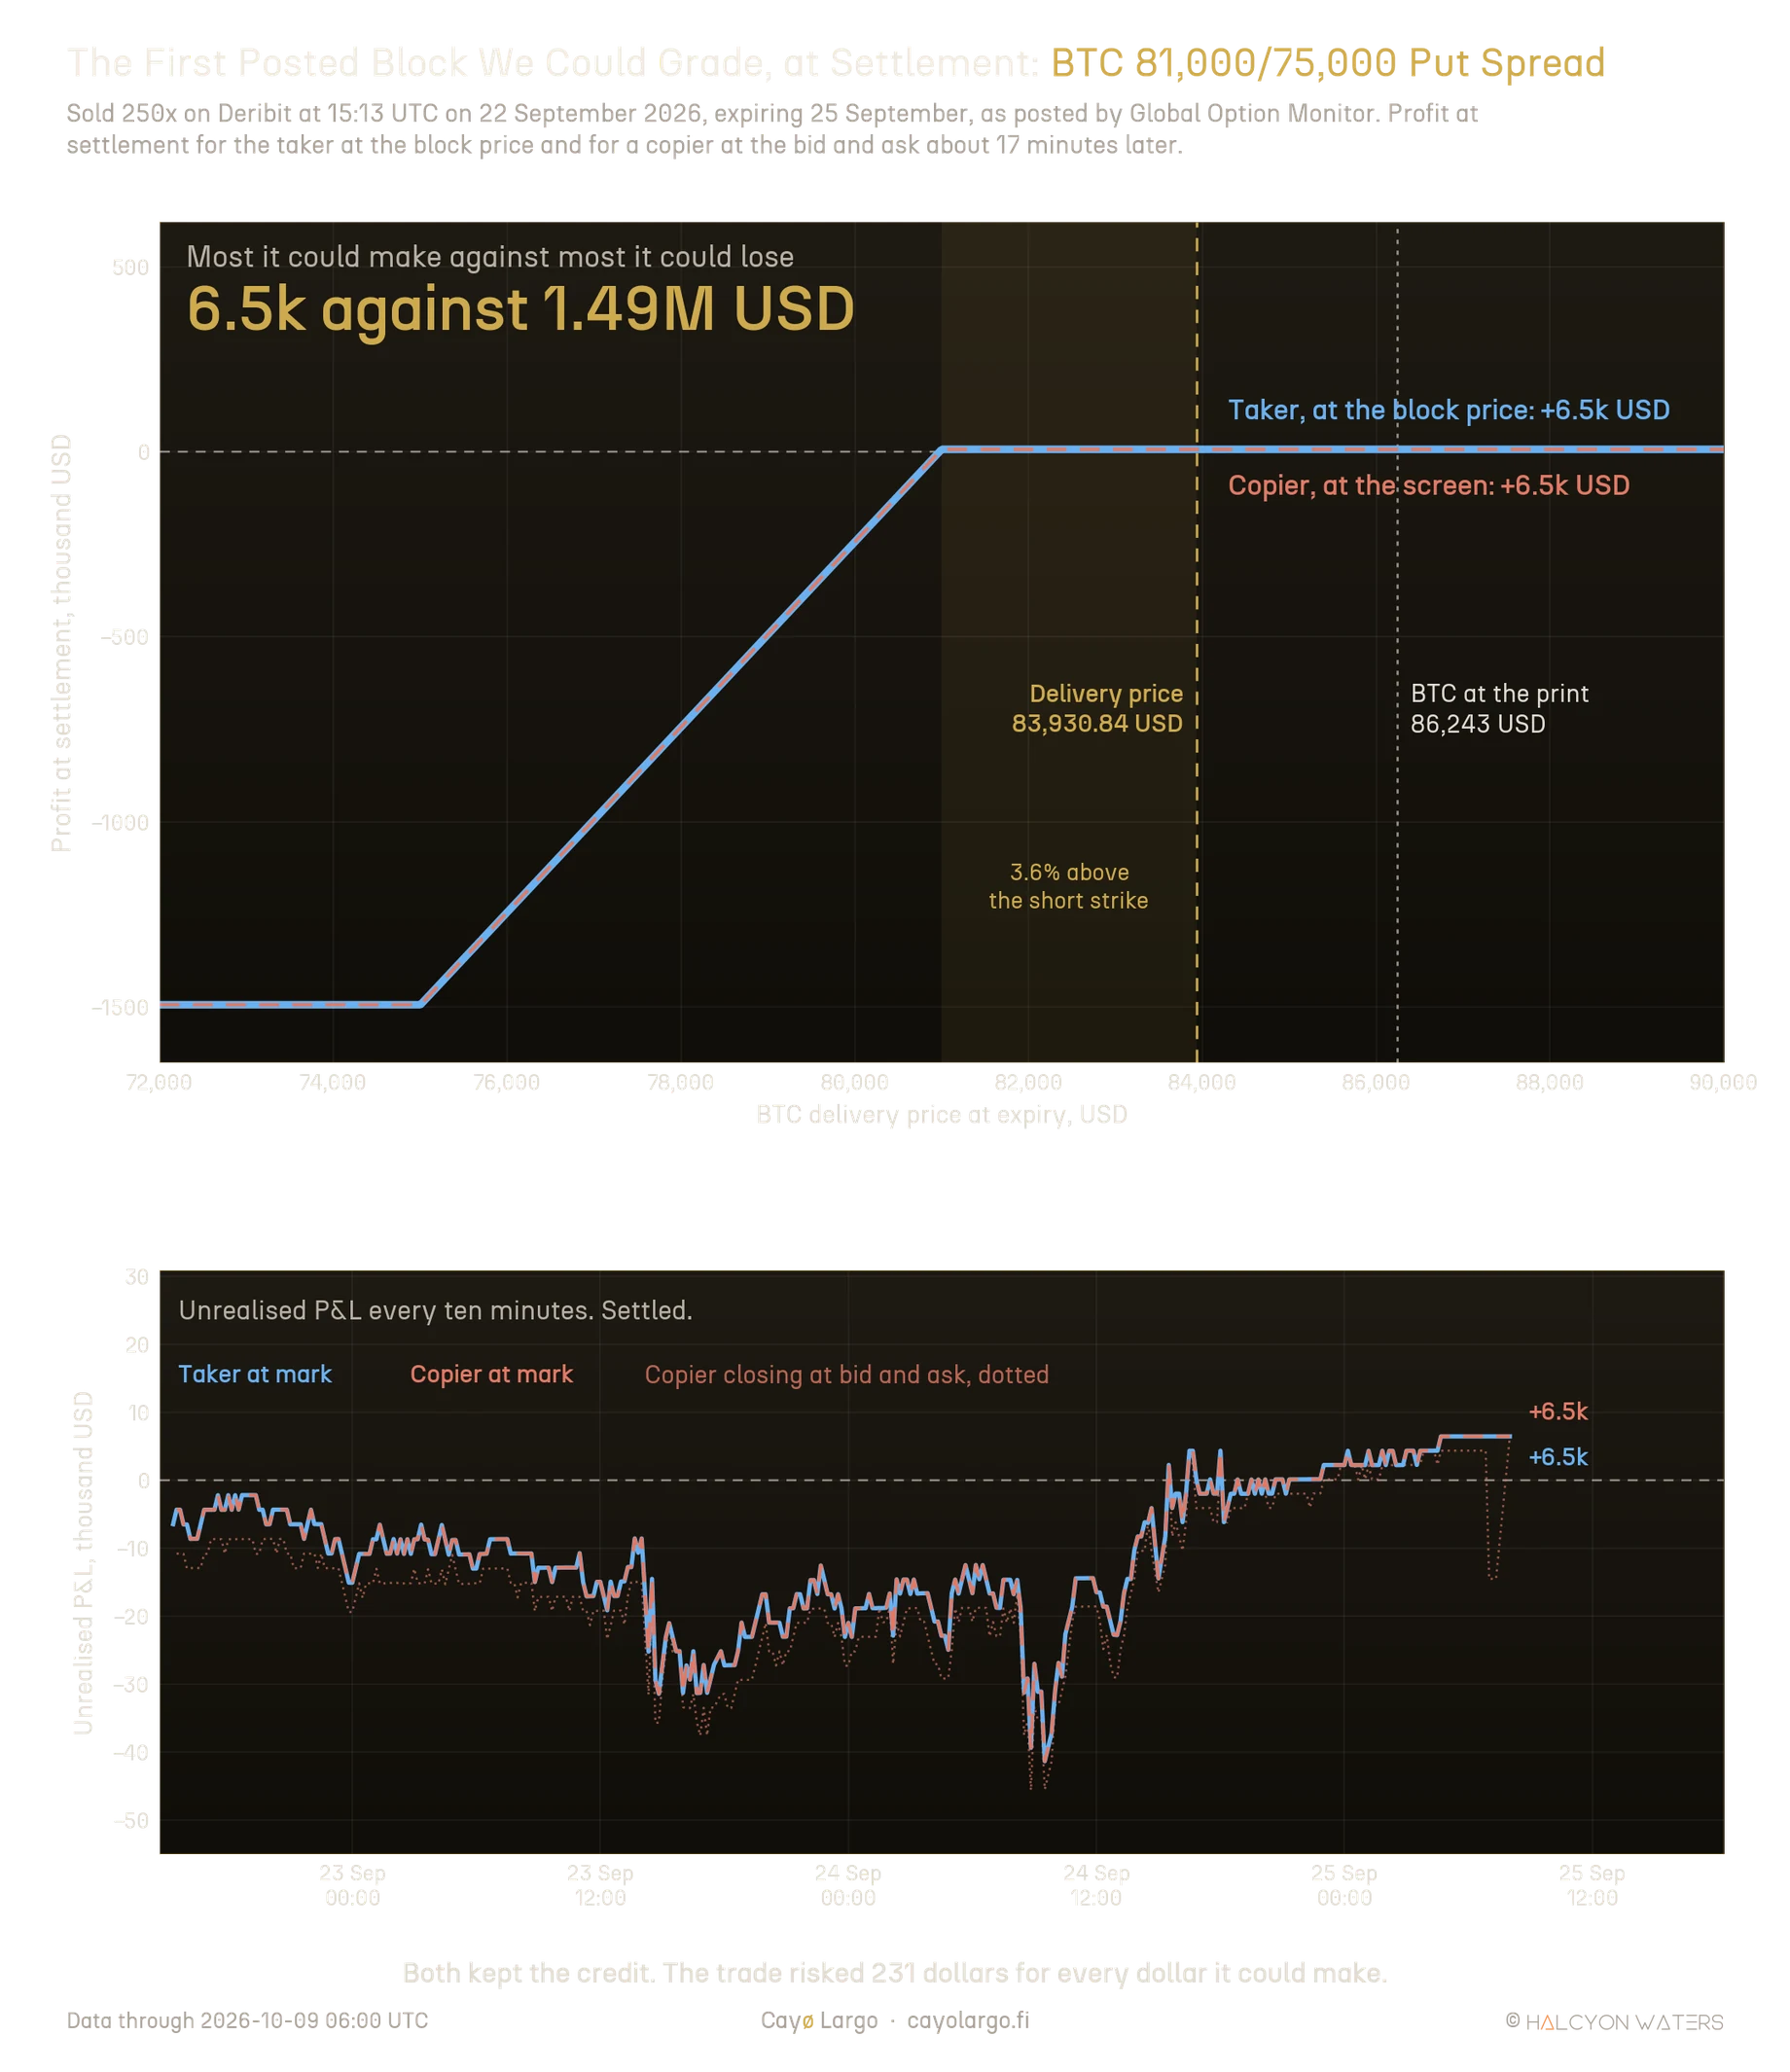
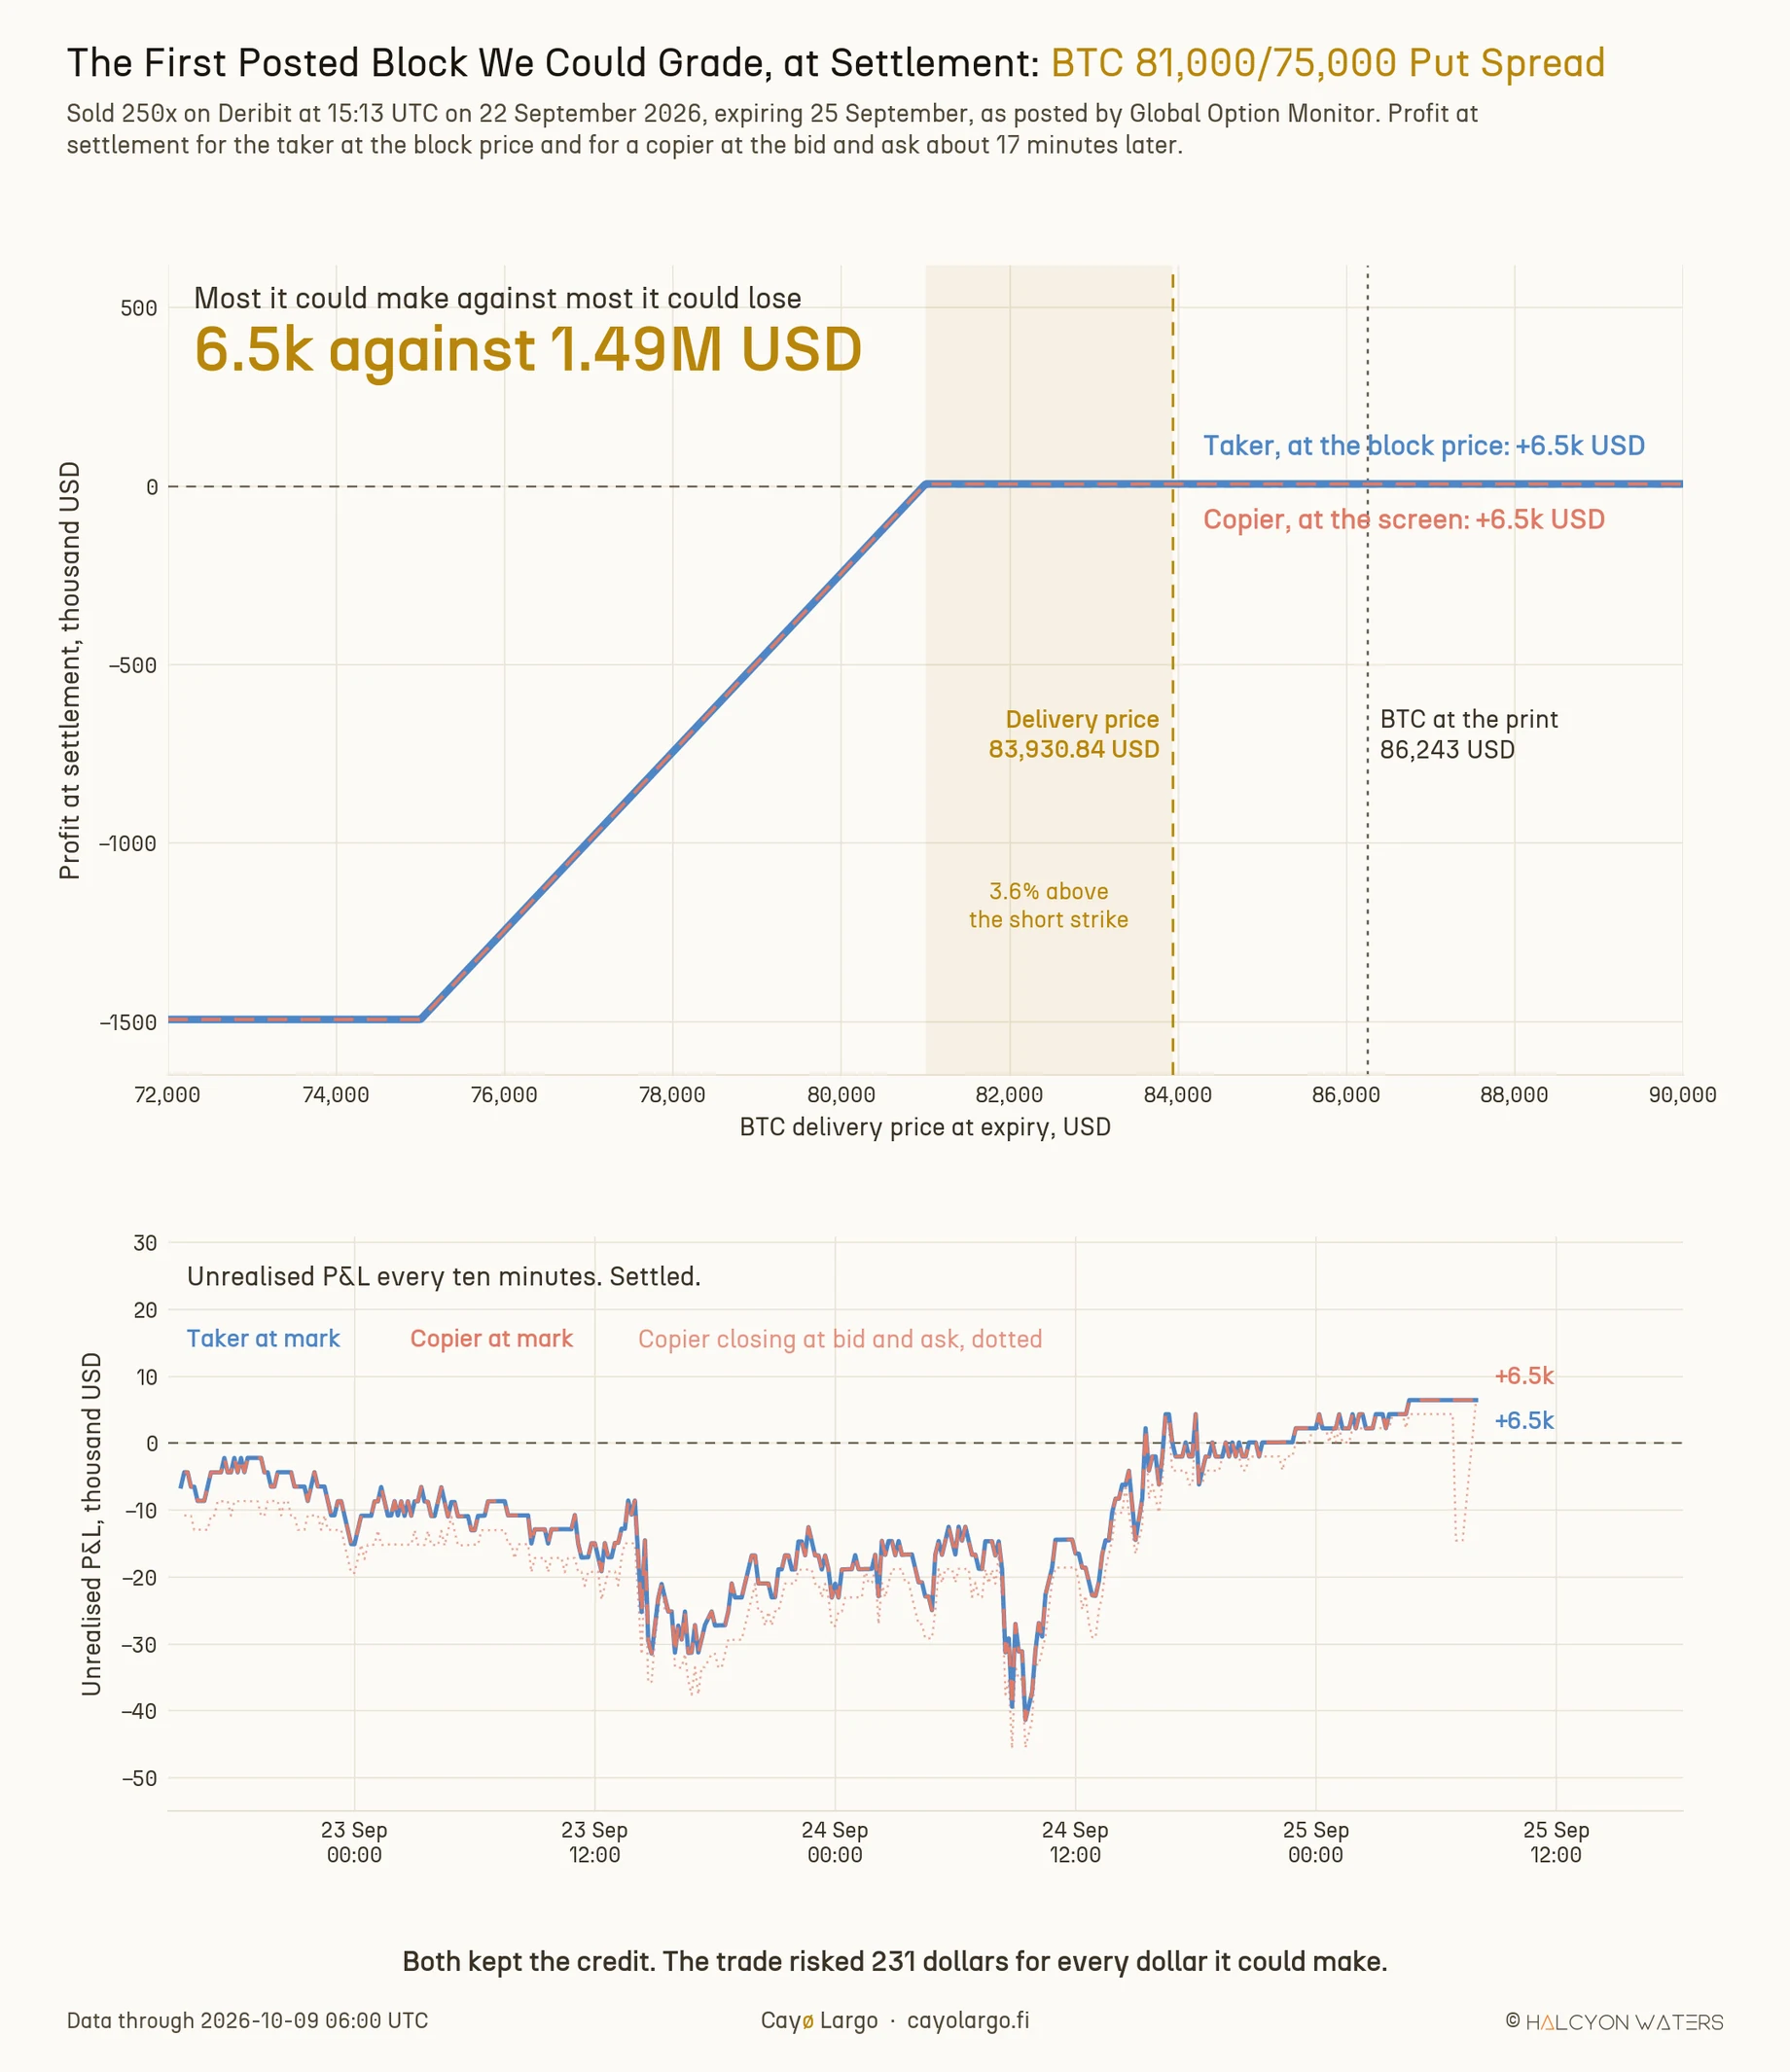
Figure 8: The posted block and its copy, held to settlement. The two lines lie on top of each other because the copier sold the 81,000 put a tick lower than the block and bought the 75,000 put a tick lower too, leaving the same net 0.0003 BTC. Bitcoin settled 3.6% above the short strike, the shaded band, so both puts expired worthless and both traders kept the credit. Bottom: unrealised P&L every ten minutes from the print to settlement, below zero for most of the three days.
Bitcoin fell 2.7% in those three days and settled at 83,930.84 USD on 25 September, 3.6% above the short strike. Both puts expired worthless. This copy did as well as the block. The reason is worth knowing: the taker had paid the maker $4,965 over mark at the print, more than the $4,314 spread the copier crossed about 17 minutes later. On average the order runs the other way, as the next section shows. It never felt like a winner. At the mark the position sat below zero on 80% of the snapshots in Figure 8's lower panel and touched $41,349 down at 09:30 UTC on 24 September, when Bitcoin dipped below 83,000 USD. Keep the card's other number in mind too: $6,468 to make against $1.49M to lose, 231 dollars at risk for every dollar of profit. In general the profit at settlement, from the taker's side, is
where is the signed amount of leg in coins (positive when the taker bought it), is for a call and for a put, is Deribit's delivery price on that leg's expiry, published through its API, is the strike, is the price paid in coin and is the index at entry. We quote in basis points (bps) of the largest leg's notional, . A 2,000 USD block and a 200 million USD block hence count alike. Figure 8 is this expression for one block, drawn across every delivery price it could have settled at. Figure 2 plots it, divided by , for every copy we made.
4. What a copier would have made?
We ran this on every settled block. Once for the taker at the block price. Once for a copier entering at the first snapshot at least ten minutes after the print, i.e. 11 to 21 minutes after it. The copier buys at the best ask, sells at the best bid and holds to expiry, all read from our ten-minute snapshots of the order book, the data behind the options market data endpoint. Of the 25,572 settled blocks 24,079 could be copied: in the rest at least one leg had no bid to sell into or no ask to buy from at the copy snapshot. Blocks that share a coin and an expiry settle on the same price and are not independent draws. Every interval and p-value in Table 3 therefore comes from resampling whole coin and expiry pairs, 481 of them.
| Who and when | Blocks (won) | Mean (median), bps | p |
|---|---|---|---|
| Block taker, at the block price | 25,572 (44.0%) | −6.5 (−9.0) | 0.35 |
| Copier at mark, 11 to 21 min later | 24,181 (44.3%) | −4.0 (−7.3) | 0.55 |
| Copier at the screen, about 1 hour | 23,933 (41.8%) | −16.4 (−21.8) | 0.01 |
| Copier at the screen, 1 day later | 20,385 (42.9%) | −14.1 (−14.6) | 0.09 |
| Copier at the screen, delta hedged | 24,079 (43.4%) | −8.8 (−14.6) | 0.22 |
| Copier at the screen, 11 to 21 min | 24,079 (41.2%) | −19.8 (−23.1) | 0.005 |
Each row counts the settled blocks that could be priced and the share that made money, followed by the mean result with the median in brackets, in basis points of notional. The p-value tests whether the mean differs from zero.
The block takers did not win. Held to settlement at their own prices they made money on 44.0% of blocks and lost 6.5 bps on average, which is indistinguishable from zero. Measured at the mark, i.e. without the edge they paid, a copier would have done much the same. At the screen the copier lost 19.8 bps on average. The 95% interval runs from -35.6 to -6.2 bps and only 41.2% of copies made money. Leaving out the 597 blocks with an out-of-line mark at any snapshot around the print moves the average to -20.5 bps. Waiting an hour did not help. Waiting a day gave -14.1 bps on fewer blocks, which looks cheaper only because 4,748 short-dated blocks expire before the later copy windows. On the 18,514 blocks copyable at all three times, the copier lost 12.1, 12.0 and 15.0 bps. Hedging the copy's delta at entry, i.e. shorting each leg's Deribit delta at the copy snapshot and holding it to that leg's expiry, removed the direction and left -8.8 bps.
Dollars tell the same story. Across $123.6bn of notional the takers lost $73.7M to their makers by settlement, $54.2M of it as the edge they paid at the print. A copier matching every block at full size would have lost $170.9M.
Where does the copier's money go? Into the spread on every leg, measured against the mark:
where is the ask for a leg bought and the bid for a leg sold, is the mark and is the index at the copy snapshot. It averaged 15.9 bps of notional with a median of 7.5 bps, almost four times the 4.3 bps the taker paid the maker. The cost grows with the number of legs a copier has to cross: 27.4 bps on vertical spreads, 3.9 bps on a single long call. Our note on what it costs to get out of a Deribit option measured the same friction on single trades.
5. Did the print know something?
A copier can still win if the print predicts the market by more than the spread. We tested that on the value of the taker's legs at the mark, around the print:
where is the mark value of the taker's legs at the snapshot just before the print and is the window. If the print carried information, the position would gain after it and not before it. Each window compares the same blocks on both sides, resampled by coin and print day, about 500 of them. We left out the 597 settled blocks where one of the five marks around the print sat more than three times away from the other four and at least 0.0005 BTC from them, an isolated reading rather than a price. With them in, the gap at 20 minutes shrinks to 0.60 bps and loses its significance.
| Window | Before the print | After the print | After minus before |
|---|---|---|---|
| 24 hours | +4.83 (52%) | +3.19 (51%) | −1.64 (p 0.58) |
| 70 minutes | +0.80 (53%) | +2.20 (57%) | +1.41 (p 0.003) |
| 20 minutes | +0.97 (54%) | +2.01 (59%) | +1.04 (p 0.002) |
Each cell gives the mean change in basis points of notional with the share of blocks that gained in brackets. Only blocks with a snapshot at both ends of a window are counted.
After the print the taker's position did gain, 2.01 bps over 20 minutes. Have a look at the other column, though. Over the 20 minutes before the print the position had already gained 0.97 bps. The difference is 1.04 bps, with a 95% interval from 0.46 to 1.63 bps (). Over 70 minutes it is 1.41 bps (). Over a day the position gained more before the print than after it and the difference is no longer significant. The print therefore carries a little information, about one basis point beyond the move already under way. It fades within the day. Blocks arrive partly after a move and add a sliver to it. The copier's spread is 15.9 bps, about sixteen times that sliver. Figure 9 draws the same comparison as a path, from a day before the print to a day after.
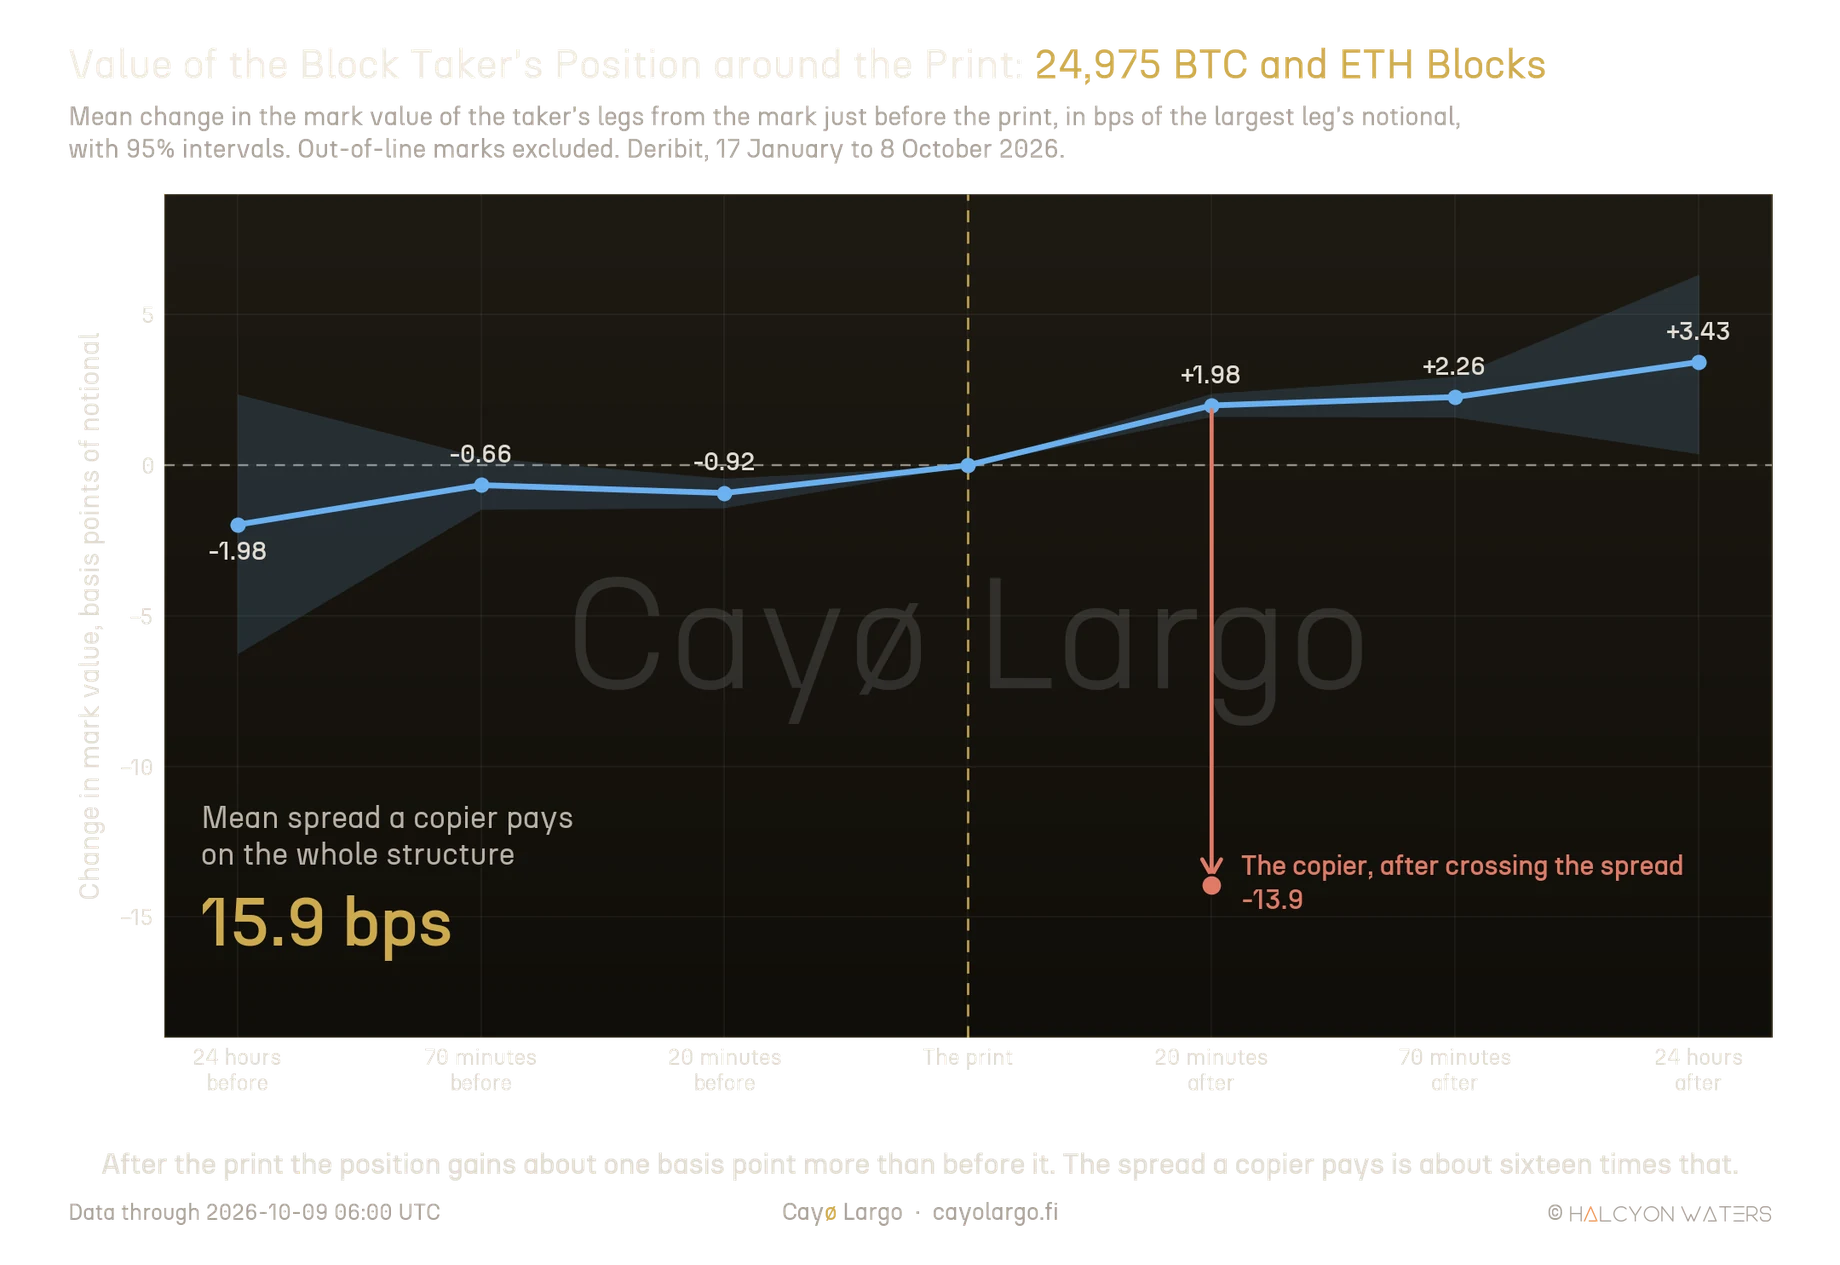
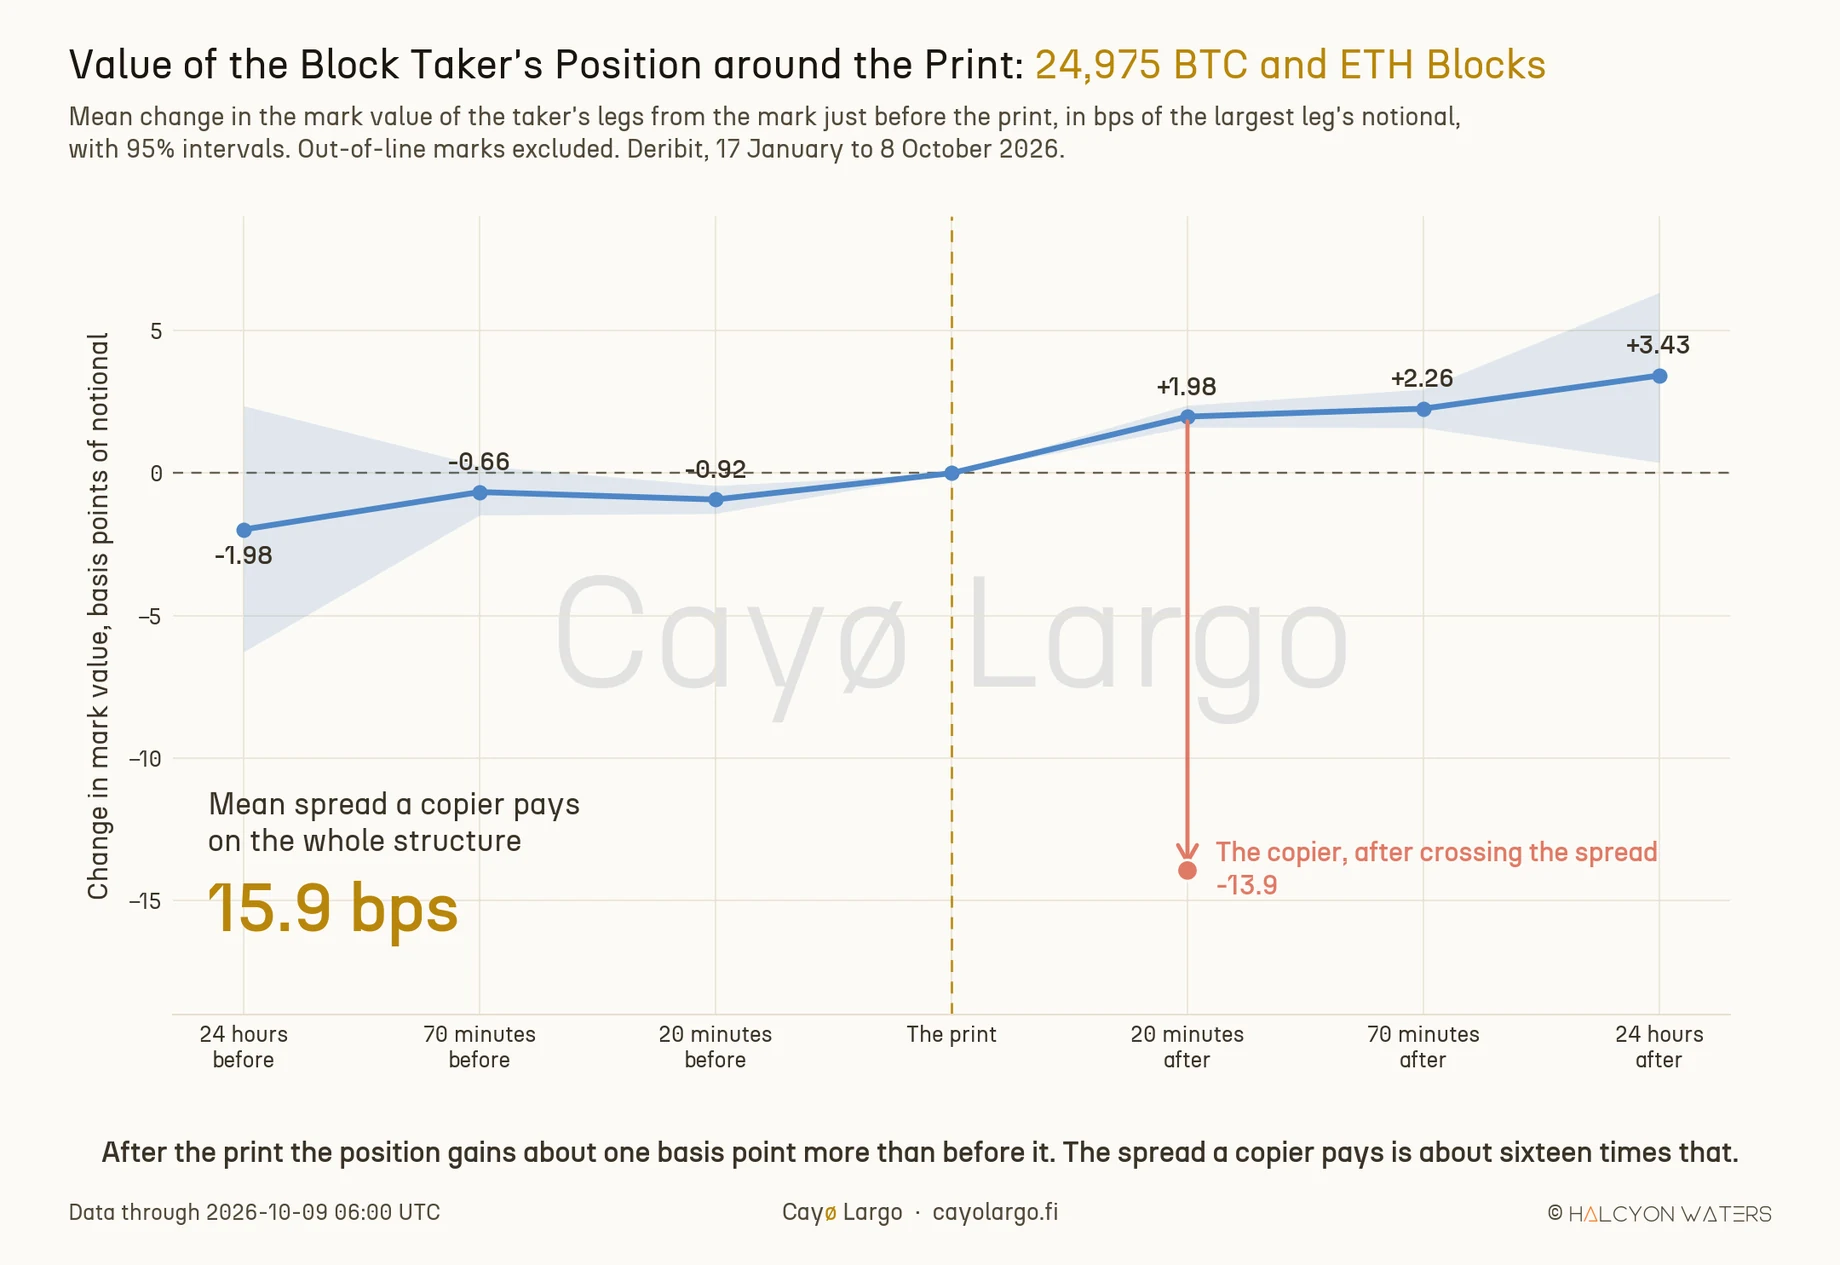
Figure 9: The taker's position from 24 hours before the print to 24 hours after it, measured against its mark just before the print. Each point averages the blocks with a snapshot at that moment, which is why it can differ slightly from the matched windows in Table 4. The line rises before the print and a little faster after it, by about one basis point in the first hour. The coral arrow is the spread a copier pays on entry, about sixteen times that extra gain.
Direction tells the same story. We took the 6,366 blocks whose net delta exceeded a quarter of their notional, i.e. a clear bet on the price, then checked where the coin settled on the first expiry. They called it right 48.6% of the time, with a 95% interval from 46.5% to 50.8% across 355 expiries. A coin does about as well.
6. Which structures are worth copying?
A win rate is not a result. The structures in Figure 10 show why. Copies of short calls made money 79% of the time. They still lost 96 bps on average, because the few losses were large. Long straddles and strangles made money 30% of the time and averaged -98 bps. A payoff chart that leads with the maximum profit shows neither number.
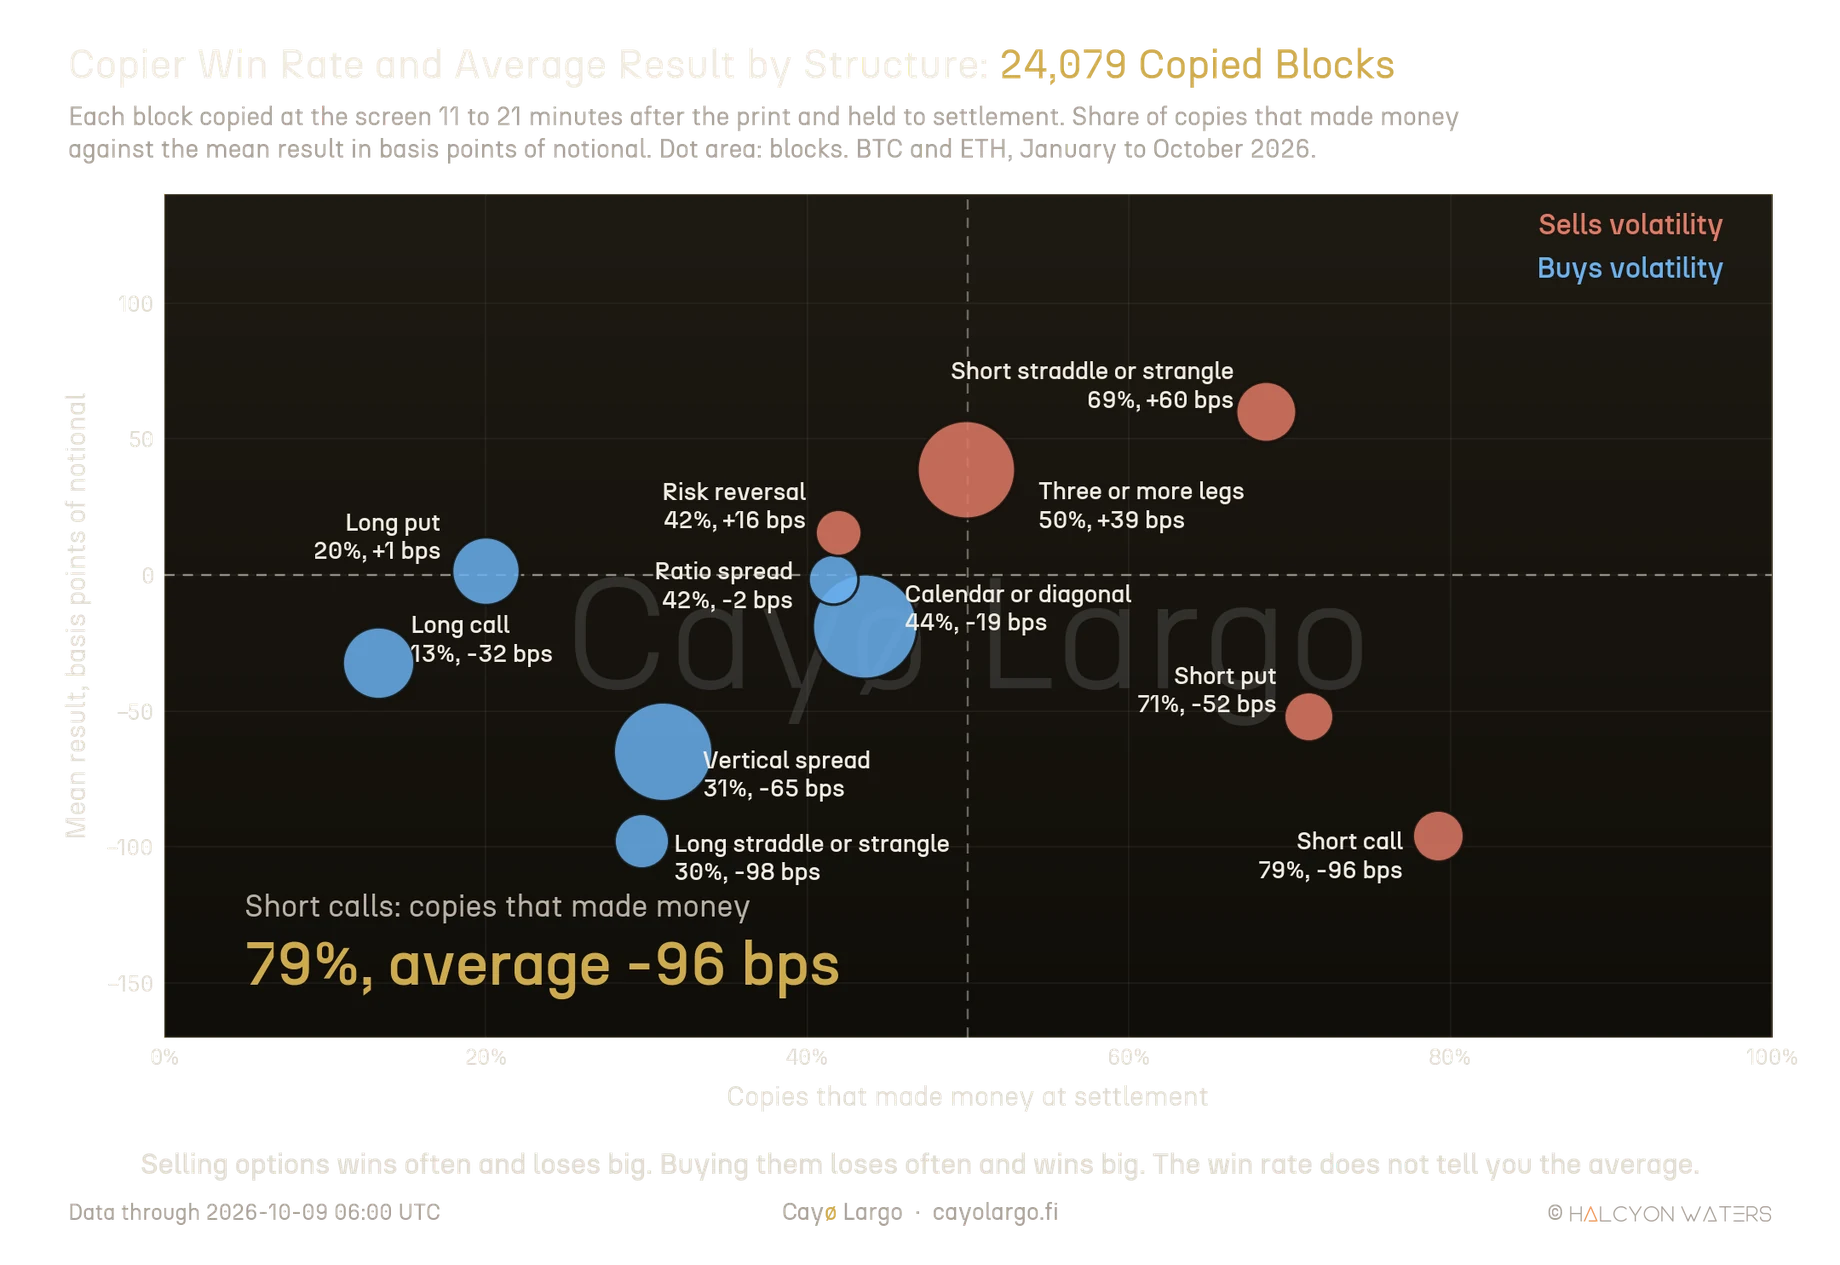
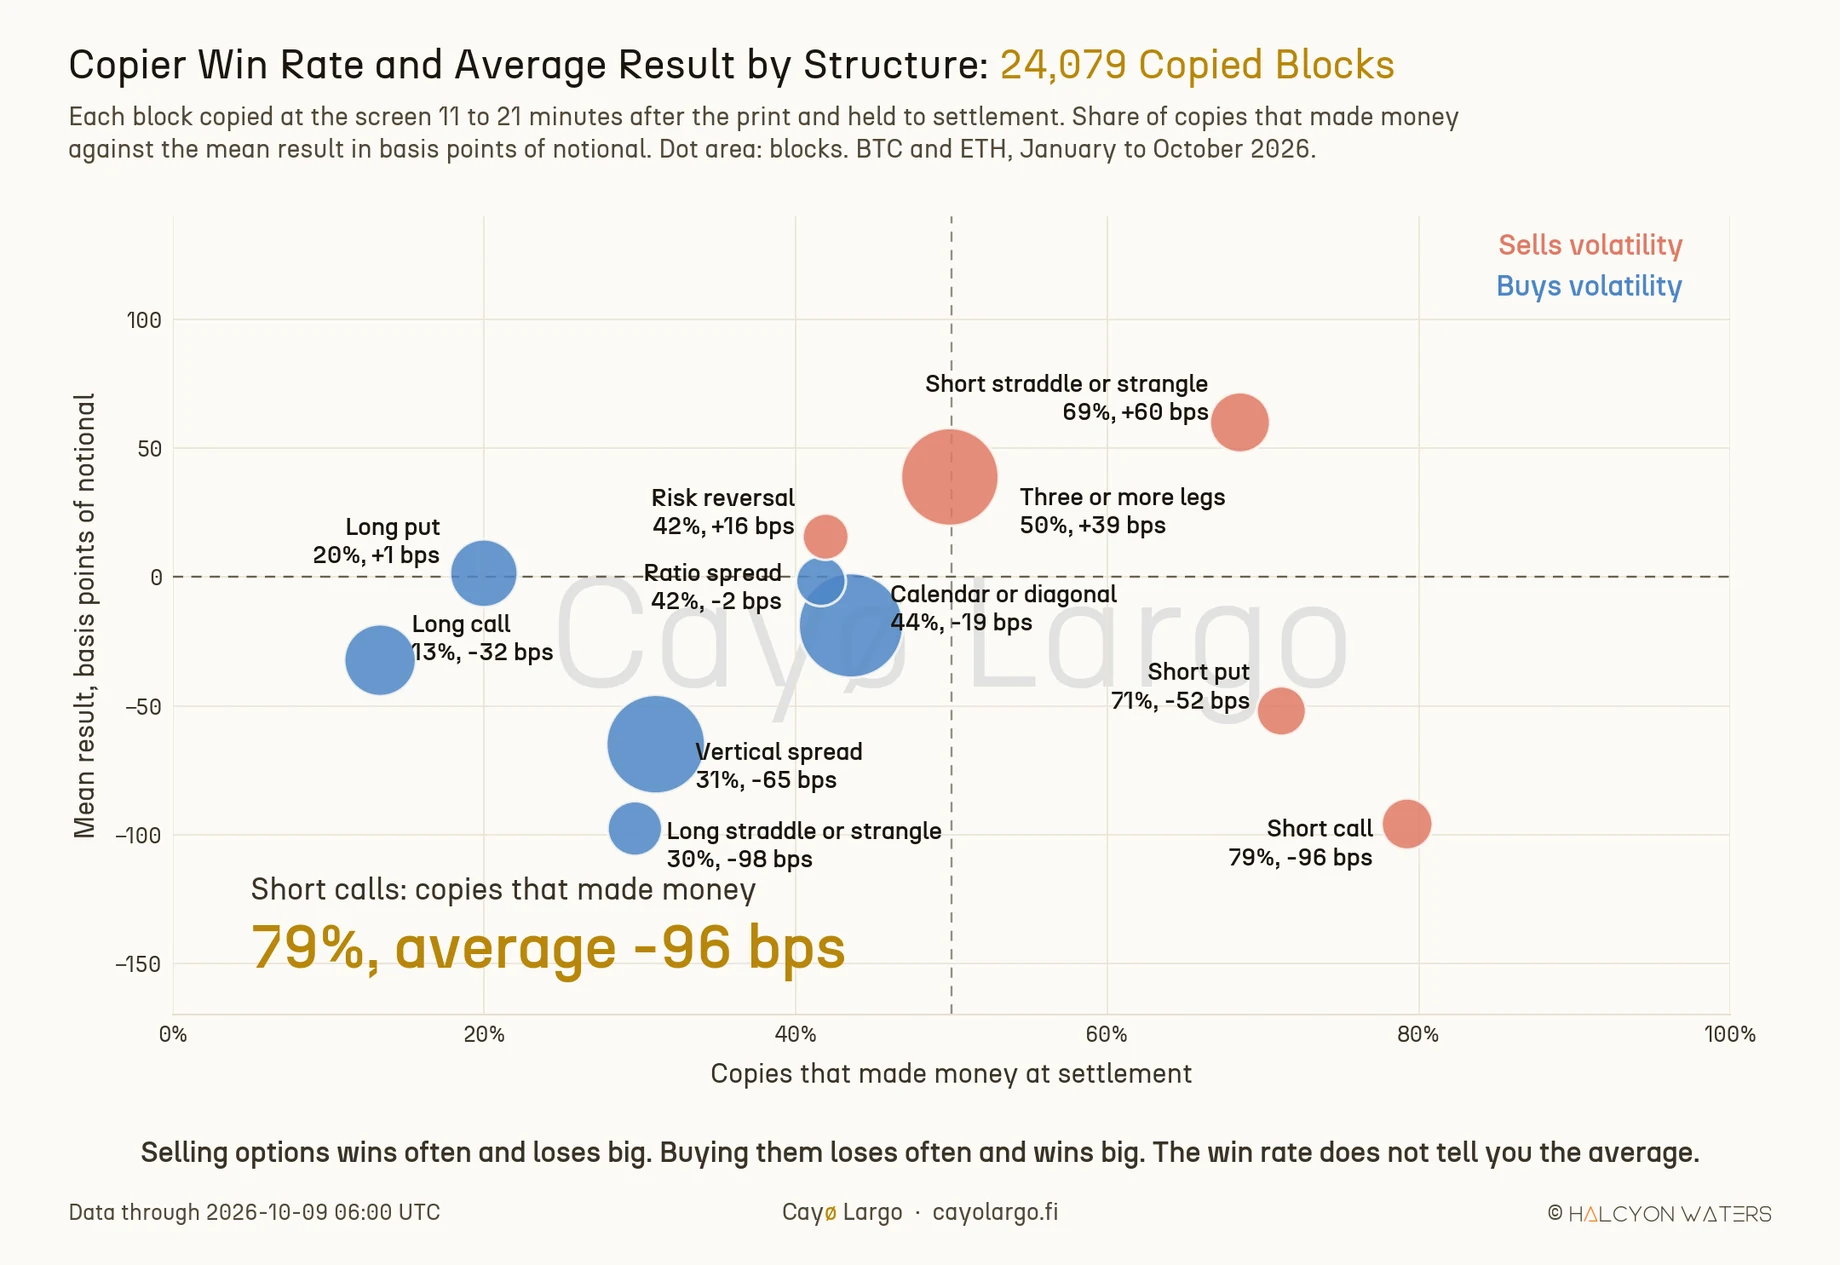
Figure 10: Every structure with at least 500 settled copies. Structures that sell volatility sit to the right, winning often. Structures that buy it sit to the left, winning rarely. The vertical axis decides the result. Only the vertical spreads differ from zero with confidence.
The left-right split is the variance risk premium, namely the tendency of options to be priced above the volatility that follows. We measured it from the seller's side in our note on when to sell crypto volatility. Blocks that sold volatility made money 65% of the time at their own prices. Blocks that bought it, 27% of the time. That split comes from the structure rather than from the print. It is also too small to pay for a copy: short-volatility copies won 62% of the time and averaged -13.3 bps. Hedged at entry they averaged +9.4 bps, inside a wide interval that includes zero. Of the structures in Figure 10 only one differs clearly from zero once copied: vertical spreads, which lost 65 bps with and are also the most expensive structure to copy.
Two more cuts deserve a line each. Ether copies did worse than Bitcoin copies, -43.7 bps against -12.6 bps, on wider spreads. The copier's mean was also negative in every calendar month we cover except the last two weeks of January, the first in our archive.
7. What we could test better?
Like any study built on a tape, this one rests on a few assumptions. Several of them deserve a sentence or two.
Our copier trades at the best bid and ask, which assumes the copy is small enough to fill at the top of the book. A copier matching a 200-lot block would walk the book and pay more. Our cost is therefore a floor. We also hold every copy to expiry. A copier who takes profit early or cuts a loss runs a different strategy, one that needs its own rules before it can be graded.
1,298 of the settled blocks printed a futures leg inside the same block, i.e. the desk's own delta hedge. We copied the option legs and offered the delta-hedged variant in its place. Close to that hedge, not the same trade. Nor do we know why any taker traded. A block can close a position, roll it or hedge a book held elsewhere, which is exactly why we graded the copier, whose intent is known, rather than the desk.
Feeds tend to post the larger prints, so we checked those on their own. On the top quarter of blocks by notional, above $5.3M, copies made money 38.7% of the time and lost 13.3 bps on average. The interval runs from -33.6 to +2.5 bps and includes zero. Above $10M the average is +1.0 bps. The loss is clear across the whole tape. For the largest prints alone nine months cannot settle it. A feed's own picks need a scorecard of their own once enough of them have settled.
Nor did we split the result by time to expiry, which deserves its own note. Finally, this is one venue, two coins and nine months. The feed that prompted the question also posts blocks from Derive, Bybit, Bullish and Paradex itself, which we did not test. Our ten-minute snapshots also set how fast the copier can be, whereas one acting within seconds would catch more of the drift after the print. The spread would still be there.
8. A closing thought
Does copying Deribit block trades pay off? On nine months of our archive, no. A copier who followed every Bitcoin and Ether block onto the screen made money on 41.2% of copies and lost 19.8 bps of notional on average.
That answer rests on 24,079 Deribit blocks, each copied at the screen bid and ask 11 to 21 minutes after the print and held to settlement. We also followed three trades the Global Option Monitor feed posted. The feed picks blocks from five venues and its own selection is something we have not tested.
Some of it did work. The desks behind the blocks came out close to even, down 6.5 bps on average, a loss we cannot tell from zero. The print does carry information, about one basis point in its first hour, gone within a day. The 22 September put spread, the first posted trade we could grade, kept its credit for the desk and the copier alike.
What cost the copier money was mostly the spread. Getting in cost 15.9 bps against the 4.3 bps the desk paid its maker. No edge in the print comes close to covering that. Direction did not help either, since blocks with a clear bet on the price called it right 48.6% of the time. Short calls made money on 79% of copies and still lost 96 bps on average. The 27 September calls, posted with unlimited upside, lost every dollar a copier put in.
This is why a copy feed can be dangerous. Its card leads with the maximum profit and the break-even, while saying nothing about the chance of reaching them or the spread a follower pays to get in. It arrives 78 to 90 seconds after the print, so the follower always trades after the desk. On 9 October a copier would have sold the posted 200 puts into a screen bid that was one contract deep on 10 of 15 snapshots. A run of six prints of one put in 83 minutes, which looks like one desk working one order, reaches the follower as six separate ideas.
Read as context rather than as a signal, though, a feed like this has real value. It shows where size is going, which strikes desks keep returning to and which structures they favour, much as the options thermography surface shows where volume sits across strikes and expiries. Following a block is like sailing in another boat's wake: same course, a little later, after the gust that sent them that way has passed. Copying the trade itself means buying the same position at a worse price.
References
J. Pan and A. M. Poteshman, "The Information in Option Volume for Stock Prices", working paper listed by OptionMetrics, around 2004. Finds that put-to-call ratios built from buyer-initiated volume opening new positions, from a dataset supplied by the Chicago Board Options Exchange, predicted stock returns of about 40 basis points a day.
Tony Stewart, "Option Flow: Week 2, 2021", Deribit Insights, 17 January 2021. Reads aggressive Bitcoin call buying and notes that open interest suggested copy cats behind one large buyer, while the buying stopping on a fall reduced the "he knows something" speculation.
Cryptarbitrage, "New Deribit Block RFQ Feature Launches", Deribit Insights, 6 March 2025. Describes Deribit's block RFQ workflow, in which the requester is the taker, makers quote and the taker trades against the best bid or ask.
Global Option Monitor by Paradex, "Bullish $BTC Custom 600x ($50.9M)", X, 27 September 2026, 11:49 UTC. The post shown in Figure 5: 200 each of the BTC 85,000 USD call for 29 September and the 85,000 and 85,500 USD calls for 30 September, bought for 0.0278 BTC a set.
Global Option Monitor by Paradex, "Bullish $BTC Put Spread", X, 22 September 2026, 15:14 UTC. The post shown in Figure 7: 250 BTC 25 September 81,000/75,000 USD put spreads sold for 0.0003 BTC, the first post by the account that has settled and matches a Deribit block.
Global Option Monitor by Paradex, "Short Vol $BTC Put 200x ($16.5M)", X, 9 October 2026, 03:44 UTC. The post shown in Figure 1: a sale of 200 BTC 30 October 88,000 USD puts at 0.0736 BTC, drawn as a payoff chart with a link to copy the trade on Paradex. The account posts block trades from Paradex, Derive, Deribit, Bybit and Bullish.
Frequently Asked Questions
Does copying crypto options block trades make money?
Not on Deribit in 2026. We copied 24,079 Bitcoin and Ether block trades at the screen price 11 to 21 minutes after each print and held them to settlement. The copies made money 41.2% of the time and lost 19.8 basis points of notional on average, with a 95% interval from -35.6 to -6.2 bps. The block takers themselves finished close to zero before the spread.
Do block trades on Deribit carry information about the market?
A little and only briefly. The taker's position gained 2.01 basis points in the 20 minutes after the print against 0.97 in the 20 minutes before it, a difference of about one basis point that is statistically significant and gone within a day. A copier crossing the screen spread pays about 16 times that. Blocks with a clear directional bet were right about the direction at expiry 48.6% of the time.
Who is the taker in a Deribit block trade?
The taker is the party that requests the quote. Makers respond with prices and the taker trades against the best one. On the public tape the reported direction of a block is the taker's side. On 77.6% of block legs the taker paid more than the exchange mark to buy or accepted less to sell, which is what a price taker looks like.
Why does a copier do worse than the original block trader?
Because the copier crosses the order book spread on every leg of the structure. Across 24,079 copied blocks that spread cost 15.9 basis points of notional on average, against 4.3 basis points the block taker paid the maker at the print. Any drift in the trade's favor after the print was a few basis points, too small to cover the difference.
Related Articles
Block Trades Are Half of Bitcoin Options Volume on Deribit
Open Deribit's order book for a Bitcoin option three months out and it looks almost empty. Every desk reading that screen draws the same conclusion: crypto options are thin, keep the size small. They are reading half the market. We sorted 2,966,546 trades by how each one was done and on Bitcoin the half that never touches the screen is 46.9% of the notional. Paradigm, which arranges most of that flow and its own venue Paradex both publish counts of it and both land on ours. Here is where the rest hides, what it costs and why it breaks the numbers you compute from the tape.
Deribit Options Execution Slippage: The Exit Costs More
We measured 469,000 Deribit option trades over six months: the buyer fills at mark, the seller gives up 1.4% to 2.9% and the quoted spread predicts neither.
When To Sell Crypto Volatility: Before Or After It Drops?
One September week brought two timing rules for crypto options: Thalex said buy volatility on Saturday mornings, others postulated to sell it only after it has dropped. On twelve months of Deribit data, Saturday buying saves very little. Selling into rising volatility lost 33.7 volatility points or more on one sale in ten; waiting for it to fall cut that to 6.1 volatility points.