Block Trades Are Half of Bitcoin Options Volume on Deribit
Open Deribit's order book for a Bitcoin option three months out and it looks almost empty. Every desk reading that screen draws the same conclusion: crypto options are thin, keep the size small. They are reading half the market. We sorted 2,966,546 trades by how each one was done and on Bitcoin the half that never touches the screen is 46.9% of the notional. Paradigm, which arranges most of that flow and its own venue Paradex both publish counts of it and both land on ours. Here is where the rest hides, what it costs and why it breaks the numbers you compute from the tape.
The order book is not lying about its own depth. It is lying about the market's depth.
Between 1 March and 21 September 2026 we read every Bitcoin, Ether and Solana option trade Deribit printed, 2,966,546 of them and sorted each one by whether it was negotiated privately or hit a resting quote. On Bitcoin, 1.67% of the trades were negotiated blocks and they carried 46.9% of the notional. Not a busy week. Every month we looked at.
The share never fell below 43.4% in any month of 2026 and never below 28.8% in any hour of the day.
In this note we will define the instrument, show it on one ordinary trading day, measure its share coin by coin and then check that share against the books of the firm that arranges most of it. After that, the question the mechanism exists to answer: does going off screen buy you a better price, or does it buy you size? The deliverable is a rule about what the visible tape can and cannot tell you.
Readers who trade blocks already can skip to The share, coin by coin.
What a block trade is and why it exists?
A block trade is an options trade negotiated privately between two counterparties and then reported to the exchange, which clears and margins it exactly as if it had crossed on screen. It never appears in the order book. It appears on the tape afterwards, done.
Deribit did not invent the idea. It was the first crypto-derivatives exchange to industrialise it. In August 2019 it launched a multi-instrument block-trading workflow with Paradigm and the announcement is unusually plain about the problem. Before it existed, institutions negotiated large trades over Telegram or Skype and then coordinated execution on the order book by hand, carrying market risk for every minute in between. The stated purpose of moving away from the book was to reduce slippage and minimise impact on the market price. Keep that claim in mind. We test it below.
Two features matter for everything that follows. A block carries a minimum size, so small trades cannot use the route at all. And it can carry many legs priced as one package, what turns it from a convenience into a necessity for anything structured.
Practitioners have long read this tape as two venues rather than one and so does the network carrying the flow. Paradigm's own account of the problem is the clearest we have found. On Deribit, an order for a multi-leg strategy, or a single leg with real size, goes to a request-for-quote rather than the book, because an RFQ takes far more size than the book shows. Their illustration is a 20 BTC order against 5.79 BTC available at the top of the order book. The distinction is old. The measured share is what has been missing.
Here is one ordinary day, every Bitcoin option trade on it:
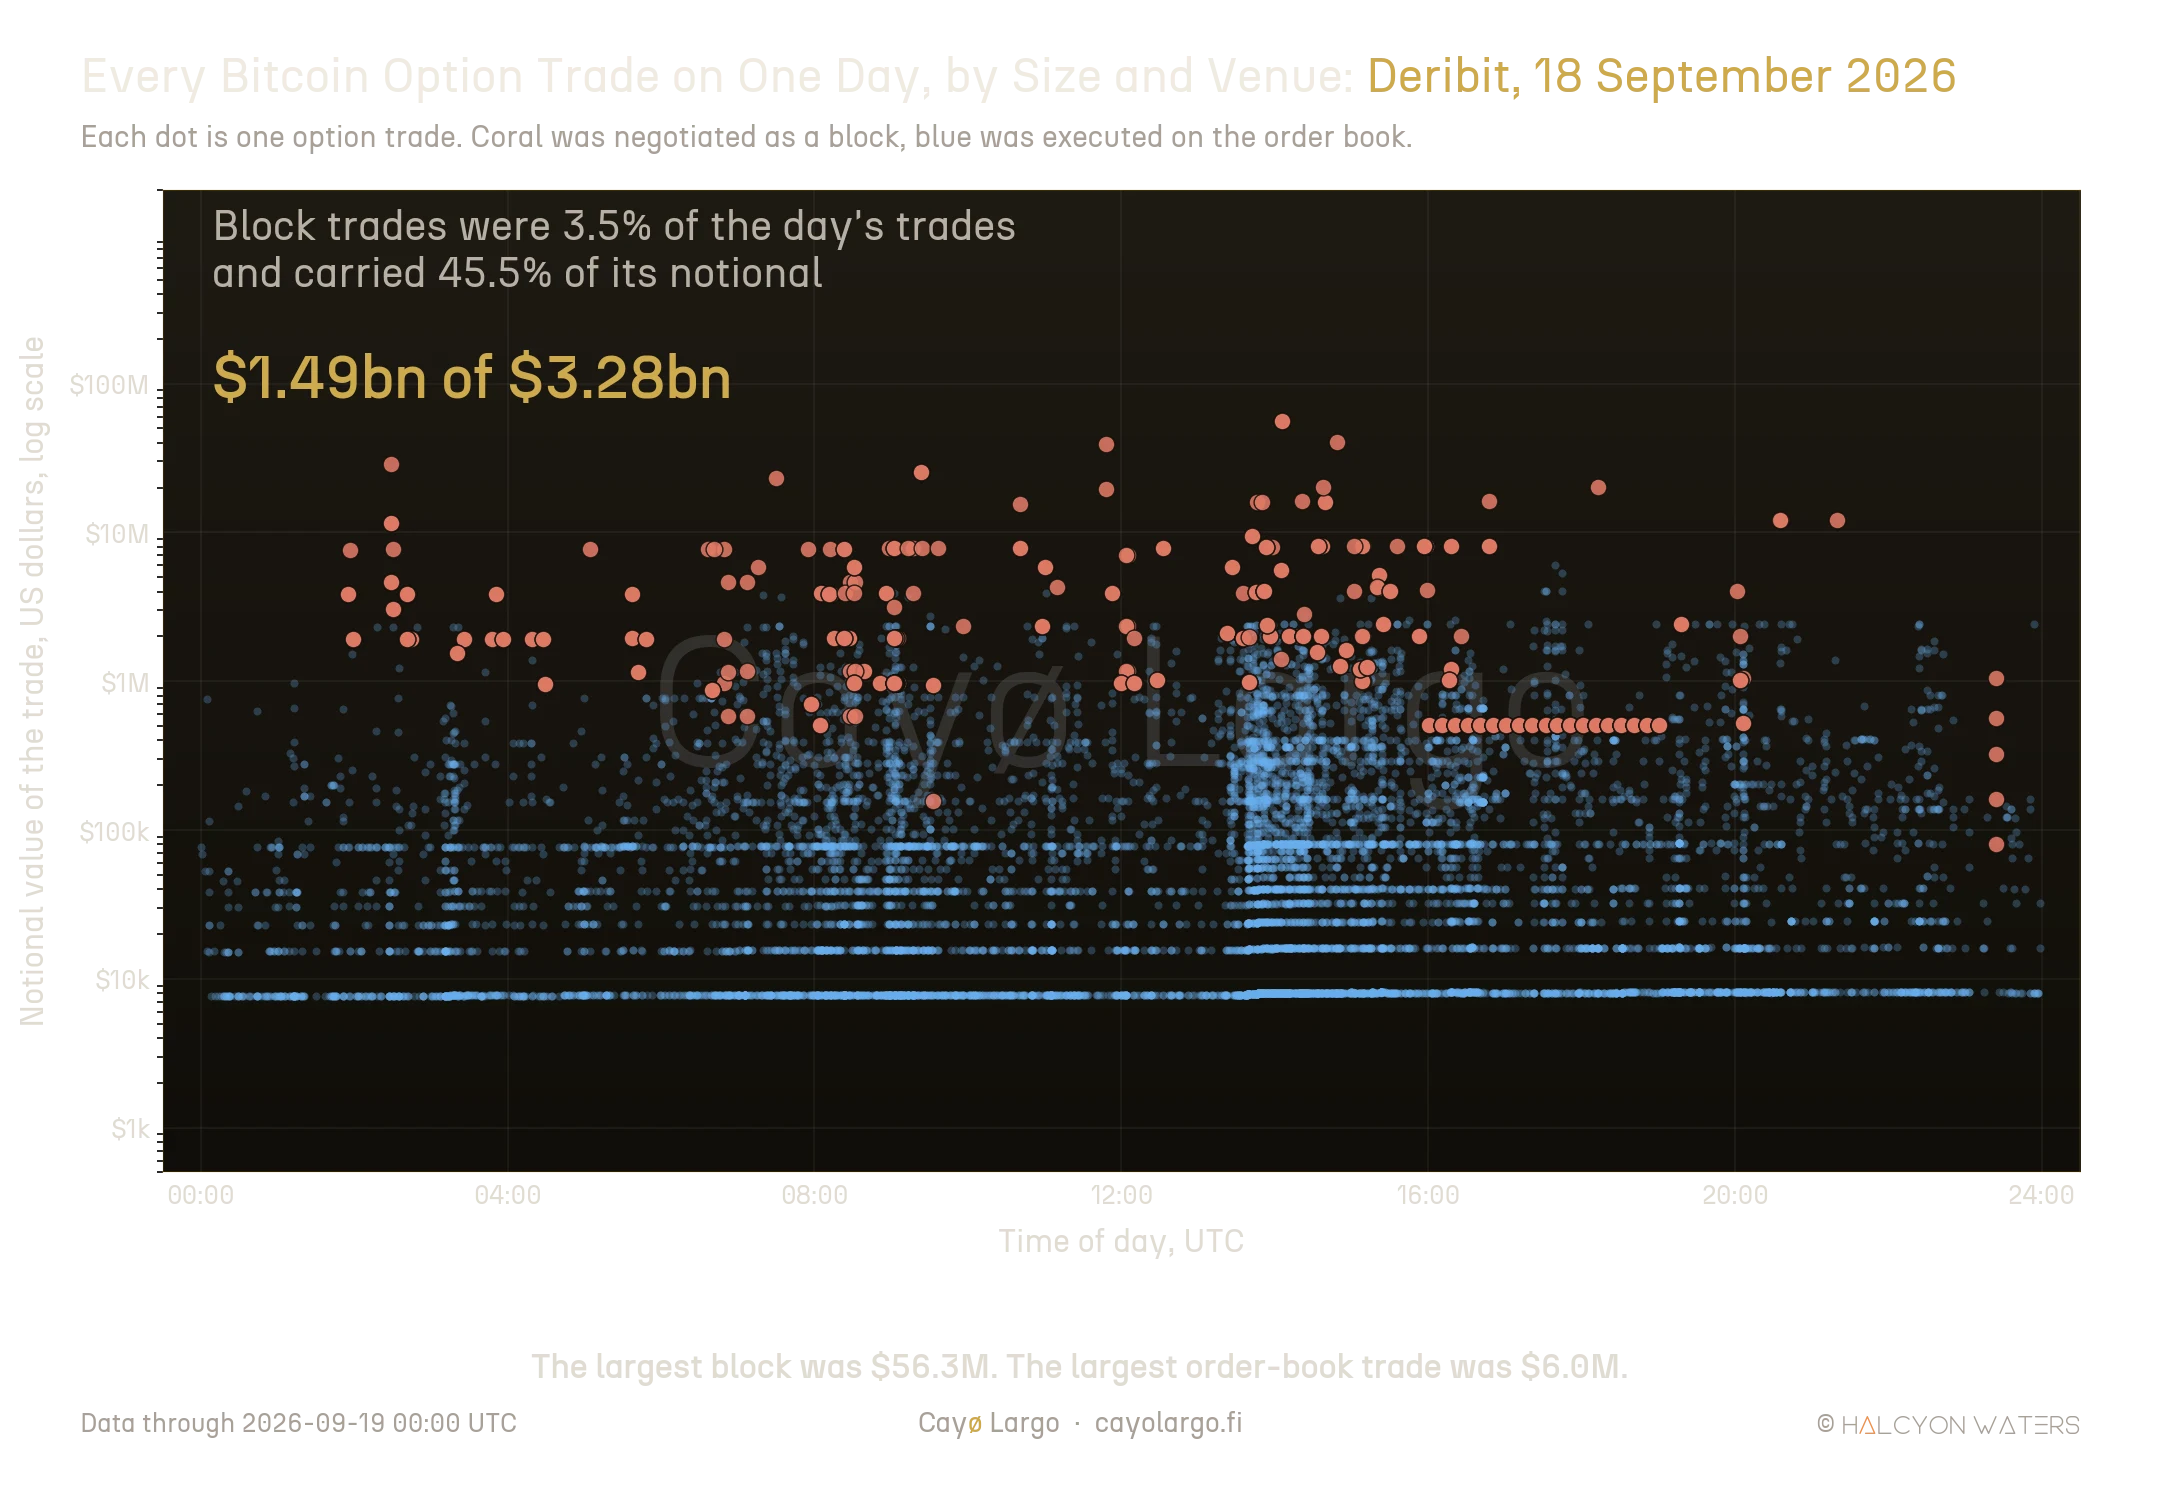
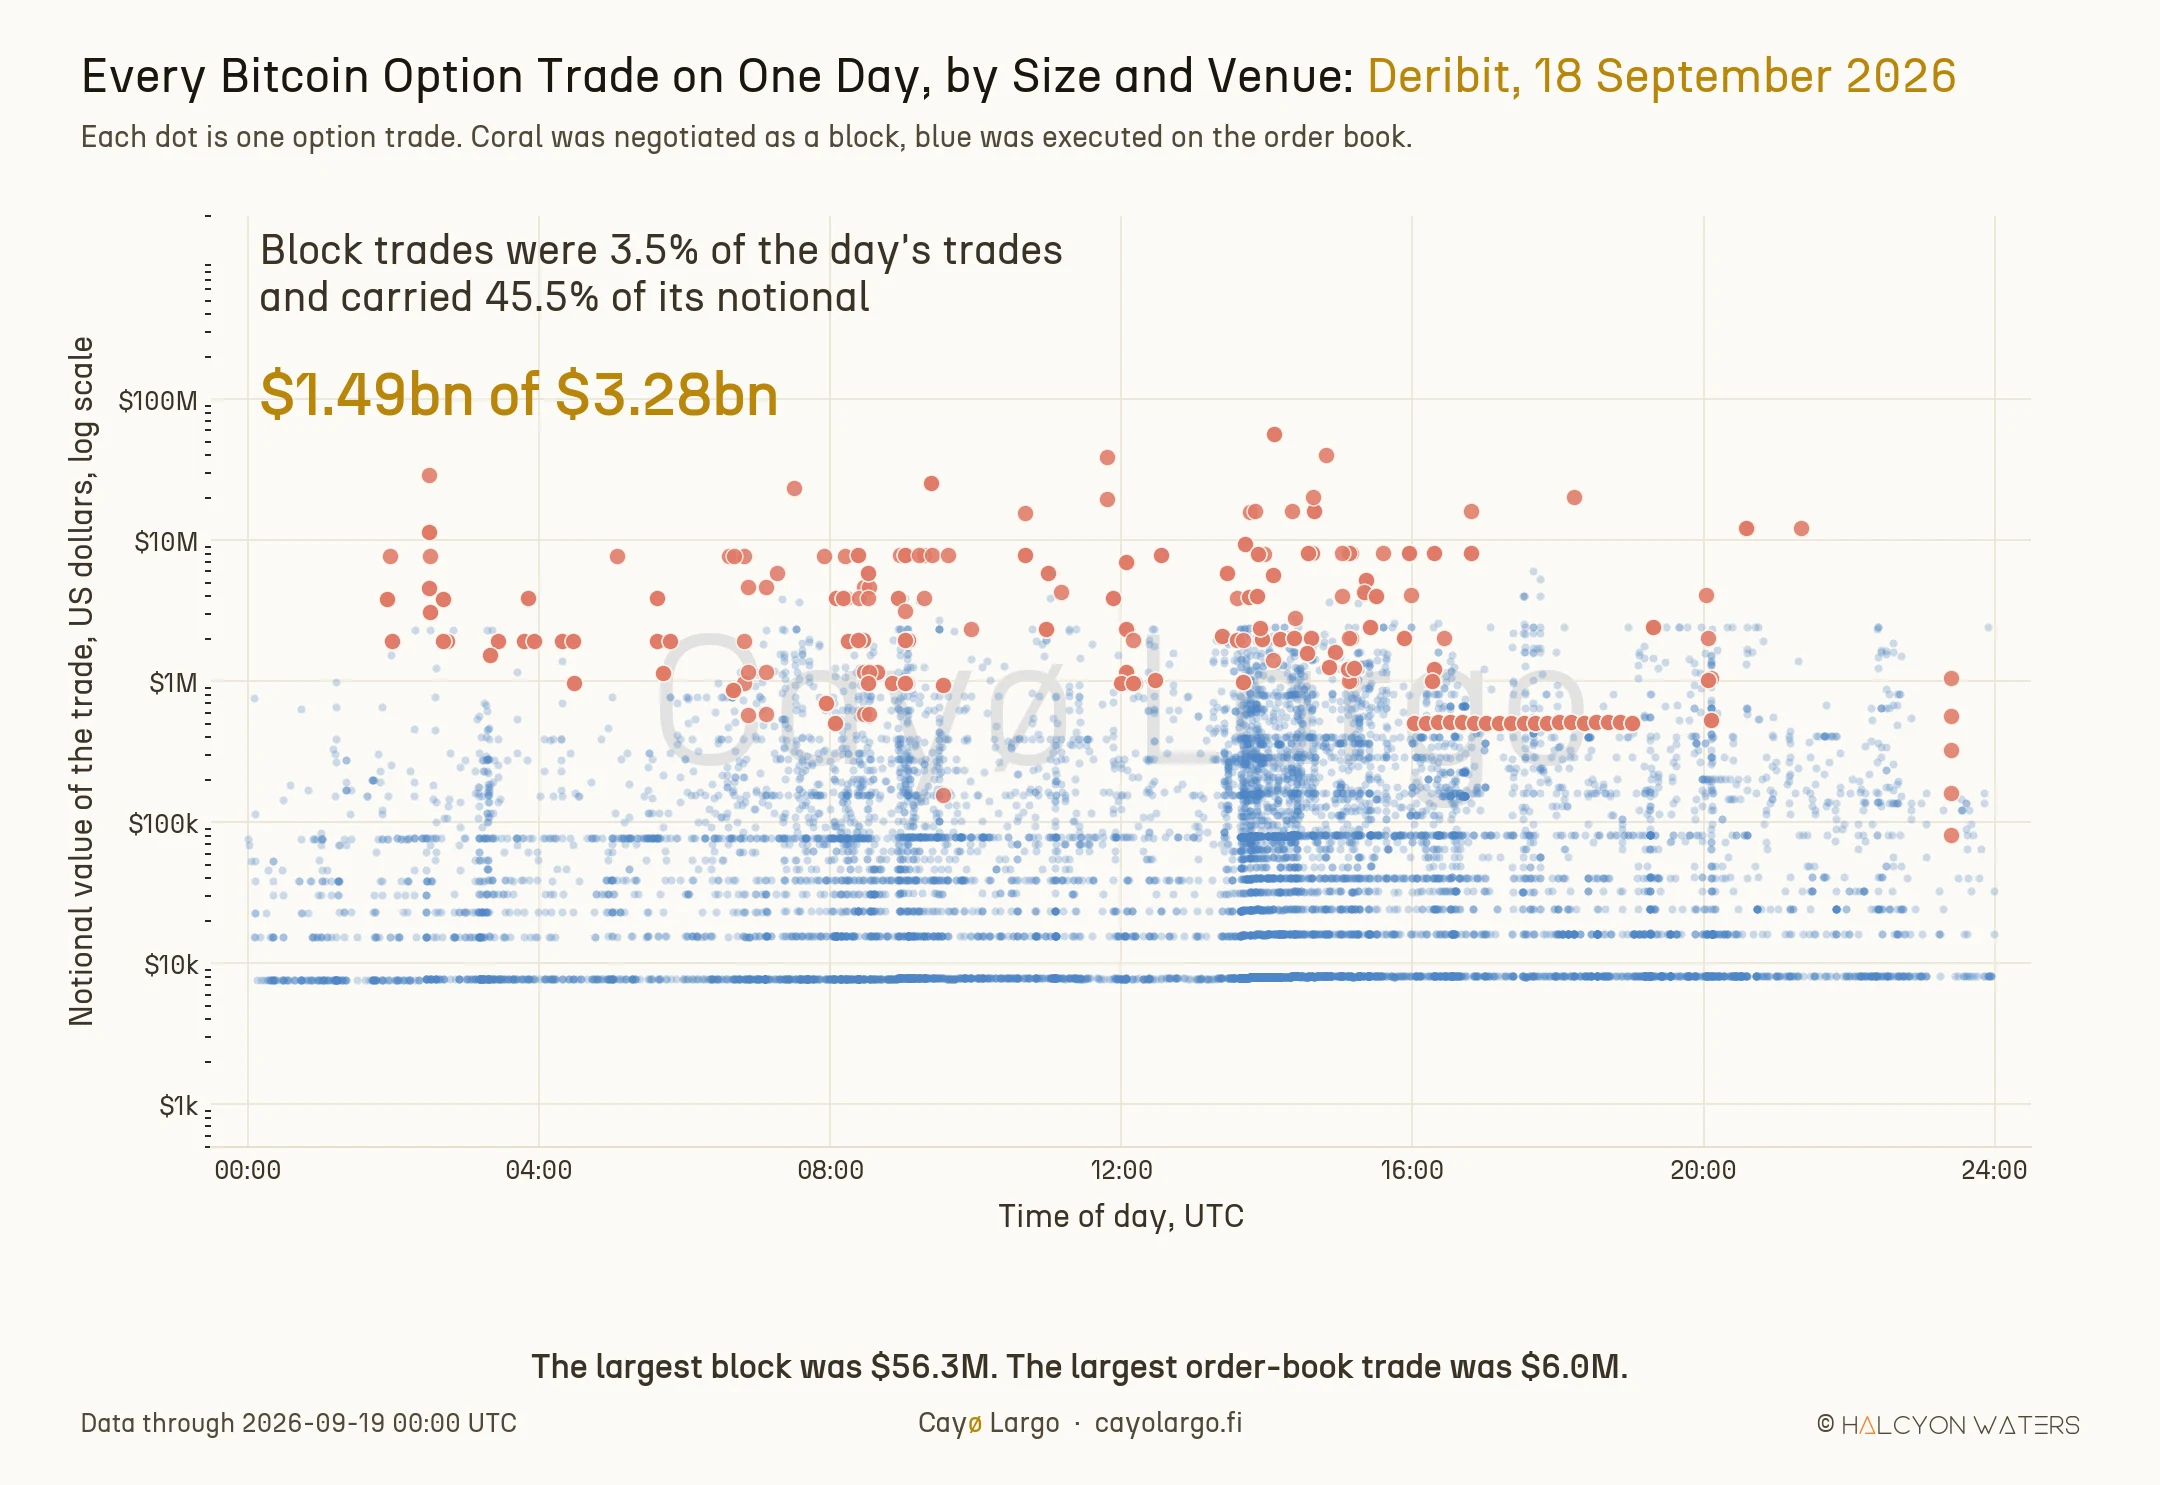
Figure 1: One ordinary trading day, not the study window: every Bitcoin option trade on 18 September 2026, placed by the hour it printed and the notional it carried. Blue is the public order book, coral is a negotiated block. The two populations barely overlap: 387 block trades out of 11,072, carrying $1.49bn of the day's $3.28bn. The largest block was $56.3M against a largest order-book trade of $6.0M.
The horizontal bands of blue are the order book's natural clip sizes. The coral dots live one to three orders of magnitude above them. These are not two ends of one distribution. They are two markets.
The share, coin by coin
We define the block share of notional as
where is the set of trades carrying a block identifier, is the notional of trade , its size in contracts, the index price at the moment it printed and the contract multiplier for that coin. Because enters both sums identically, is also computable straight from contract counts and we report both as a cross-check.
| Coin | Trades | Blocks | Blocks, % of trades |
Notional | Blocks, % of notional |
Same, by contracts |
|---|---|---|---|---|---|---|
| BTC | 1,985,960 | 33,167 | 1.67% | $370.86bn | 46.9% | 46.6% |
| ETH | 867,259 | 10,404 | 1.20% | $56.09bn | 22.0% | 21.6% |
| SOL | 113,327 | 341 | 0.30% | $13.68bn | 29.4% | 28.8% |
The dollar measure and the contract measure agree to within 0.6 percentage points on every coin, what rules out the contract multiplier as an explanation. Solana is the sharpest line in the table. 341 trades out of 113,327, three in every thousand, carried 29.4% of the coin's option notional.
Have a look at what that means for anyone watching the Solana screen. Nine hundred and ninety-seven trades in every thousand are the visible market and they account for seven dollars in ten. The three that are not visible account for the other three.
The coin ordering is the first thing worth arguing with, because it runs against intuition. The deepest book, Bitcoin, has the largest off-screen share. The thinner books do less of their business away from the screen, not more. Depth is not what sends a trade to the block route. Size relative to what the book can absorb is and Bitcoin is where the large size actually is.
Now have a look at the same split through time and through the trading day.
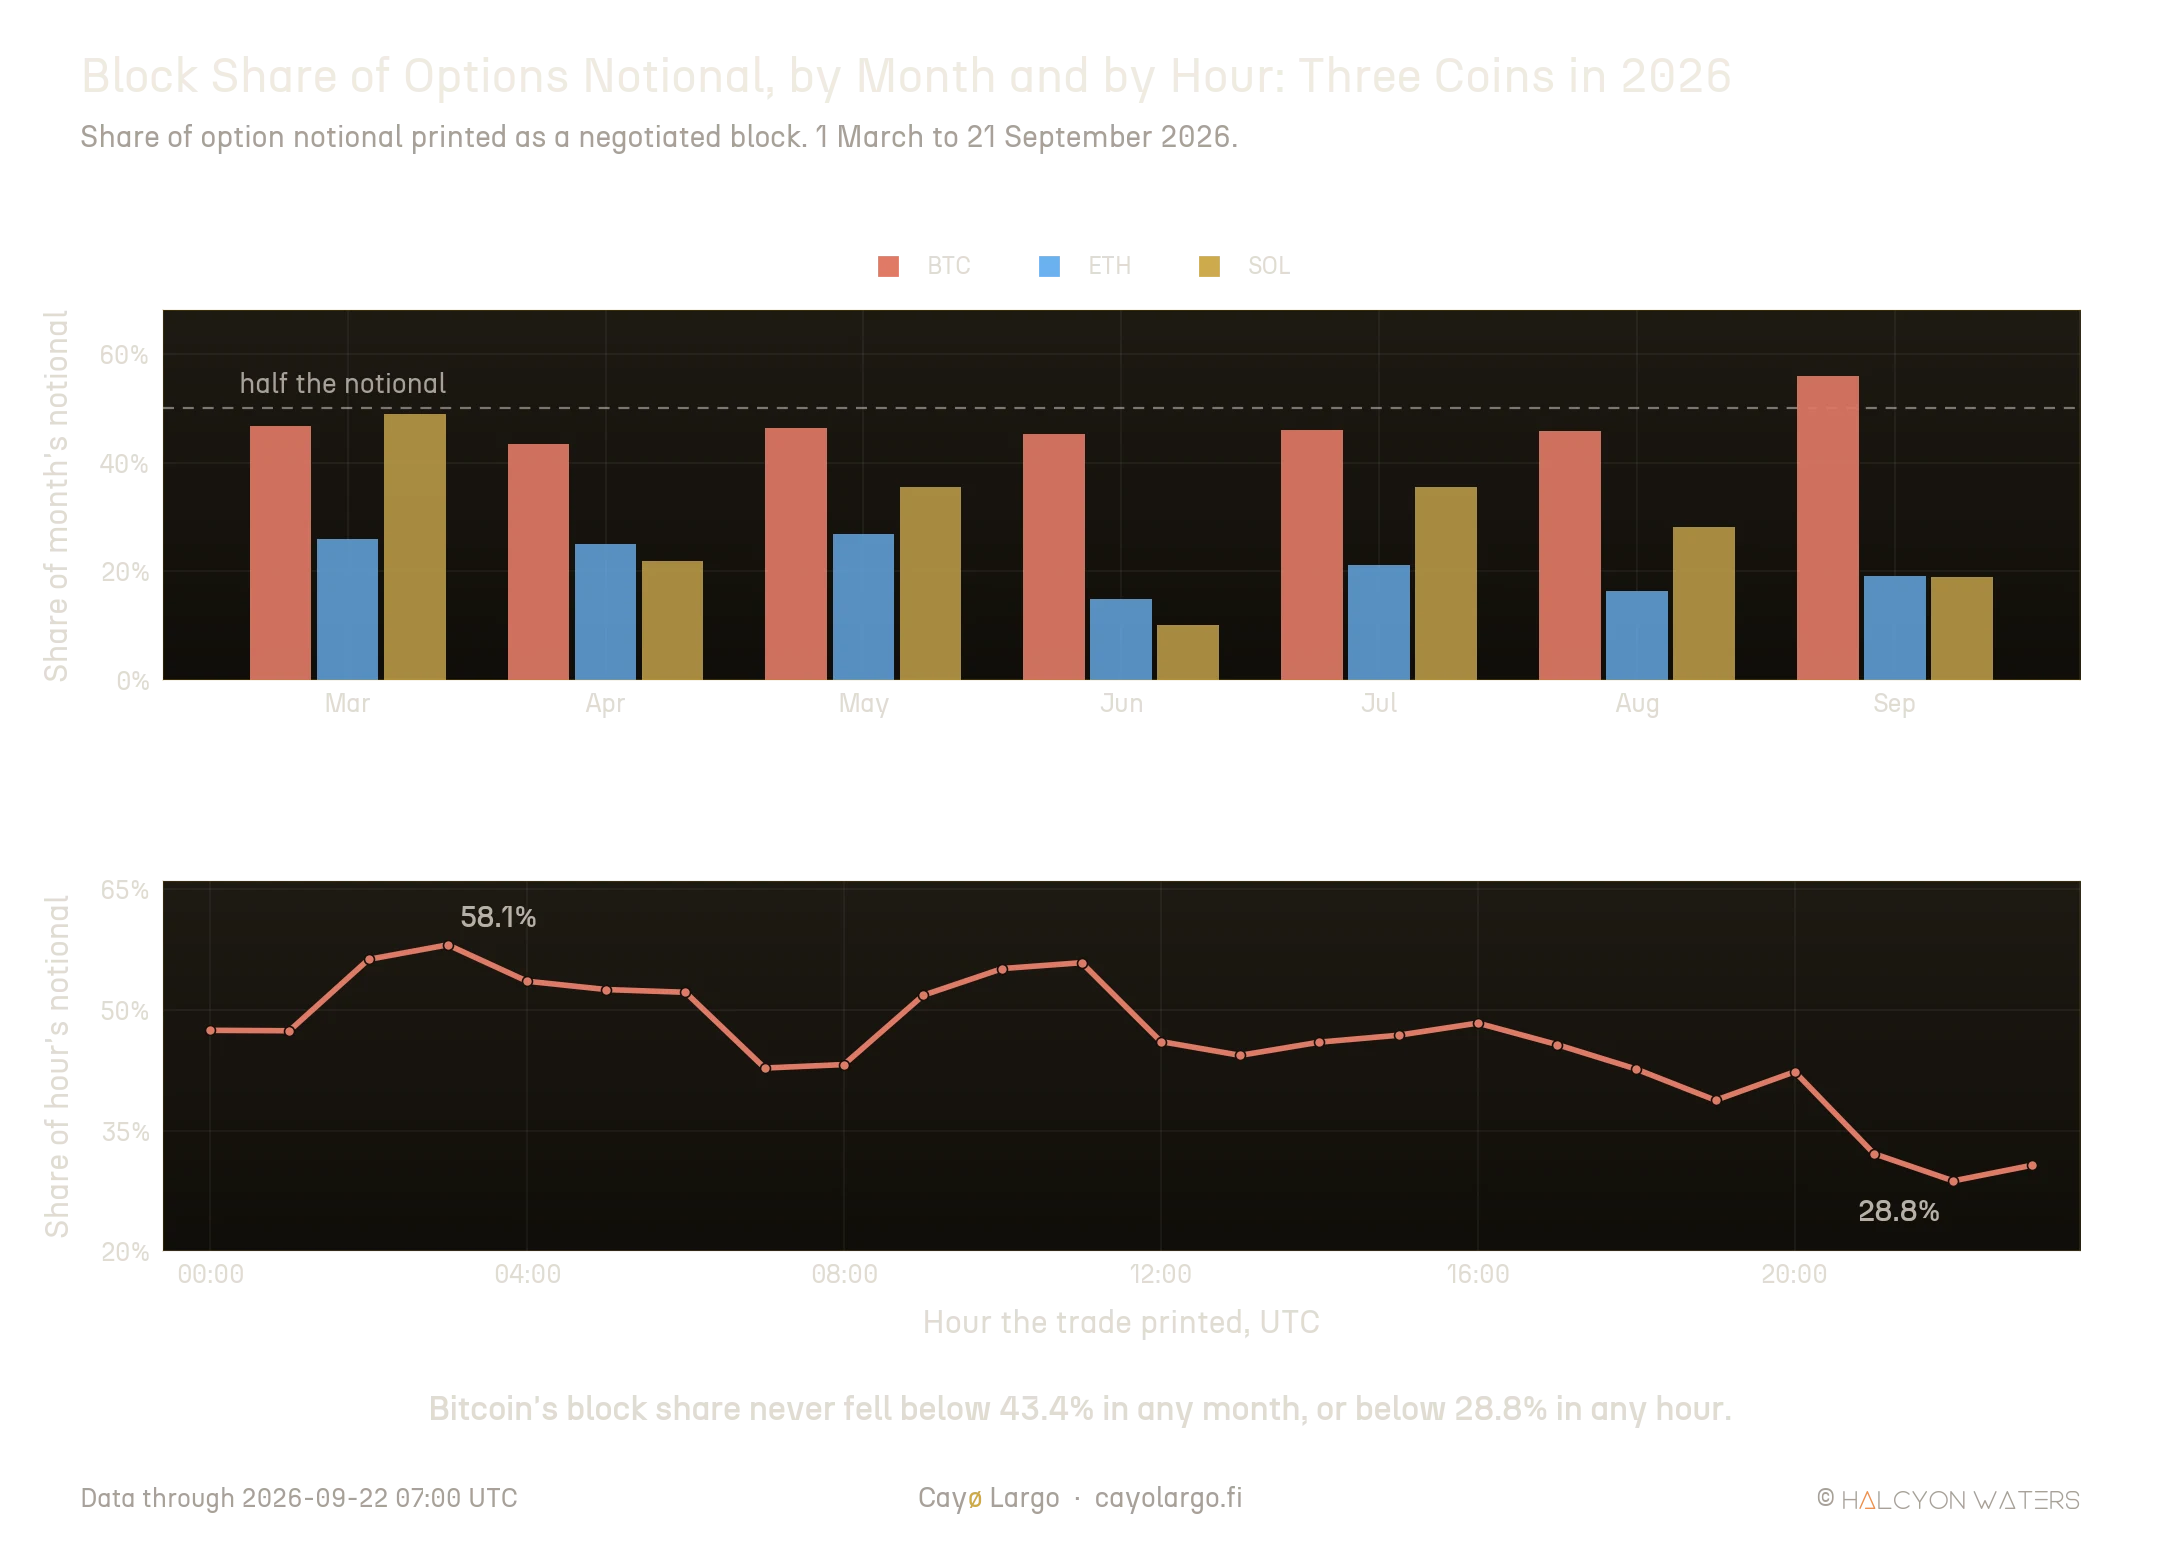
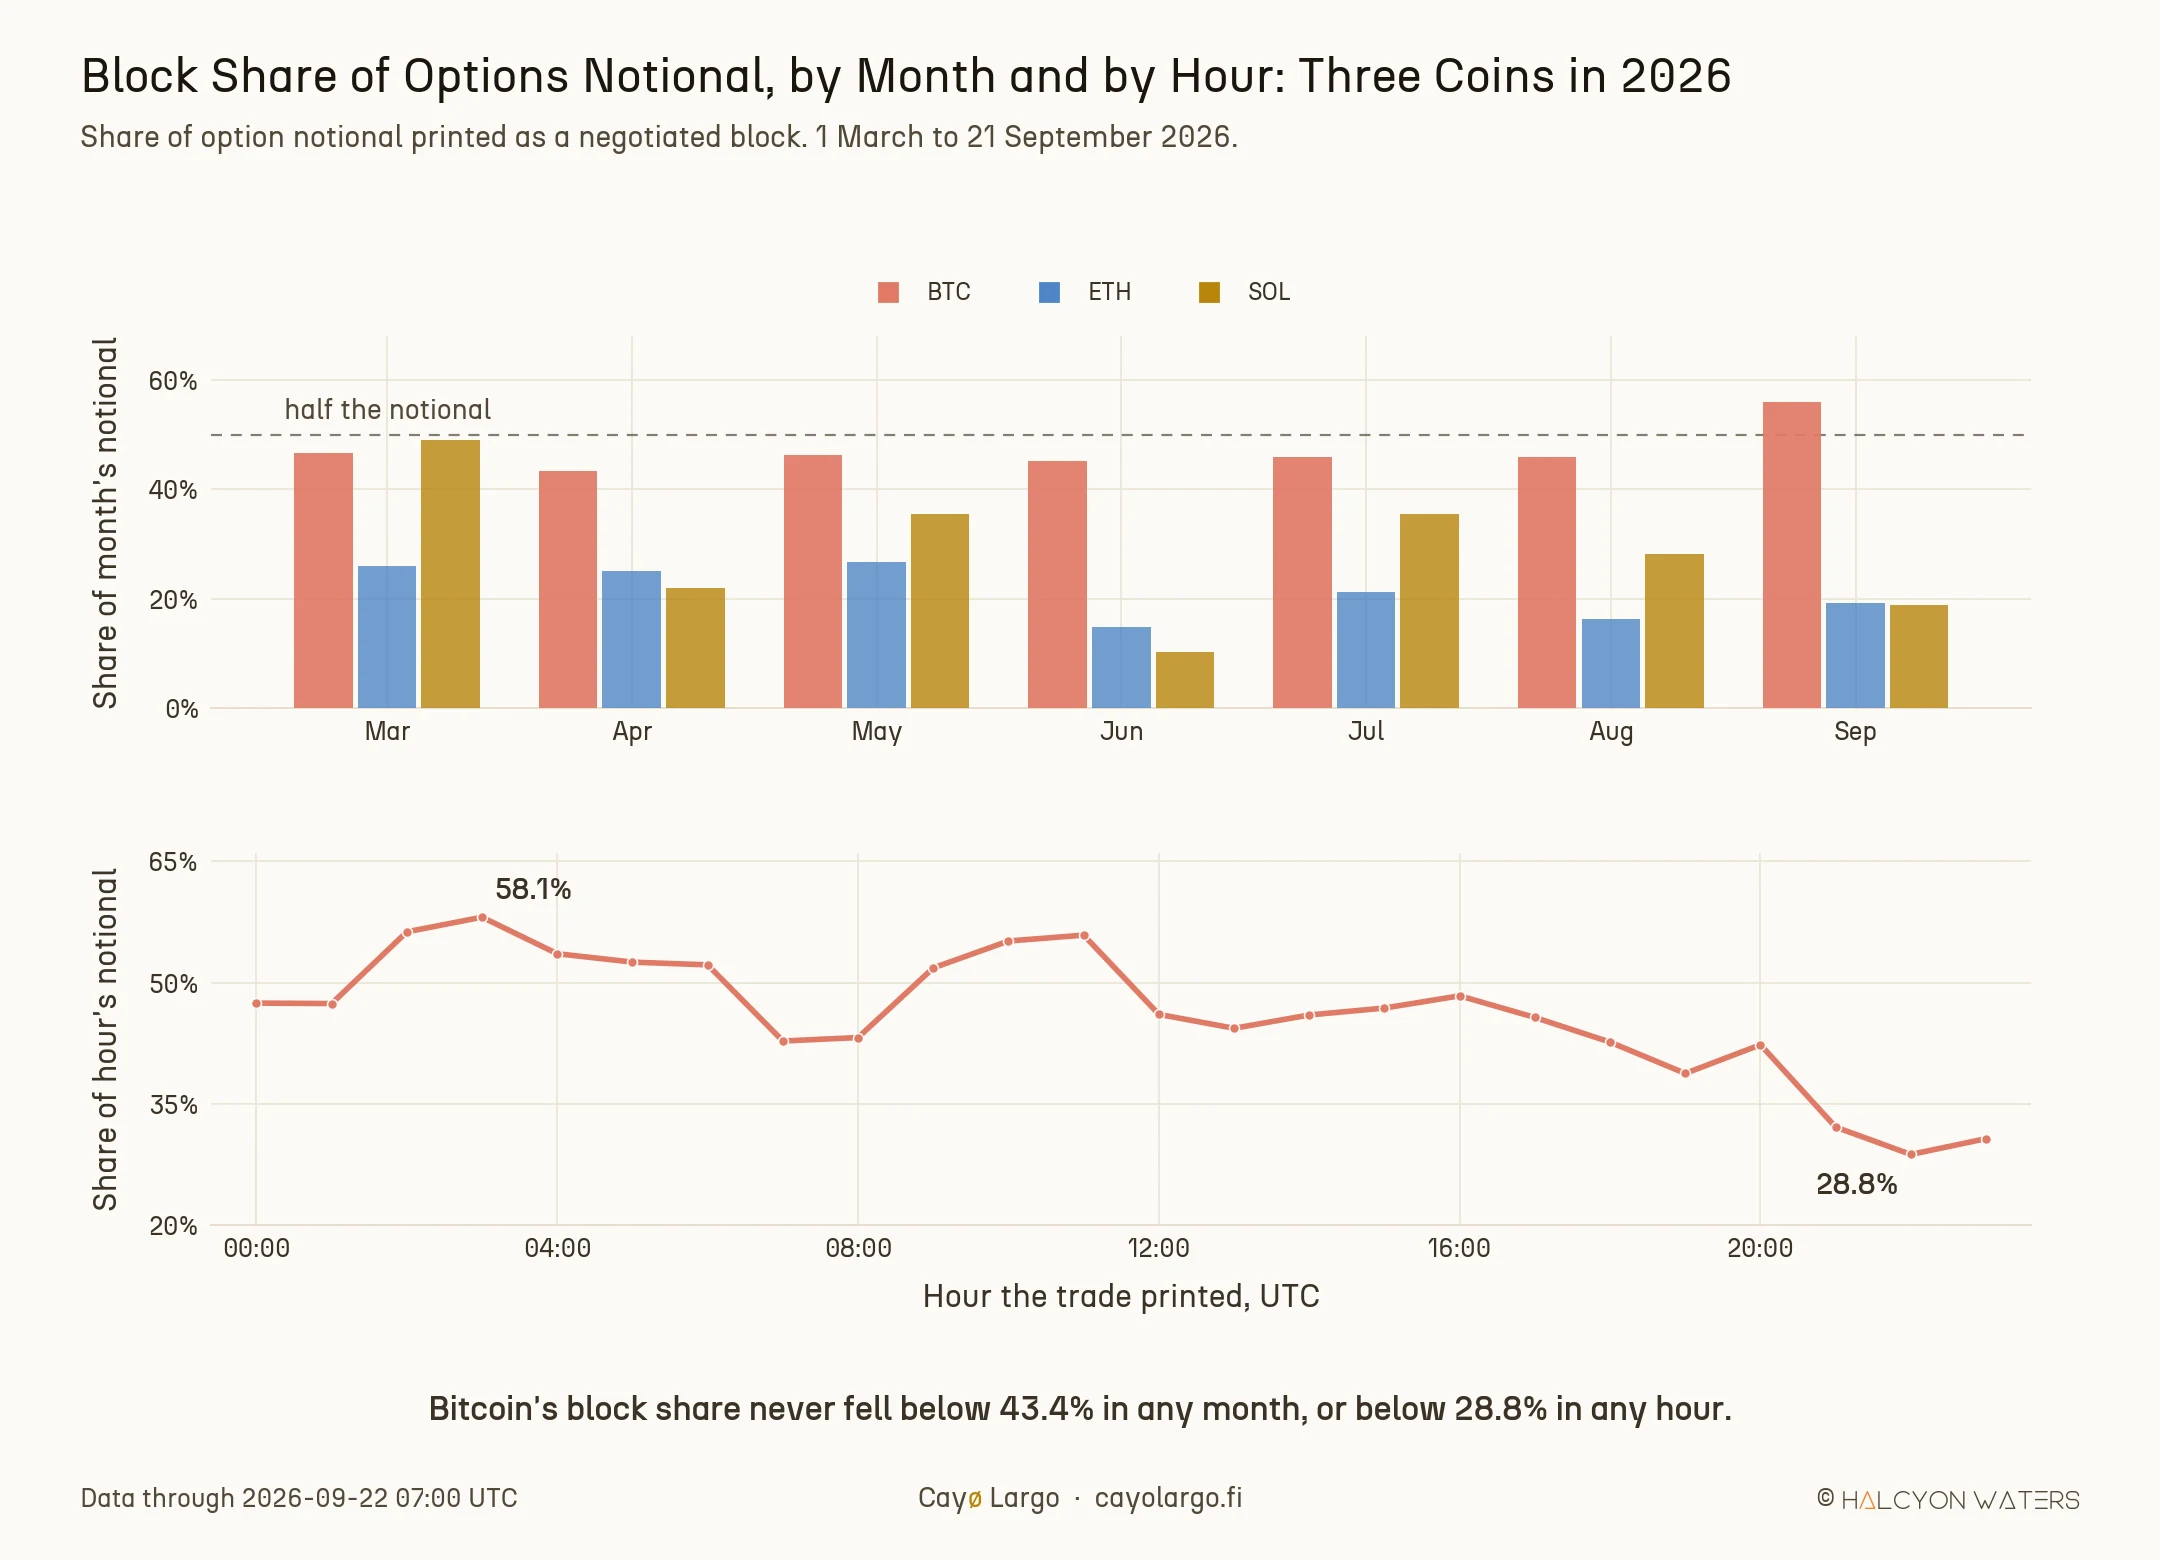
Figure 2: Block share of option notional by month, three coins and by hour of the day for Bitcoin. The dashed line in the upper panel marks half the notional. Bitcoin's monthly share ranges 43.4% to 56.0%; its hourly share ranges 28.8% to 58.1%. It is highest in the Asian morning and lowest in the late American evening and it never goes away.
Nothing here is a spike. A feature that holds in every month and in every hour of the day is not the residue of one crowded week. It is how the market is built.
The same month, counted from the other side
A tape reconstruction is worth exactly as much as its agreement with somebody who can see the trades directly. Paradigm can. It has run the block workflow on Deribit since 2019 and since 2026 it publishes a monthly recap carrying its own volumes and its own share of the venue.
Its August 2026 recap and our archive describe the same market in the same month, Bitcoin and Ether together. Two counts, taken from opposite ends of the same trades.
| August 2026, BTC and ETH | Paradigm's recap | Cayø Largo's tape | Difference |
|---|---|---|---|
| Deribit options notional | $62.97bn | $63.24bn | $0.27bn, or 0.4% of the total |
| Notional printed as blocks | $26.86bn | $26.88bn | $0.02bn, or 0.1% of the total |
| Block share of the tape | 42.66% | 42.50% | 0.16 percentage points |
Neither number was fitted to the other. Paradigm counts its own executions against the venue's published totals. We count every trade Deribit printed and read the block marker on each one. The two land a fifth of a percentage point apart.
The recap also carries the piece we cannot compute, namely which provider stands behind any single negotiated print, because Deribit's tape does not say. Paradigm alone was 20.16% of that August tape, or 47.27% of the block segment. The rest came from other providers and from Deribit's own Block RFQ, which our archive does separate: 13.4% of all Bitcoin option notional across our window, which is the same 28.6% of the block segment quoted later, seen against a different denominator.
There is a second agreement, from a different window and a different publication. Paradex, the onchain venue Paradigm launched this year, published a 60-day study of Deribit covering 12 May to 10 July 2026 and split the volume three ways: the order book at roughly 57%, Paradigm at 21% and all other block providers at 22%. Pool our three coins across the full seven months and we get 56.83% on the book against 43.17% negotiated. Their 57 against our 56.83, on a window that sits inside ours and a method that shares nothing with it.
And it answers the question our seven-month window cannot. Paradigm's share of Deribit has held a 27.6% median across nearly six years since November 2020 and has never dropped below 12%. So the level we measure is not a 2026 curiosity. It is the shape of this market and it has been for most of the venue's life.
Long-dated books are mostly negotiated
The share is not flat across the curve. It climbs steadily with time to expiry and on Bitcoin it more than doubles from the front to the back.
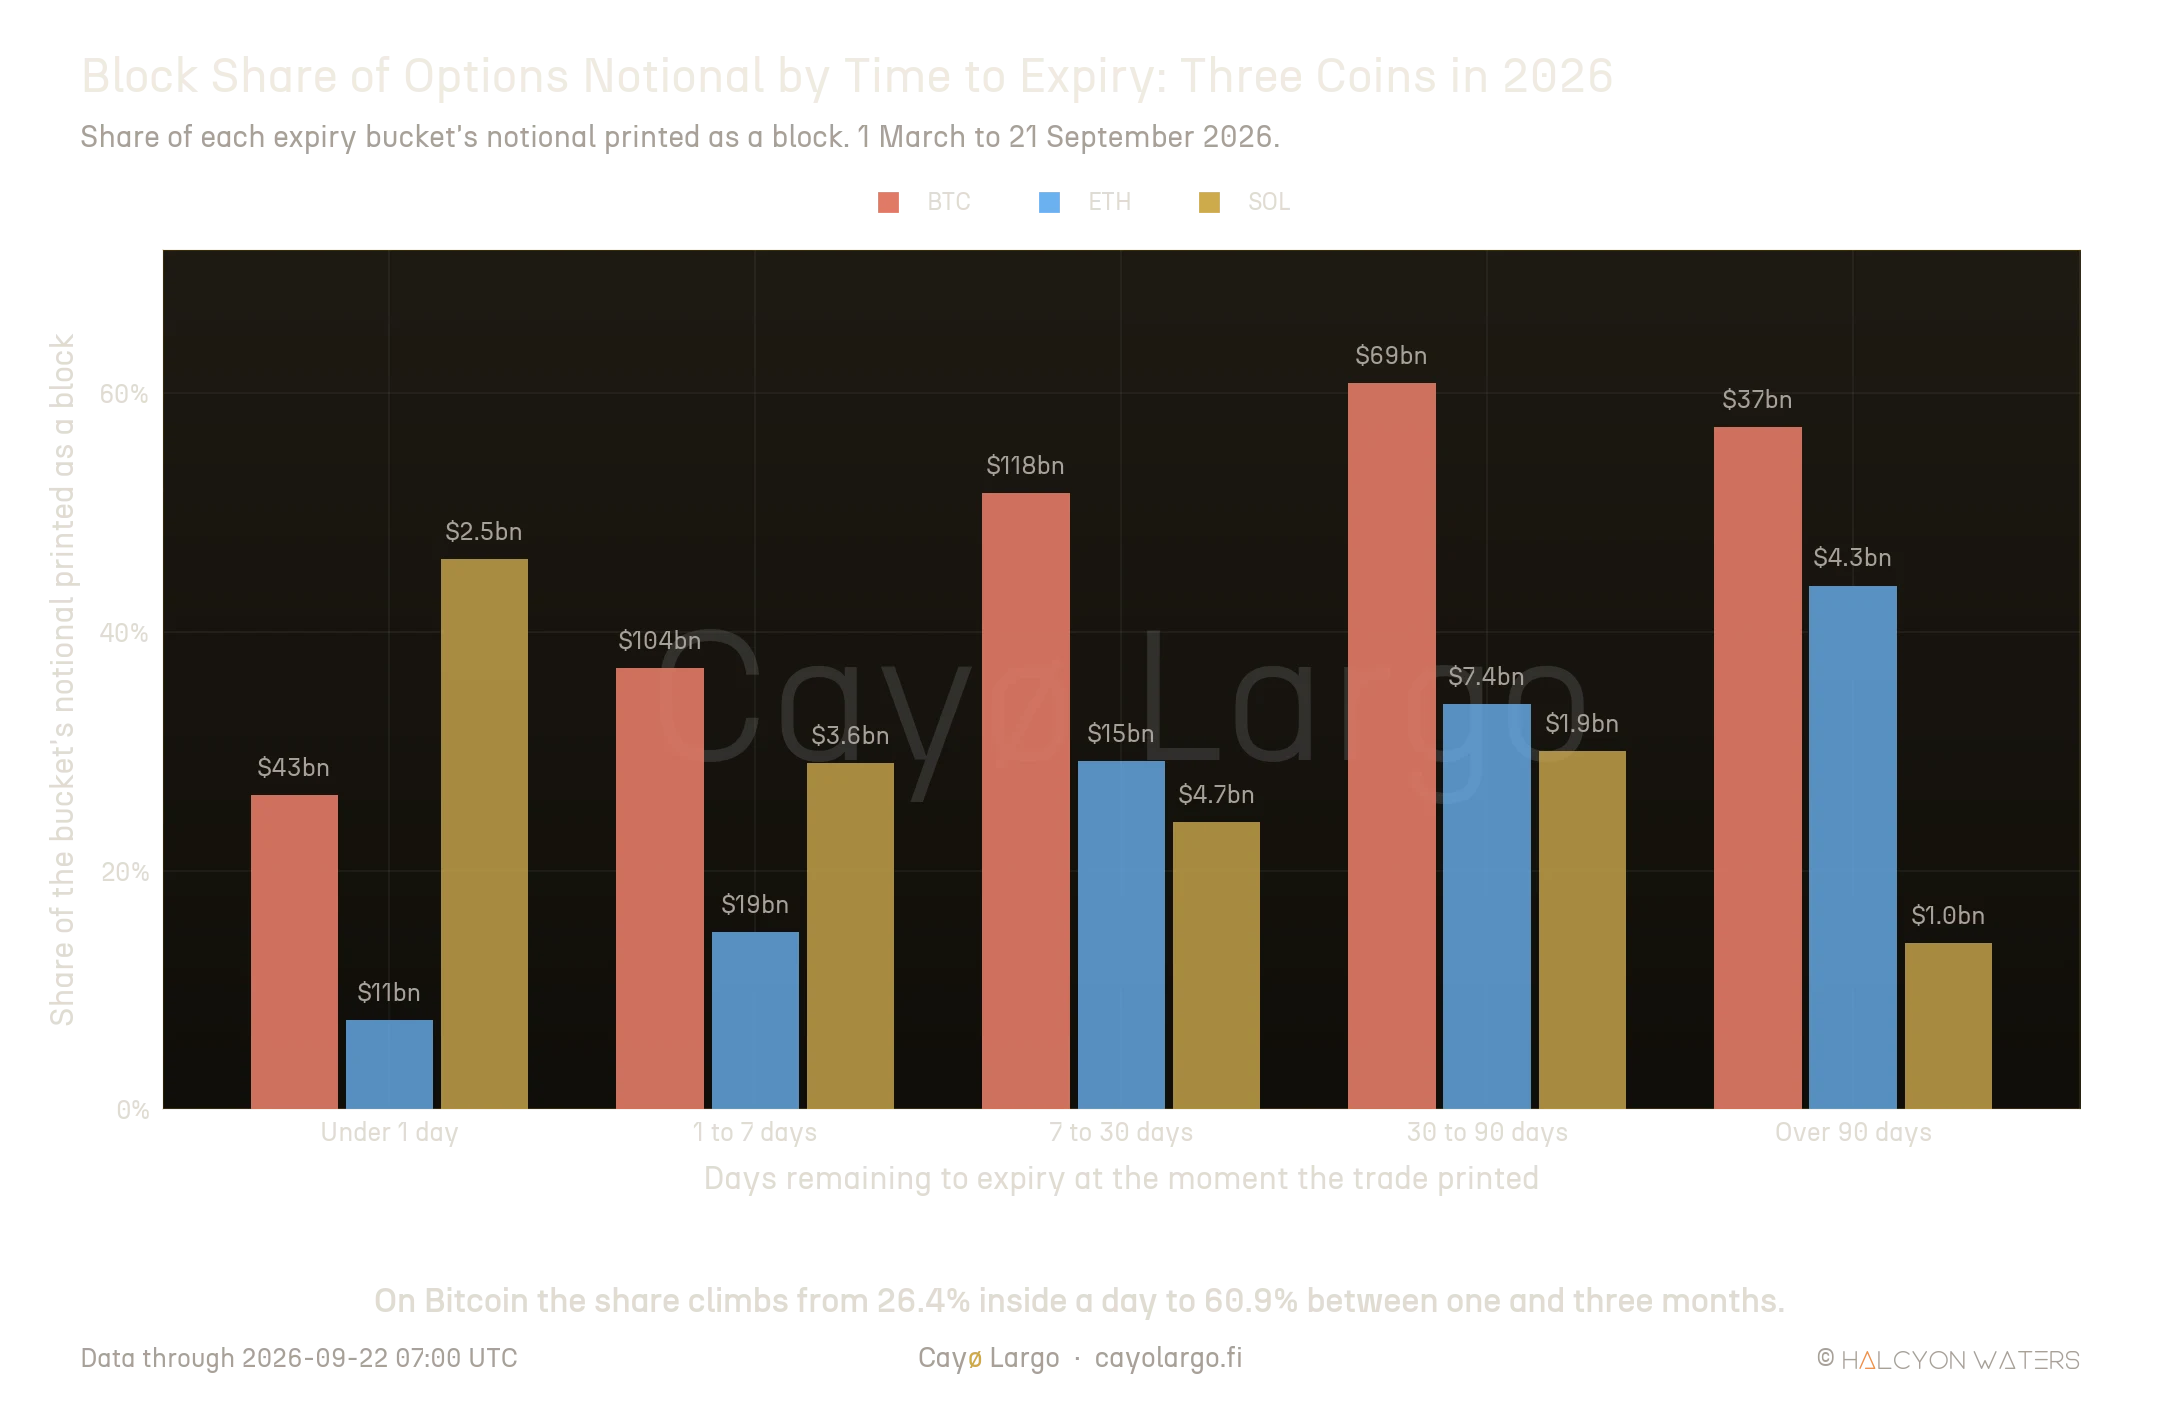
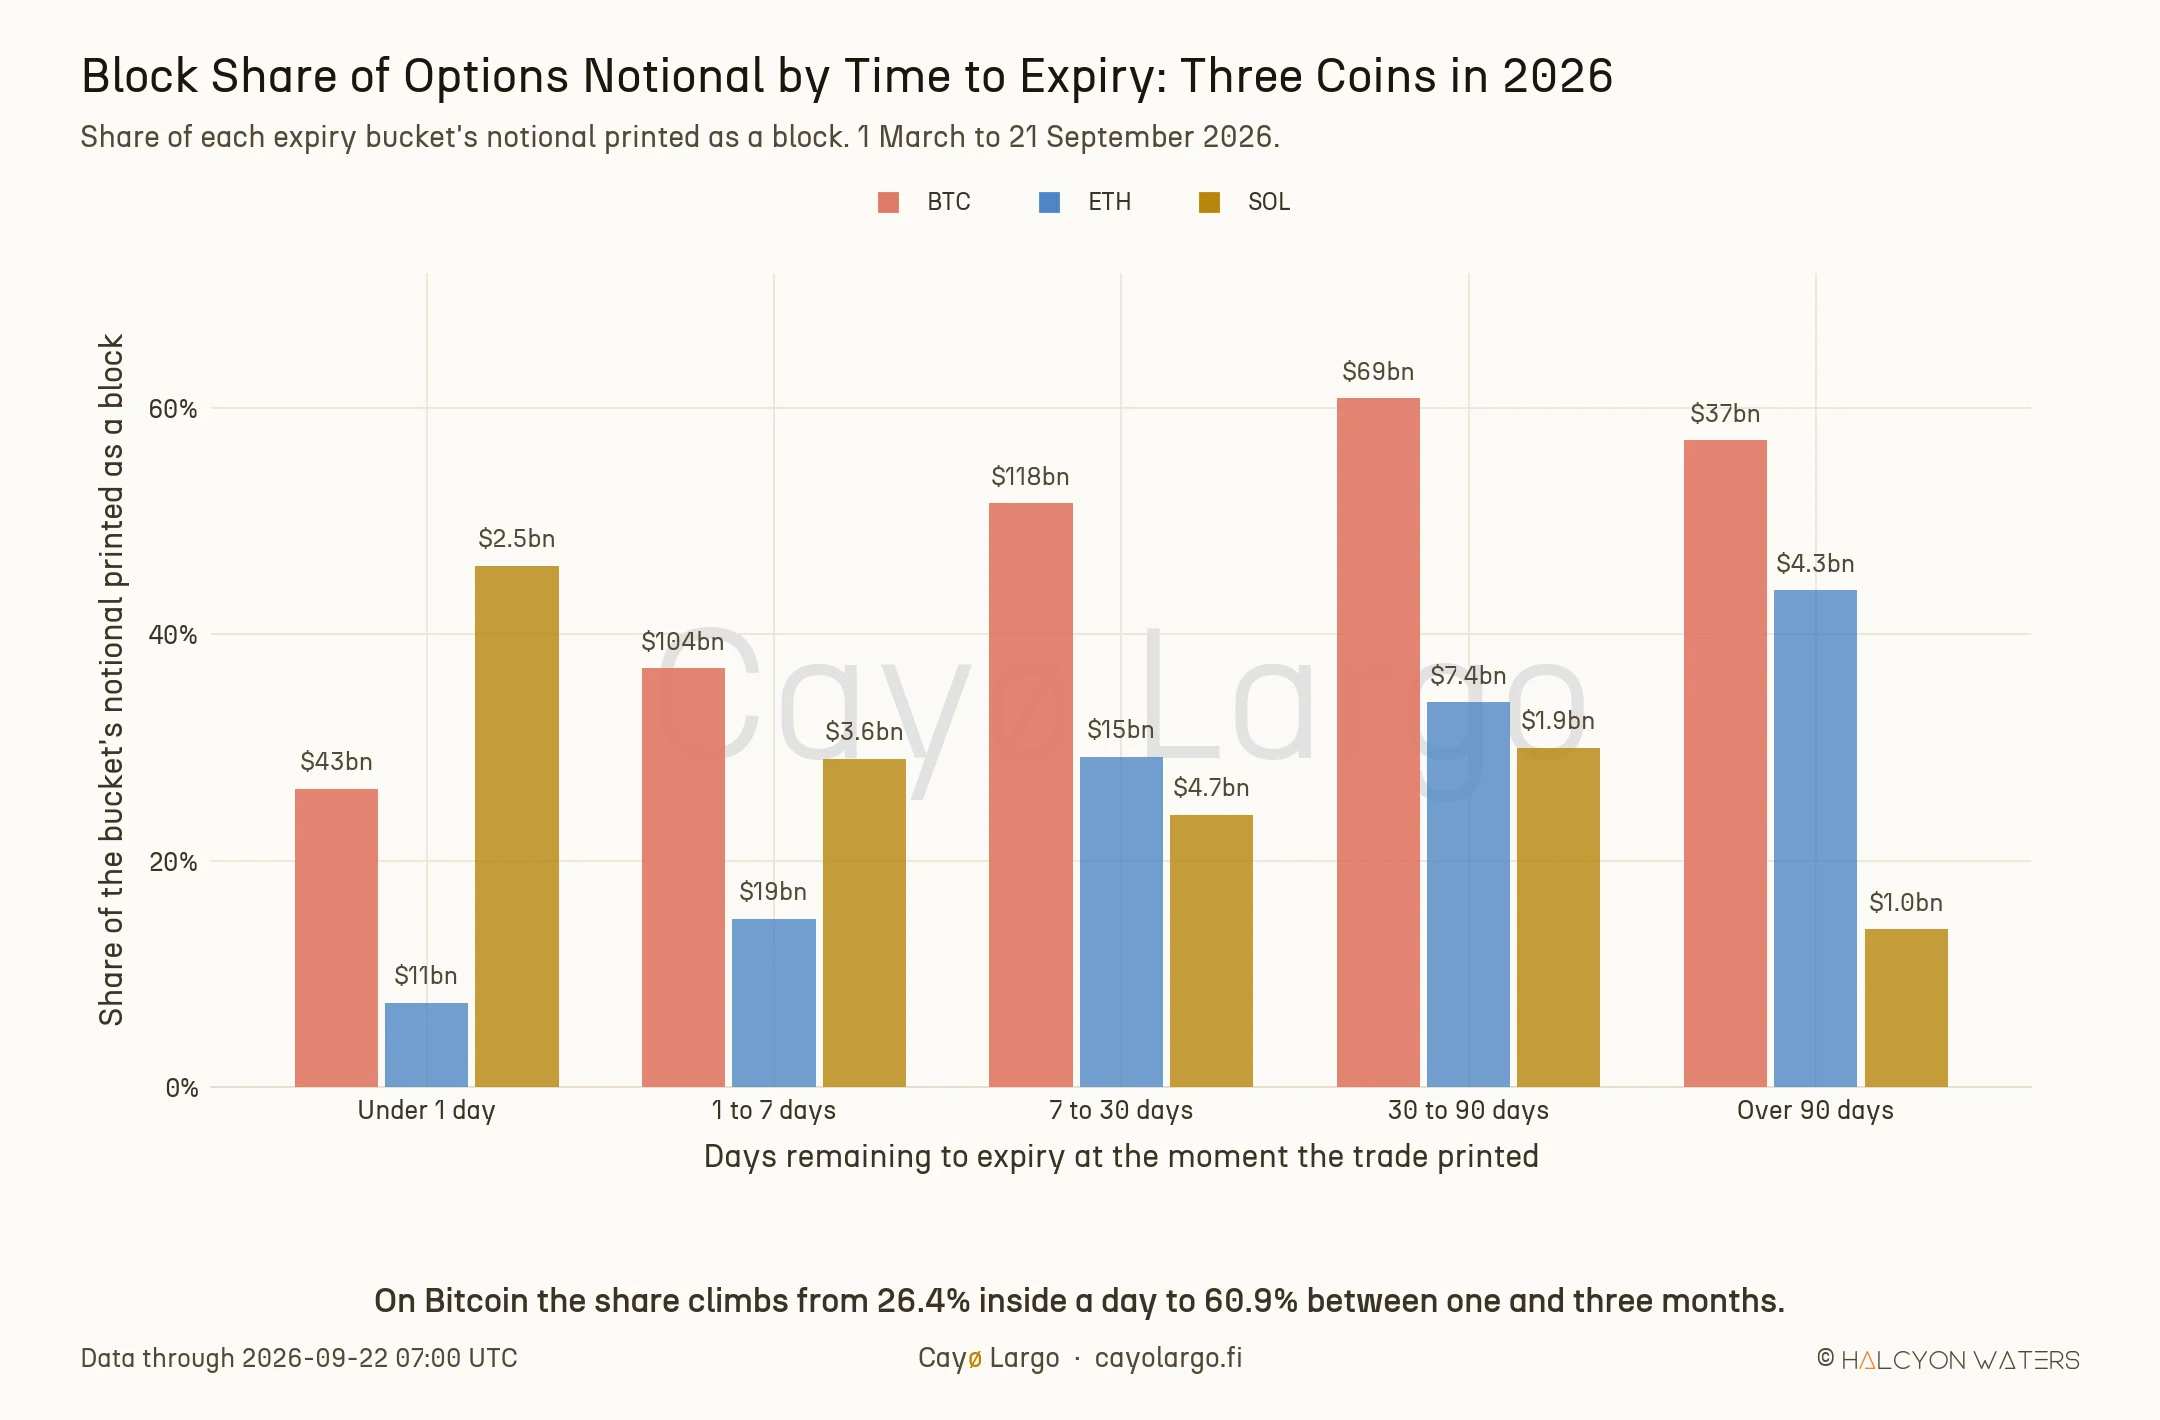
Figure 3: Block share of notional by days remaining to expiry. Labels above each bar give the notional traded in that bucket. Bitcoin runs 26.4% inside a day to 60.9% at one to three months; Ether climbs monotonically from 7.4% to 43.9%. Solana runs the other way and its block population is only 341 trades, so read it as a caution rather than a pattern.
Between thirty and ninety days, 60.9% of Bitcoin's option notional is negotiated rather than executed. Ether does the same thing more gently, 7.4% inside a day rising monotonically to 43.9% beyond three months. Solana inverts it and with 341 block trades in total we treat that as too thin to read.
The mechanism is not mysterious. The academic work on equity options finds that option illiquidity varies sharply with maturity and is most sensitive to order-flow risk at ultra-short tenors, which is where liquidity providers are most exposed and quote most carefully. Pederzoli, Doshi and Sert, writing around 2025, document that the relationship between order-flow volatility and illiquidity decreases as maturity increases. The crypto reading is the complement: the short end is quoted continuously and can absorb size on screen, while the long end is quoted thinly and anything meaningful has to be negotiated.
These are structures, not bets
The second reason has nothing to do with depth. 89.4% of Bitcoin block trades carry more than one leg. The median block has 2 legs and the mean has 12.95, so the average is dragged by a tail of very large packages; on Ether the mean reaches 25.09 legs. Deribit's own Block RFQ accounts for 28.6% of Bitcoin's block notional and 21.4% of Ether's, with the rest arriving through the older negotiated route.
Anyone who has tried to open a four-legged position on screen knows why this matters and the clearest statement of the problem we know of comes from retail rather than from a desk. Writing in December 2014, Gavin at Options Trading IQ explained that entering an iron condor as one order means needing the market makers to give you a good fill on all four legs simultaneously and concluded that it was close to impossible. Twelve years on, with four legs replaced by thirteen and a retail clip replaced by $2M, the problem is identical and the block RFQ is the institutional answer to it.
Paradigm's August figures put numbers on the same point from the other side: 1,425 blocks carried 2,417 taker legs and 59.53% of the month's gross notional had 31 calendar days or less to expiry, with the September quarterly the single most traded expiration. Packages, near-dated, in size.
Does going off screen get you a better price?
The mechanism was built on a promise. Deribit and Paradigm launched it in 2019 to negotiate away from the order book and minimise impact on the market price and Paradigm still describes the result as better-than-screen execution. It is worth testing and it is worth being precise about what "better" is measured against.
Define the distance from mark for trade as
where is the price the trade printed at and is the exchange's mark price for that option at that moment. It measures how far a fill landed from the venue's own fair value, in either direction, without needing to know which side was the aggressor.
Sort every Bitcoin trade into notional bands and the answer looks emphatic. Between $1M and $5M, the median block prints 1.04% from mark against 2.54% for an order-book trade of the same size. Less than half as expensive. The gap holds in all seven months of the window.
We believed that result for about an hour.
The problem is what the two populations are not sharing. A block and an order-book trade of the same notional are rarely the same option and almost never the same minute. So hold the option and the moment fixed. For each cell , meaning one option in one hour, take
where are the blocks in that cell, the order-book trades in it and both sides must clear the same notional floor. The advantage does not survive.
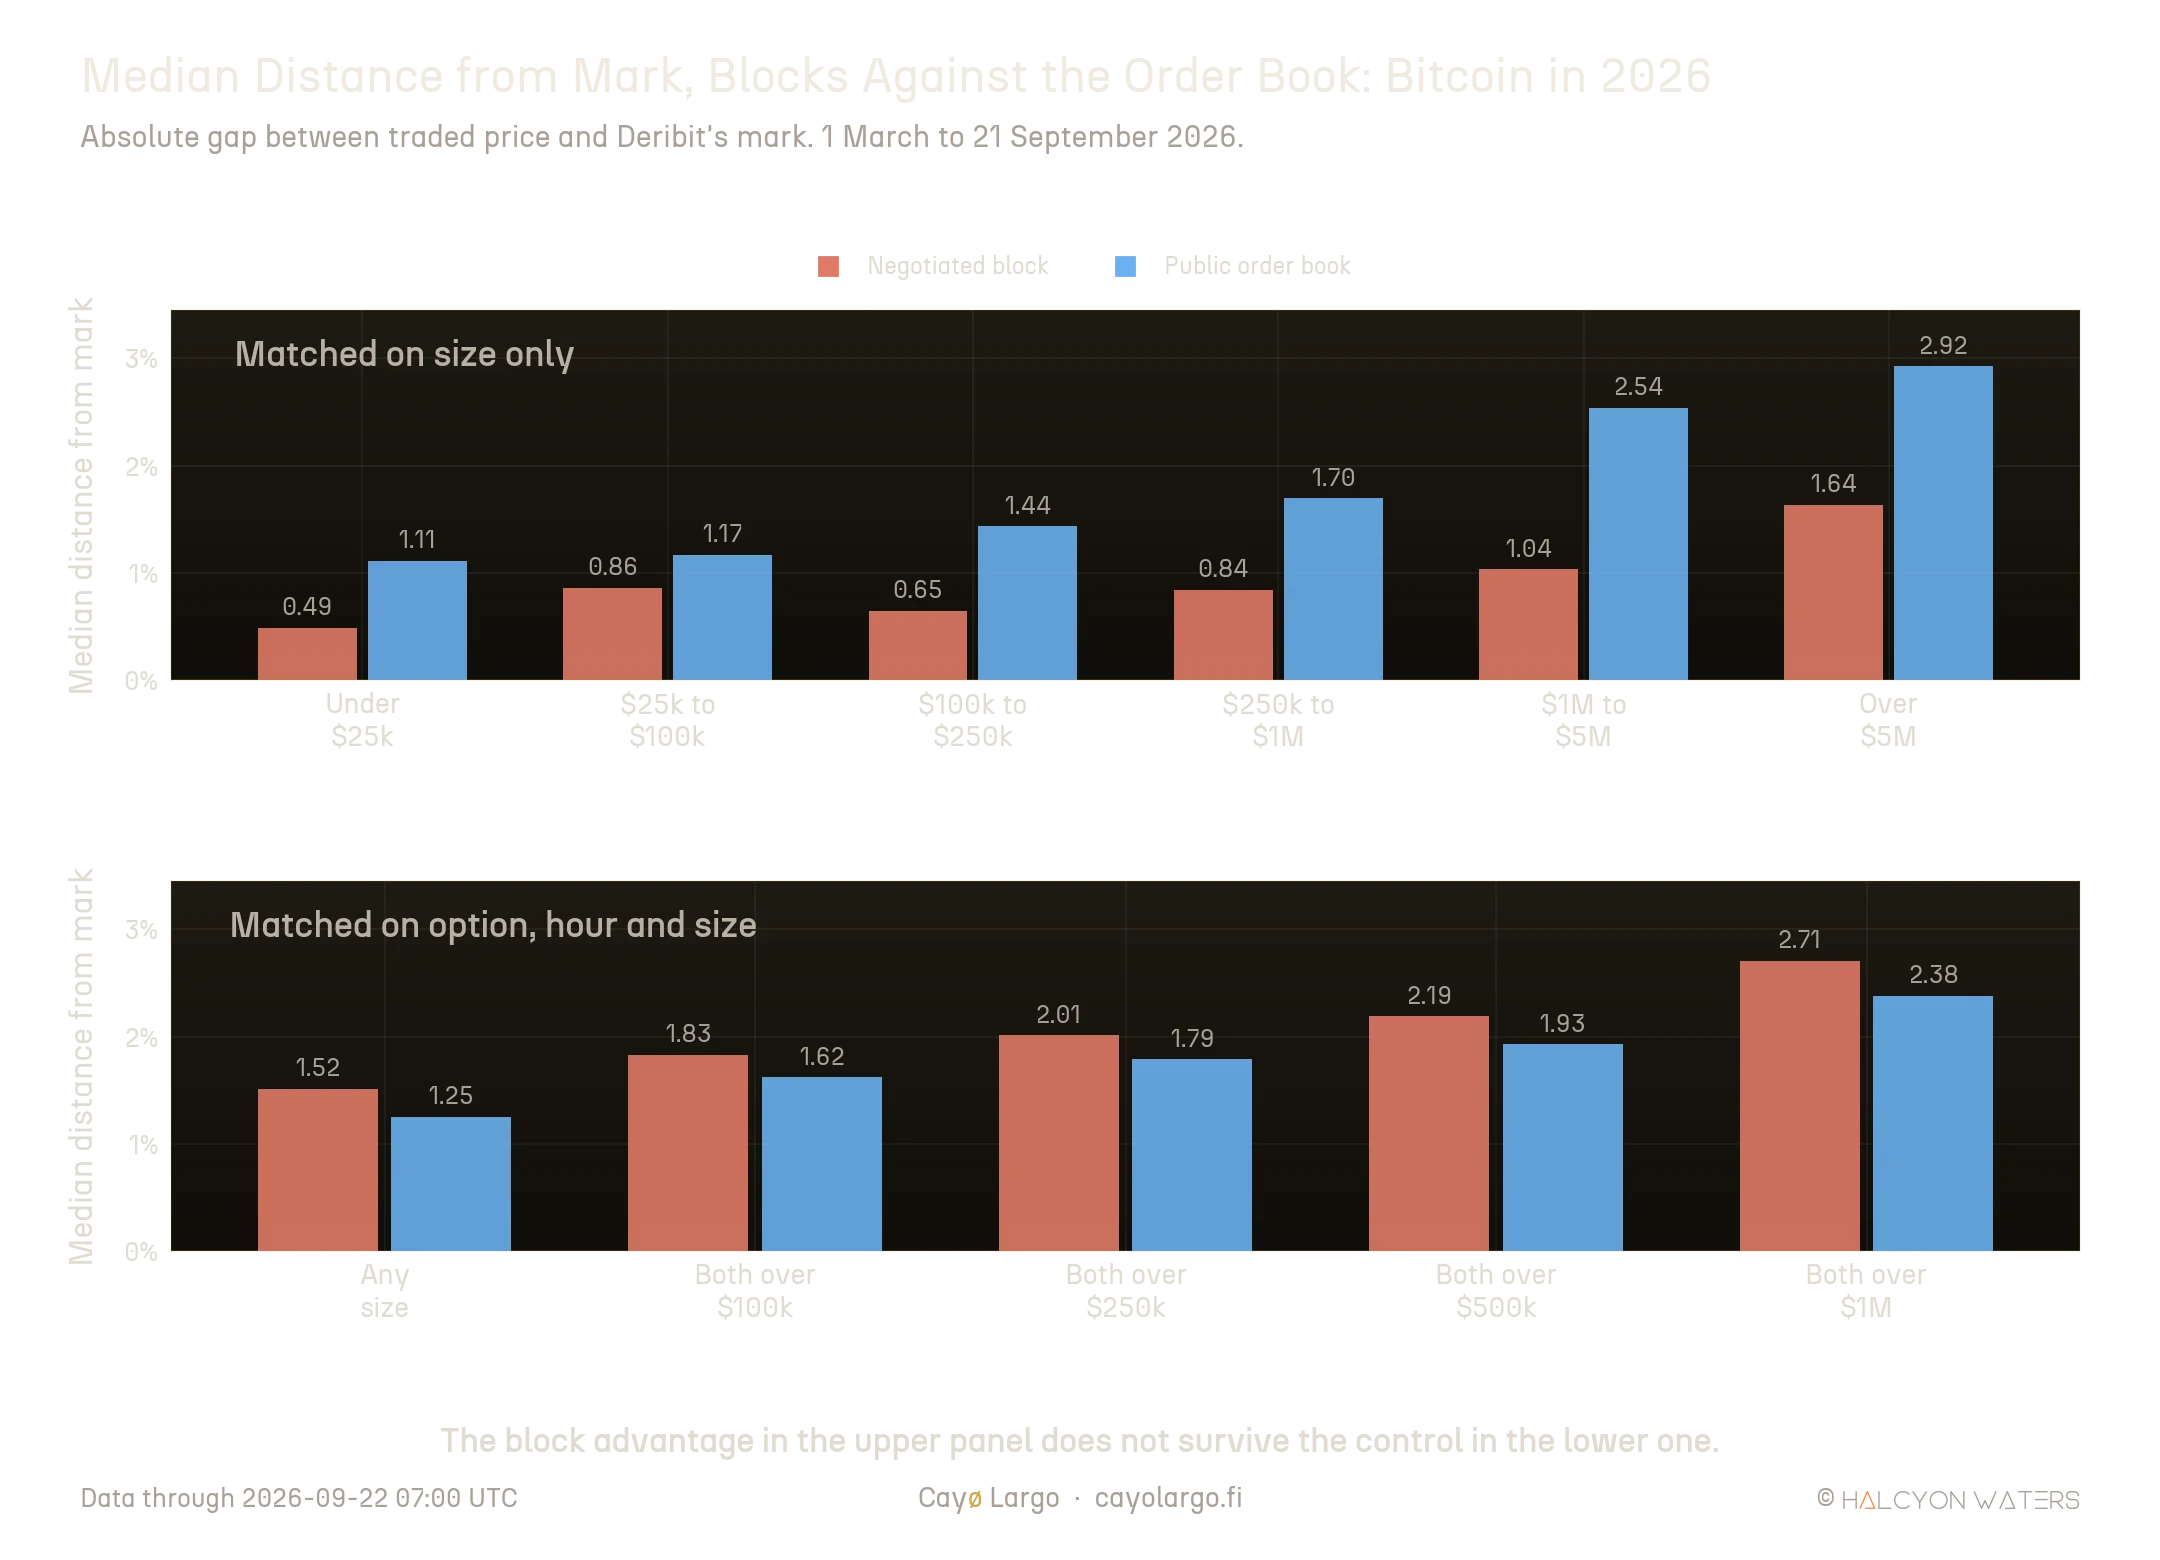
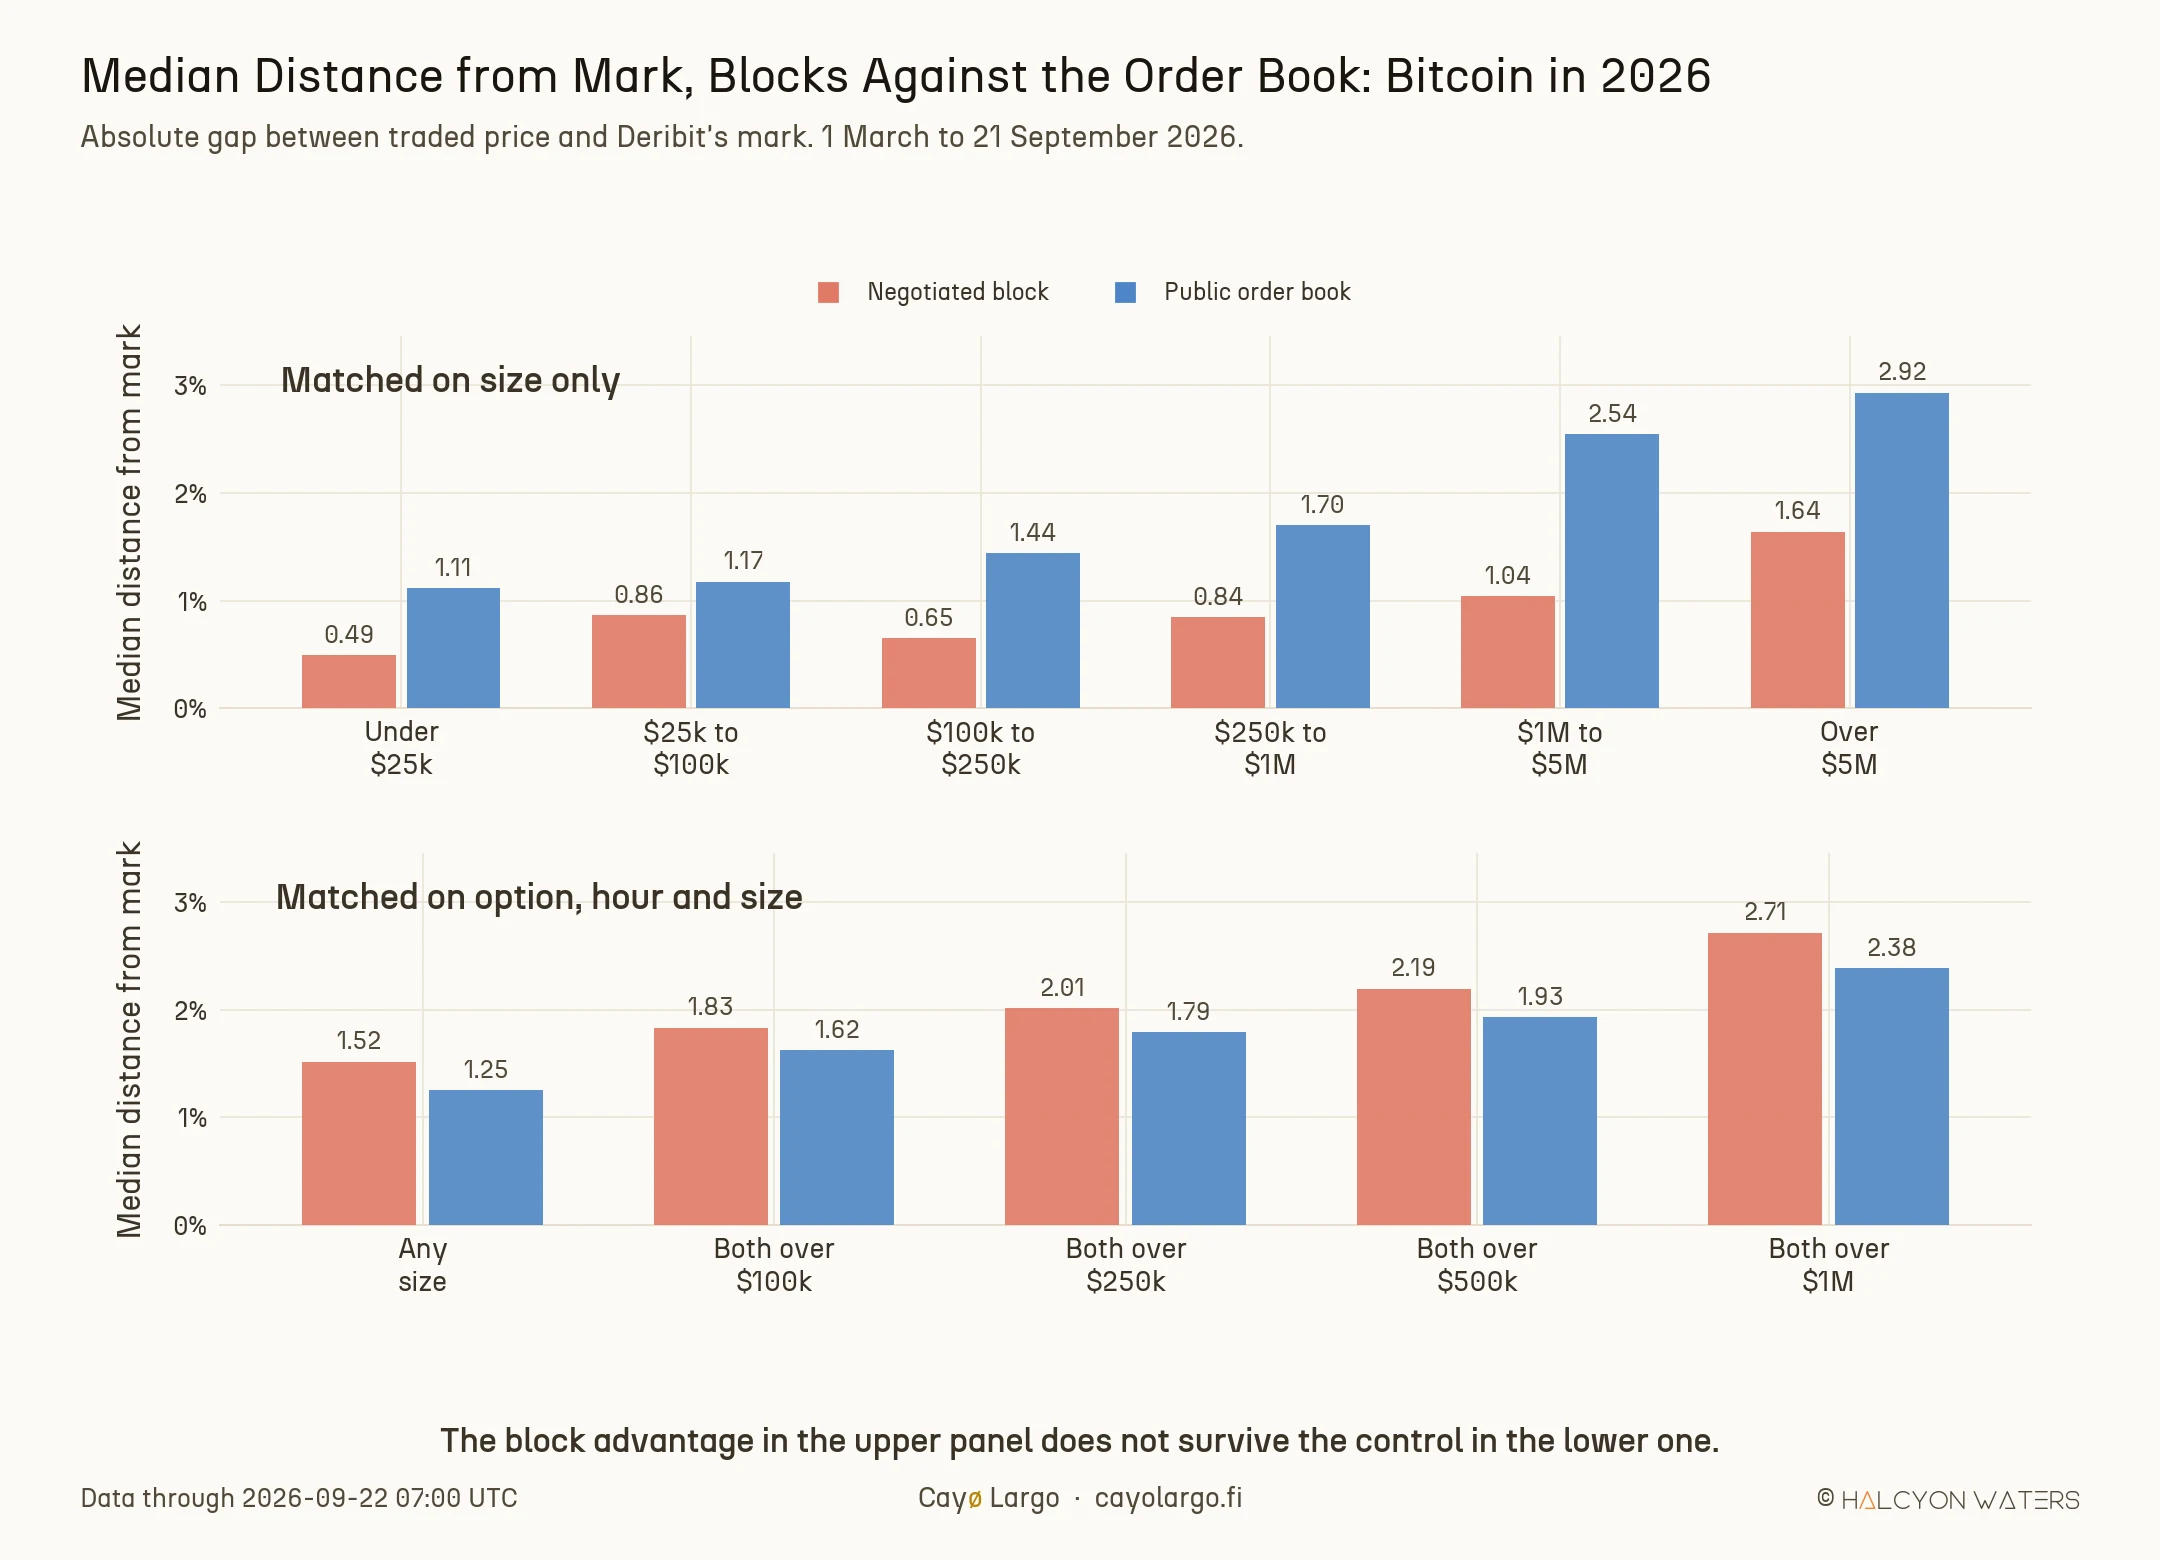
Figure 4: Median distance from Deribit's mark, blocks against the order book, under two controls. Matched on size alone the block looks much cheaper at every size. Matched on option, hour and size the ordering reverses, by 0.20 to 0.34 percentage points, with the block closer in only 43% of the 4,779 matched cells at the $100k floor.
At a $100,000 floor on both sides, 4,779 matched cells, the block prints 0.22 percentage points further from mark than the order-book trade beside it. It is the closer of the two in only 43.9% of cells. A Wilcoxon signed-rank test on the paired differences gives .
Raise the floor to $1M and 931 cells remain, with the gap widening to 0.34 percentage points. Read those two medians directly and the reversal is plain: the block prints 2.71% from mark against 2.38% for the order-book trade beside it in the same option and hour. Match on the day rather than the hour, what admits more cells at high floors. The gap closes and at a $1M floor leans slightly the other way, 1.87% against 2.16% over 3,129 cells at . Nothing in either direction is worth a basis point of a trading decision.
In other words, the emphatic version of this result was measuring which options get traded in size, not which route prices them better.
What the network's own numbers say about the same question
Here is where it pays to have both sides of the trade publishing. Paradigm measures execution against the top of the book, not against the mark and those are not the same question. The mark is the venue's fair value. The top of book is the best price actually displayed, for the quantity actually displayed.
Their August recap reports that across 2,385 Bitcoin and Ether legs facing a two-sided screen, 70.02% received price improvement versus the top of book. Keep in mind what that sample contains. It covers multi-leg packages and a leg of a thirteen-leg structure is not something the screen was offering to fill at all. Their own cleanest comparison is the single-leg one, namely 579 blocks carrying one option leg against a two-sided screen and there the figure is 47.32% receiving price improvement, with 61.83% filling at or inside the displayed spread.
So put the two independent measurements side by side.
| Question | Measured by | Block wins |
|---|---|---|
| Beat the best displayed price, single leg | Paradigm, August 2026, 579 blocks | 47.32% |
| Closer to the exchange mark, matched option and hour | Cayø Largo, March to September 2026, 4,779 cells | 43.9% |
Different benchmarks, different windows, different data and neither one clears half. On price alone, taking a block rather than the screen is close to a coin flip.
That is not a criticism of the mechanism and the same recap says what the mechanism is for. 70.60% of Bitcoin legs executed at a size larger than the quantity displayed at the best price and the average was 35.25 times it. Their own illustration, again, is a 20 BTC order against 5.79 BTC showing.
The block's edge is access to size, not price discovery. You are not paying to beat the print the screen would have given you. You are paying to get a print at all, for a quantity the screen was never showing, on every leg at once and at one agreed price. Read that way, 47.32% is not a disappointing number. It is the right number for a service selling something else entirely.
Why this changes how the tape reads
The reason to care is not the number itself. It is that every metric anyone computes from the options tape is computed on the visible half. Dollar-weighted buy pressure. The taker-flow sign behind a dealer gamma calculation. The volume that decides which strikes matter. On Bitcoin all of them read 53.1% of the notional and treat it as the whole. On the thirty-to-ninety day bucket, the part of the curve a volatility surface is actually fitted to, they read 39.1%.
Put the whole surface on one grid and the split has a shape. This is the same tape our Options Thermography page draws live, cut by how each trade was done.
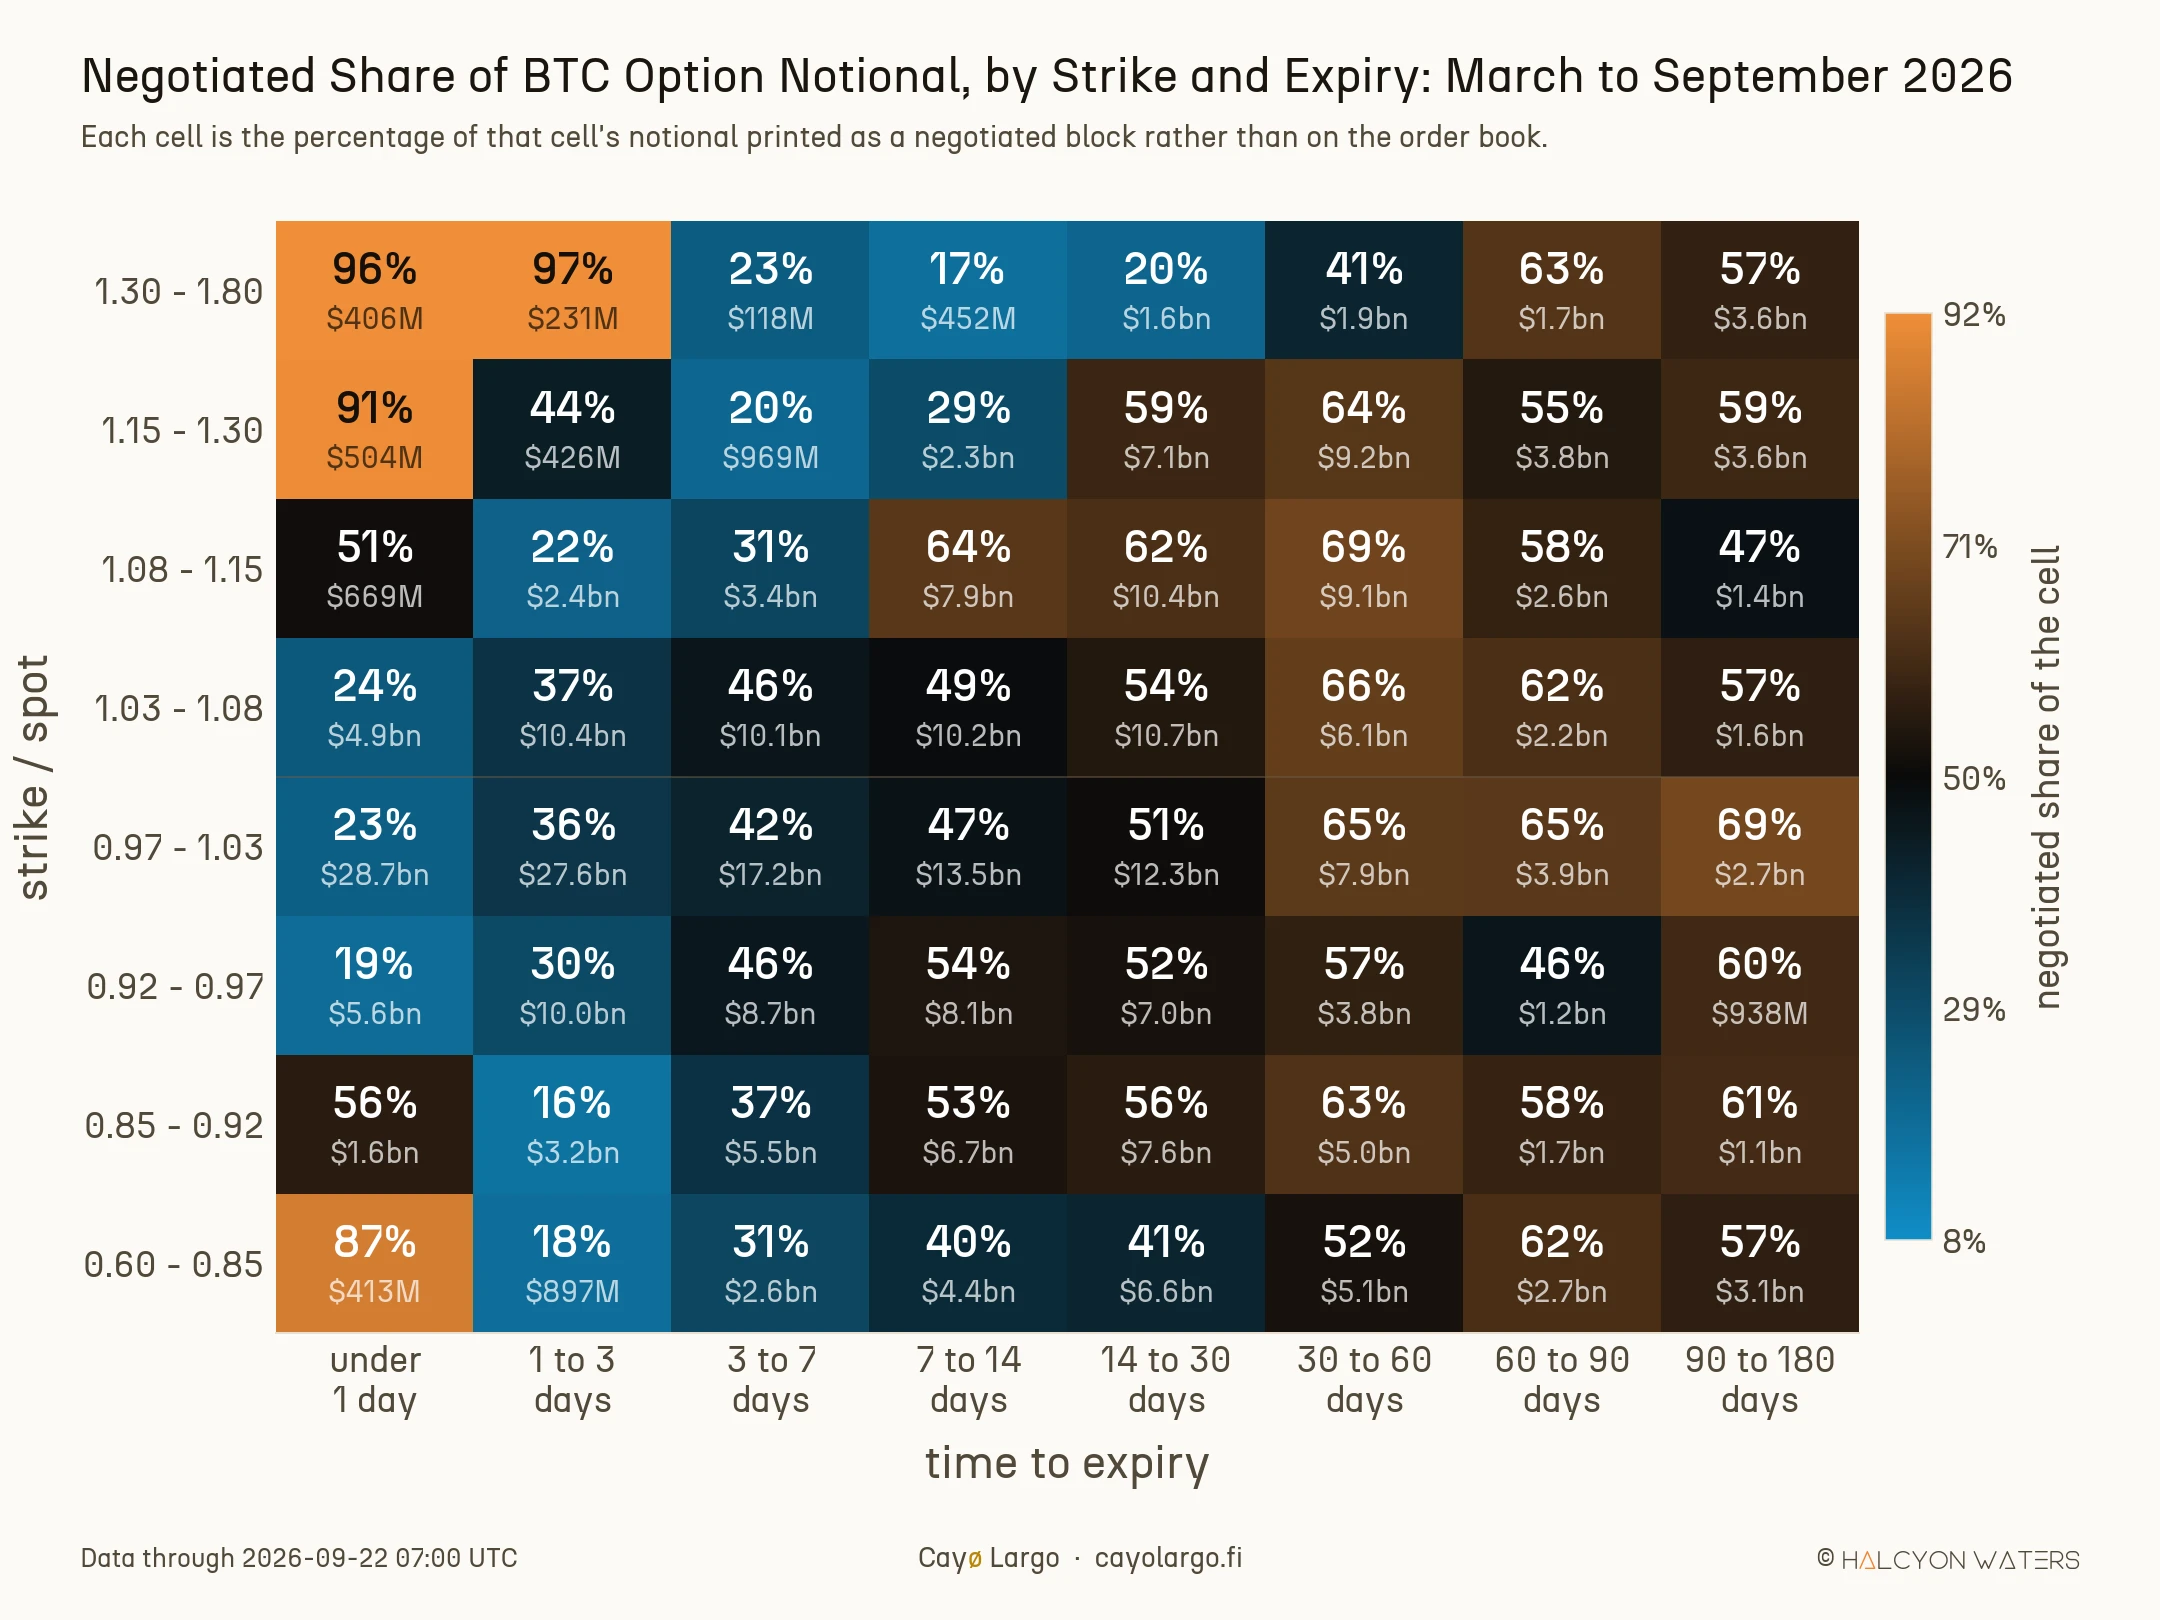
Figure 5: Negotiated share of each cell's notional, blue where the order book carries it and gold where blocks do, with the cell's own notional beneath. Tenor is measured to the 08:00 UTC settlement, the same way Figure 3 measures it, so the two agree: the front column is $42.9bn at 26.3%.
Follow the at-the-money row, the one holding most of the money. It climbs from left to right without a stumble: 23%, 36%, 42%, 47%, 51%, 65%, 65%, 69%. On the day of expiry, roughly a quarter of at-the-money notional is negotiated. Three months out it is better than two thirds. Every step of the way the screen loses ground.
The largest cell on the grid sits at the left of that row: $28.7bn of at-the-money notional inside a day and 77% of it crossed on screen. That is the order book at its best and it is a genuinely large market.
One thing here will mislead you if you read the colour first. The far corners of the under-one-day column are bright gold, 87% to 97% negotiated and they hold $118M to $504M each. A deep out-of-the-money option on expiry day is a lottery ticket nobody quotes, so the few that trade get arranged privately. The percentage is real. The money is not. That is what the small figure in each cell is for.
What the grid does not show is a strike effect. Averaged down the columns the share runs 35% to 60%. Averaged across the rows it barely moves, 45% to 53%. Tenor and size decide the route. The strike does not.
Astronomers know this problem well and they solved it the hard way. You weigh a galaxy by the light it emits, then watch it spin and the rotation makes no sense against the mass you counted. The luminous matter was never the whole galaxy. It was the part that happened to shine.
And the half of this tape that shines is not a random sample of the rest. It is the half that was small enough to do on screen.
How we measured all of this?
Every number above comes from one table, deribit_options_trades, read over BTC, ETH and SOL between 1 March and 21 September 2026. That is 2,966,546 rows. A trade counts as a block when it carries a non-null block_trade_id, which is the exchange's own marker for a negotiated print and block_rfq_id identifies the subset routed through Deribit's own Block RFQ.
The three-row table in The share, coin by coin is the output of one query and here it is unedited. Run it against the archive and it returns those rows: 1,985,960 BTC trades, 33,167 of them blocks, $370.86bn of notional and 46.88% of it negotiated, with the 13.39% Deribit Block RFQ figure quoted earlier in the last column.
SELECT coin,
       count(*)                                                    AS trades,
       count(*) FILTER (WHERE block_trade_id IS NOT NULL)          AS block_trades,
       round(100.0 * count(*) FILTER (WHERE block_trade_id IS NOT NULL)
                    / count(*), 2)                                 AS pct_trades_block,
       round(sum(trade_value_usd)::numeric / 1e9, 2)               AS notional_bn,
       round(100 * sum(trade_value_usd) FILTER (WHERE block_trade_id IS NOT NULL)::numeric
                 / sum(trade_value_usd)::numeric, 2)               AS pct_notional_block,
       round(100 * sum(trade_value_usd) FILTER (WHERE block_rfq_id IS NOT NULL)::numeric
                 / sum(trade_value_usd)::numeric, 2)               AS pct_notional_deribit_rfq
FROM   deribit_options_trades
WHERE  coin IN ('BTC','ETH','SOL')
  AND  trade_timestamp >= '2026-03-01'
  AND  trade_timestamp <  '2026-09-22'
GROUP  BY coin
ORDER  BY notional_bn DESC;
Three things in that query are worth saying out loud, because each one is a place the number could have gone wrong.
The date literals are not decoration. The table is partitioned by month and a literal range lets the planner prune to the seven partitions that matter instead of reading the archive. trade_value_usd is the exchange amount multiplied by the index price at the print and the coin's contract multiplier, which is 1 for BTC and ETH and 10 for SOL. And the block share is a ratio of summed notional, not a mean of per-trade shares. Those are different numbers and only the first one answers "how much of the money".
Swap sum(trade_value_usd) for sum(amount) in the same query and you get the contract-count check quoted earlier, the one that agrees to within 0.6 percentage points. Leg counts come from block_trade_leg_count. Expiry buckets are computed from the instrument's own expiry against the print timestamp, never from a bucket label.
For the execution comparison we required a mark price of at least 0.002 in coin terms, about $170 of premium on Bitcoin, what leaves 1,419,294 Bitcoin trades. Below that floor a single tick is a large percentage and the distribution stops being informative. All execution figures are medians, never means: the tails on this measure are wild enough that a mean is a different statistic about a different question.
What we did not test
A measurement is only as useful as the list of things it does not cover, so here is ours. Six limits, in the order they would bite you.
-
One venue and one window. Deribit, seven months. Whether the share was this high in 2024 is untested and our own archive does not reach back far enough to say. Paradigm's six-year median is the only long history here and it is theirs, not ours.
-
Three coins and one of them thinly. XRP, AVAX and TRX appear nowhere in this note. Their contract multipliers make the dollar notional a different quantity from the one compared here and that deserves its own treatment rather than a footnote. Solana's 341 block trades are enough for a share and not enough for a tenor pattern.
-
Neither measurement observes the counterfactual and this is the real limit on the execution half. The claim a block makes is about what the same size would have cost had it been worked on screen. Nobody observes that: the screen trade of that size did not happen, which is usually why the block exists. Our test compares a block against an order-book trade that did happen in the same option and hour and Paradigm's compares it against a displayed quote too small to fill it. Both are the strongest observable versions of the question. Neither settles it.
-
Distance from mark is not execution quality. The mark is the venue's model value and for a thinly quoted long-dated option it moves less often than the market does. A trade far from mark is not necessarily a bad fill and the measure says nothing about what either counterparty was trying to achieve.
-
A negotiated price is agreed before it prints. We compare a block against the mark at the moment it hit the tape and the terms may have been struck minutes earlier. That is a real limitation on the execution half and it does not touch the share.
-
We did not identify counterparties. Deribit's tape is anonymous, so nothing here says how many desks are behind the 33,167 Bitcoin blocks and it does not name the provider behind any single negotiated print. Paradigm's share is theirs to publish and ours only to corroborate in aggregate.
What to do with this at the desk
The practical consequence is narrow and worth carrying. When you size a position against what you can see in the book, you are sizing against 53% of the Bitcoin market and against 39% of it in the tenor you probably care about most. The rest of it is there. It is available. It is simply not on the screen and it will not come to the screen because you looked harder.
So the honest reading of a thin book is not that the market is thin. It is that you are looking at the part of it that fits in a window.
In short
We split one tape two ways: negotiated against executed, 2,966,546 Deribit trades, three coins, seven months. On Bitcoin, 1.67% of the trades carried 46.9% of the notional and the share never fell below 43.4% in any month. Paradigm, which arranges most of that flow, publishes 42.66% for August where we measure 42.50% and its own six-year median is 27.6%. Blocks are structures, not bets: 89.4% multi-leg, 13 legs on average. On price they are a coin flip against the screen. On size they are 35 times what the book displays. The tenor decides the route, not the strike. And every figure a desk computes off the visible tape is computed on 53% of the Bitcoin market. Plenty left to dig into here.
References
Gavin, Options Trading IQ, 12 December 2014, "The Best Way To Enter Iron Condors". A retail account of why a multi-leg position cannot be filled well leg by leg: you need every leg simultaneously and the market makers will not oblige. The problem Deribit's Block RFQ solves at institutional scale, stated twelve years earlier at four legs and a few thousand dollars.
Deribit and Paradigm, 26 August 2019, "Block Trading for Crypto Derivatives". The launch of the first multi-instrument block-trading workflow on a crypto-derivatives exchange and the clearest statement of its purpose: negotiate away from the order book to reduce slippage and minimise impact on the market price.
P. Pederzoli, H. Doshi and S. A. Sert, around 2025, "Risky Intraday Order Flow and Equity Option Liquidity". Order-flow volatility raises option illiquidity and the effect falls as maturity rises, measured on short-maturity index and single-stock options. The equity-market complement to the tenor pattern in Figure 3.
Paradex, 21 July 2026, "Paradigm's Deep RFQ Liquidity is Coming to Paradex". A 60-day study of how Deribit's volume splits, 12 May to 10 July 2026: the book at roughly 57%, Paradigm at 21%, other block providers at 22%. Also the six-year series we cannot produce, a 27.6% median share for Paradigm since November 2020 that never fell below 12%.
Paradigm, 4 September 2026, "Paradigm Monthly Recap, August 2026". The month our archive is checked against: Deribit's Bitcoin and Ether tape at $62.97bn, blocks at 42.66% of it, Paradigm itself at 20.16%. Carries the execution comparison against top of book, including the single-leg sample where price improvement runs 47.32% and the size multiples that show what the mechanism is really selling.
Frequently Asked Questions
What share of Bitcoin options volume on Deribit is block trades?
Measured across 1,985,960 BTC option trades between 1 March and 21 September 2026, block trades were 1.67% of the trades and carried 46.9% of the notional, $173.86bn of $370.86bn. The share never fell below 43.4% in any month of 2026 or below 28.8% in any hour of the day.
What is a block trade on Deribit?
A block trade is a large options trade negotiated privately between two counterparties and then reported to the exchange for clearing and margining, rather than executed against quotes resting in the public order book. Deribit launched the mechanism with Paradigm in August 2019 and later added its own Block RFQ. It carries a minimum size, so small trades cannot use it.
Do block trades get a better price than the order book?
On price alone it is close to a coin flip and both sides of the market agree. Paradigm's own August 2026 recap reports that 47.32% of single-leg blocks facing a two-sided screen improved on the best displayed price. Measuring independently from Deribit's tape, we find the block is the closer of the two to the exchange mark in 43.9% of matched option-hours. The block's real edge is size: Paradigm reports 70.60% of Bitcoin legs executing above the displayed top-of-book size, at 35.25 times it on average.
What share of Deribit's options volume does Paradigm handle?
Paradigm reported 20.16% of Deribit's $62.97bn Bitcoin and Ether options tape in August 2026 and a 27.6% median share across nearly six years since November 2020, never below 12%. Blocks in total, from every provider, were 42.66% of that August notional on their figures. Our independent reconstruction of the same month's tape gives 42.50%.
Why does the block share rise with time to expiry?
On Bitcoin the share climbs from 26.4% inside one day to 60.9% between one and three months. The near-dated book is deep and continuously quoted, so size can be worked on screen. The longer-dated book is thinner and is where multi-leg structures live and those cannot be filled leg by leg without the market moving between legs.
Related Articles
Deribit Options Execution Slippage: The Exit Costs More
We measured 469,000 Deribit option trades over six months: the buyer fills at mark, the seller gives up 1.4% to 2.9% and the quoted spread predicts neither.
4 Traps Between a Crypto-Options Backtest and a Profit
Four crypto-options signals that shine in backtest and die at real fills. What the spread, the wrong vehicle, overlapping windows and a trending coin cost you.
Which Expiry's Gamma Regime Are You Reading?
At Deribit's daily expiry roll, 90.9% of the changes in BTC's headline gamma regime are the pointer moving to a new contract, not the option book repositioning.