When To Sell Crypto Volatility: Before Or After It Drops?
One September week brought two timing rules for crypto options: Thalex said buy volatility on Saturday mornings, others postulated to sell it only after it has dropped. On twelve months of Deribit data, Saturday buying saves very little. Selling into rising volatility lost 33.7 volatility points or more on one sale in ten; waiting for it to fall cut that to 6.1 volatility points.
Recently, two posts appeared on X a day apart (mid-Sep 2026) and both were about timing. On 17 Sep Imran Lakha (2026) argued that the safer time to sell vol is after it has already dropped, conceding that it sounds the wrong way round. The next day Thalex (2026), the crypto-options venue, wrote in a reply under a post on Bitcoin calls that Saturday morning to noon UTC tends to give the best implied volatility entries of any point in the week. They suggested it as the moment to pick up 2026 Oct to Dec calls. One rule is about the calendar, the other about the state of the market. Both are the kind of advice that travels far without anyone checking what it carries within.
We checked both against Cayø Largo's database. Both hold up but not equally. Buying 30-day Bitcoin volatility late on a Saturday morning saved about 1/3 of a volatility point against the rest of the same week. Timing a sale by the state of the market mattered far more. Selling 7-day volatility while it was high and still rising lost 33.7 volatility points or worse on one day in ten. Selling it after it had already come off lost 6.1 vol pts at the same odds and the average sale improved from -0.41 to +7.08 vol pts.
Let's begin with the "calendar rule", since it is the smaller of the two and quick to settle. Then we will look at what a volatility seller is actually paid for. We sort every day in our database into two kinds of sale, follow both through the February 2026 crash and measure what each one kept. We finish with the reason it works and the places where it stops working.
If you already sell volatility for a living, you can skip straight to What did each sale keep? section below.
Is Saturday the cheapest time to buy?
Thalex's rule was about October to December calls, roughly six weeks to three months out. We therefore looked at the fixed 30-day and 60-day at-the-money implied volatility (ATM IV) at 10:50 UTC, inside their Saturday window, on every day for twelve months. There is one difficulty. Implied volatility drifts for weeks at a time and a pattern across the days of the week is easily lost in that drift, or invented by it. To avoid both, we measure each reading against the average of the same tenor over the seven days around it. We call that distance the weekly deviation . It is the only quantity the Saturday test uses:
where is the fixed-tenor ATM IV at 10:50 UTC on day and is how far that day sits above or below its own week. Saturday's is then compared with the average of the other days in the same calendar week, 55 weeks per coin (43 for the 60-day tenor on SOL and XRP, whose 60-day quotes start later).
| Coin | 30-day, Saturday vs its week | Weeks cheaper | p | 60-day, Saturday vs its week | p |
|---|---|---|---|---|---|
| BTC | -0.34 | 67.3% | 0.037 | -0.15 | 0.162 |
| ETH | -0.43 | 70.9% | 0.032 | -0.23 | 0.097 |
| SOL | -0.38 | 58.2% | 0.135 | -0.17 | 0.516 |
| XRP | -0.12 | 70.9% | 0.760 | +0.14 | 0.764 |
Volatility points, 10:50 UTC readings from 30 August 2025 to 22 September 2026; p is the two-sided p-value of the week-paired test. Thalex has a point. It holds on the two books most traders have in mind. On Bitcoin and ETH, Saturday late morning is the cheapest 30-day reading of the week. It came in below the rest of its week in about two weeks out of three. The discount does not last long either. By Sunday it has gone and Sunday turns out to be the dearest day of the week on both coins.
The size is what to keep in mind. A third of a volatility point on a 30-day Bitcoin ATM IV that averaged 41.1% over the year is less than 1% of the premium. At 60 days it halves and we can no longer tell it apart from noise. On SOL and XRP it does not show up reliably at either tenor. In other words, a buyer who waits for Saturday saves a little. Only a little. As we are about to see, a seller who waits for the right state of the market is paid about twenty times more.
What is a volatility seller paid for?
A trader who sells an at-the-money straddle, namely a call and a put on the same strike, collects a premium and hedges away the direction of the coin. What is left is a single bet. The option was priced at some implied volatility and the seller wins if the coin then moves less than that. How much it actually moved is measured after the fact as realized volatility, hereafter RV, over the same seven days, i.e. the 7-day RV:
where is Deribit's index price at the -th ten-minute mark after the sale and is the number of ten-minute returns in the following seven days, 1,008 when none are missing. The seller's edge on a given sale is simply the gap between the two:
where is the 7-day ATM IV at the moment of the sale. A positive edge means the seller was paid. It is expressed in volatility points and a delta-hedged straddle earns roughly in proportion to it.
On most days the edge is positive and by a fair margin. Amberdata's four-year study of Bitcoin found 30-day IV above the 30-day RV that followed nearly 70% of the time. Across our 1,622 sales on five Deribit coins the seller was paid on 66.3% of days with a median edge of +4.15 points.
The trouble shows up in the average, which is only +0.59 points, barely above zero. Many small wins are cancelled by a few large losses. The distribution has a skew of -2.32, the familiar shape of any short volatility book. Cryptarbitrage (2025) described the practical danger well in a Deribit backtest of short weekend strangles. A strategy with this shape can get through a short backtest without meeting its left tail and the sample then makes it look better than it is. A seller lives on the typical week but survives or not on the bad ones, which is why the rest of this note looks at the tail first.
Two ways to sell a high reading
We call a reading high when the 7-day ATM IV sits in the top 30% of its own previous 30 days. The original argument used the 70th percentile as its example. We kept it. Each high reading is then split according to what ATM IV did over the three days before:
where is the share of the previous 30 daily readings below today's and and are today's 7-day ATM IV and the one three days earlier. Every other day counts as not high. About one sale in four, 26.1%, lands in one of the two high states.
To see what the split looks like in practice, here is Bitcoin through the crash of early February 2026, with one sale a day at midnight UTC.
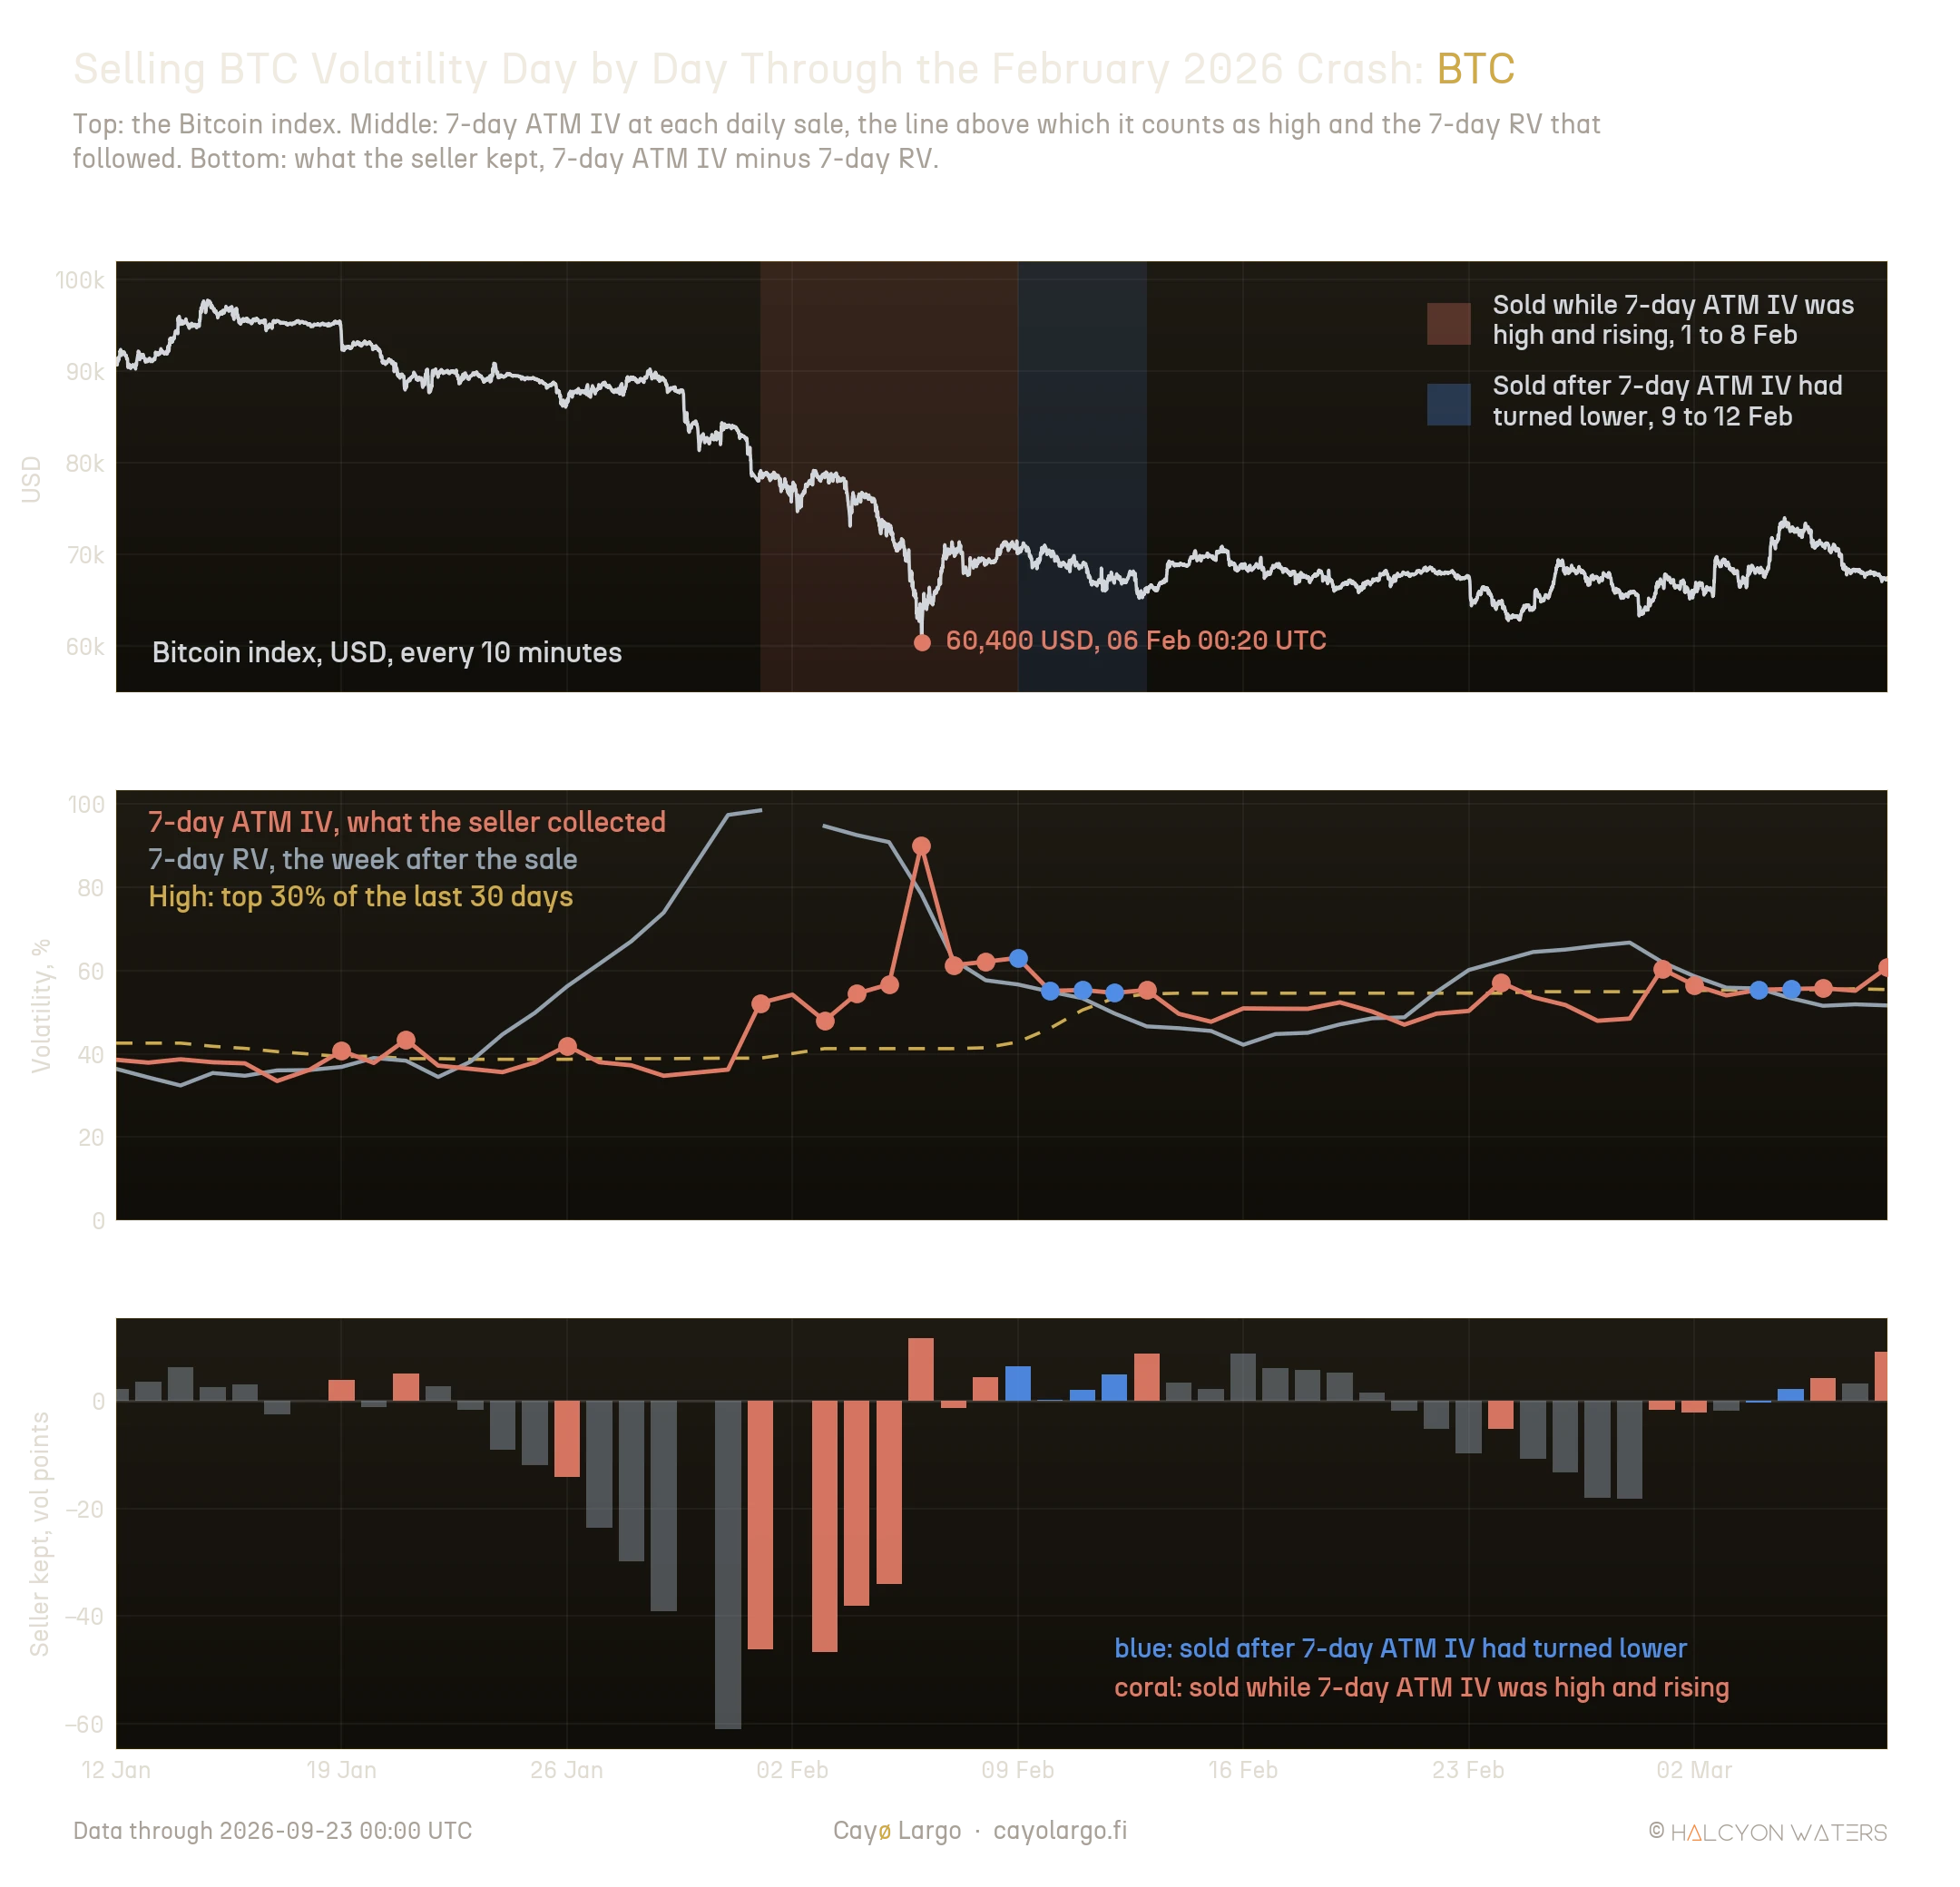
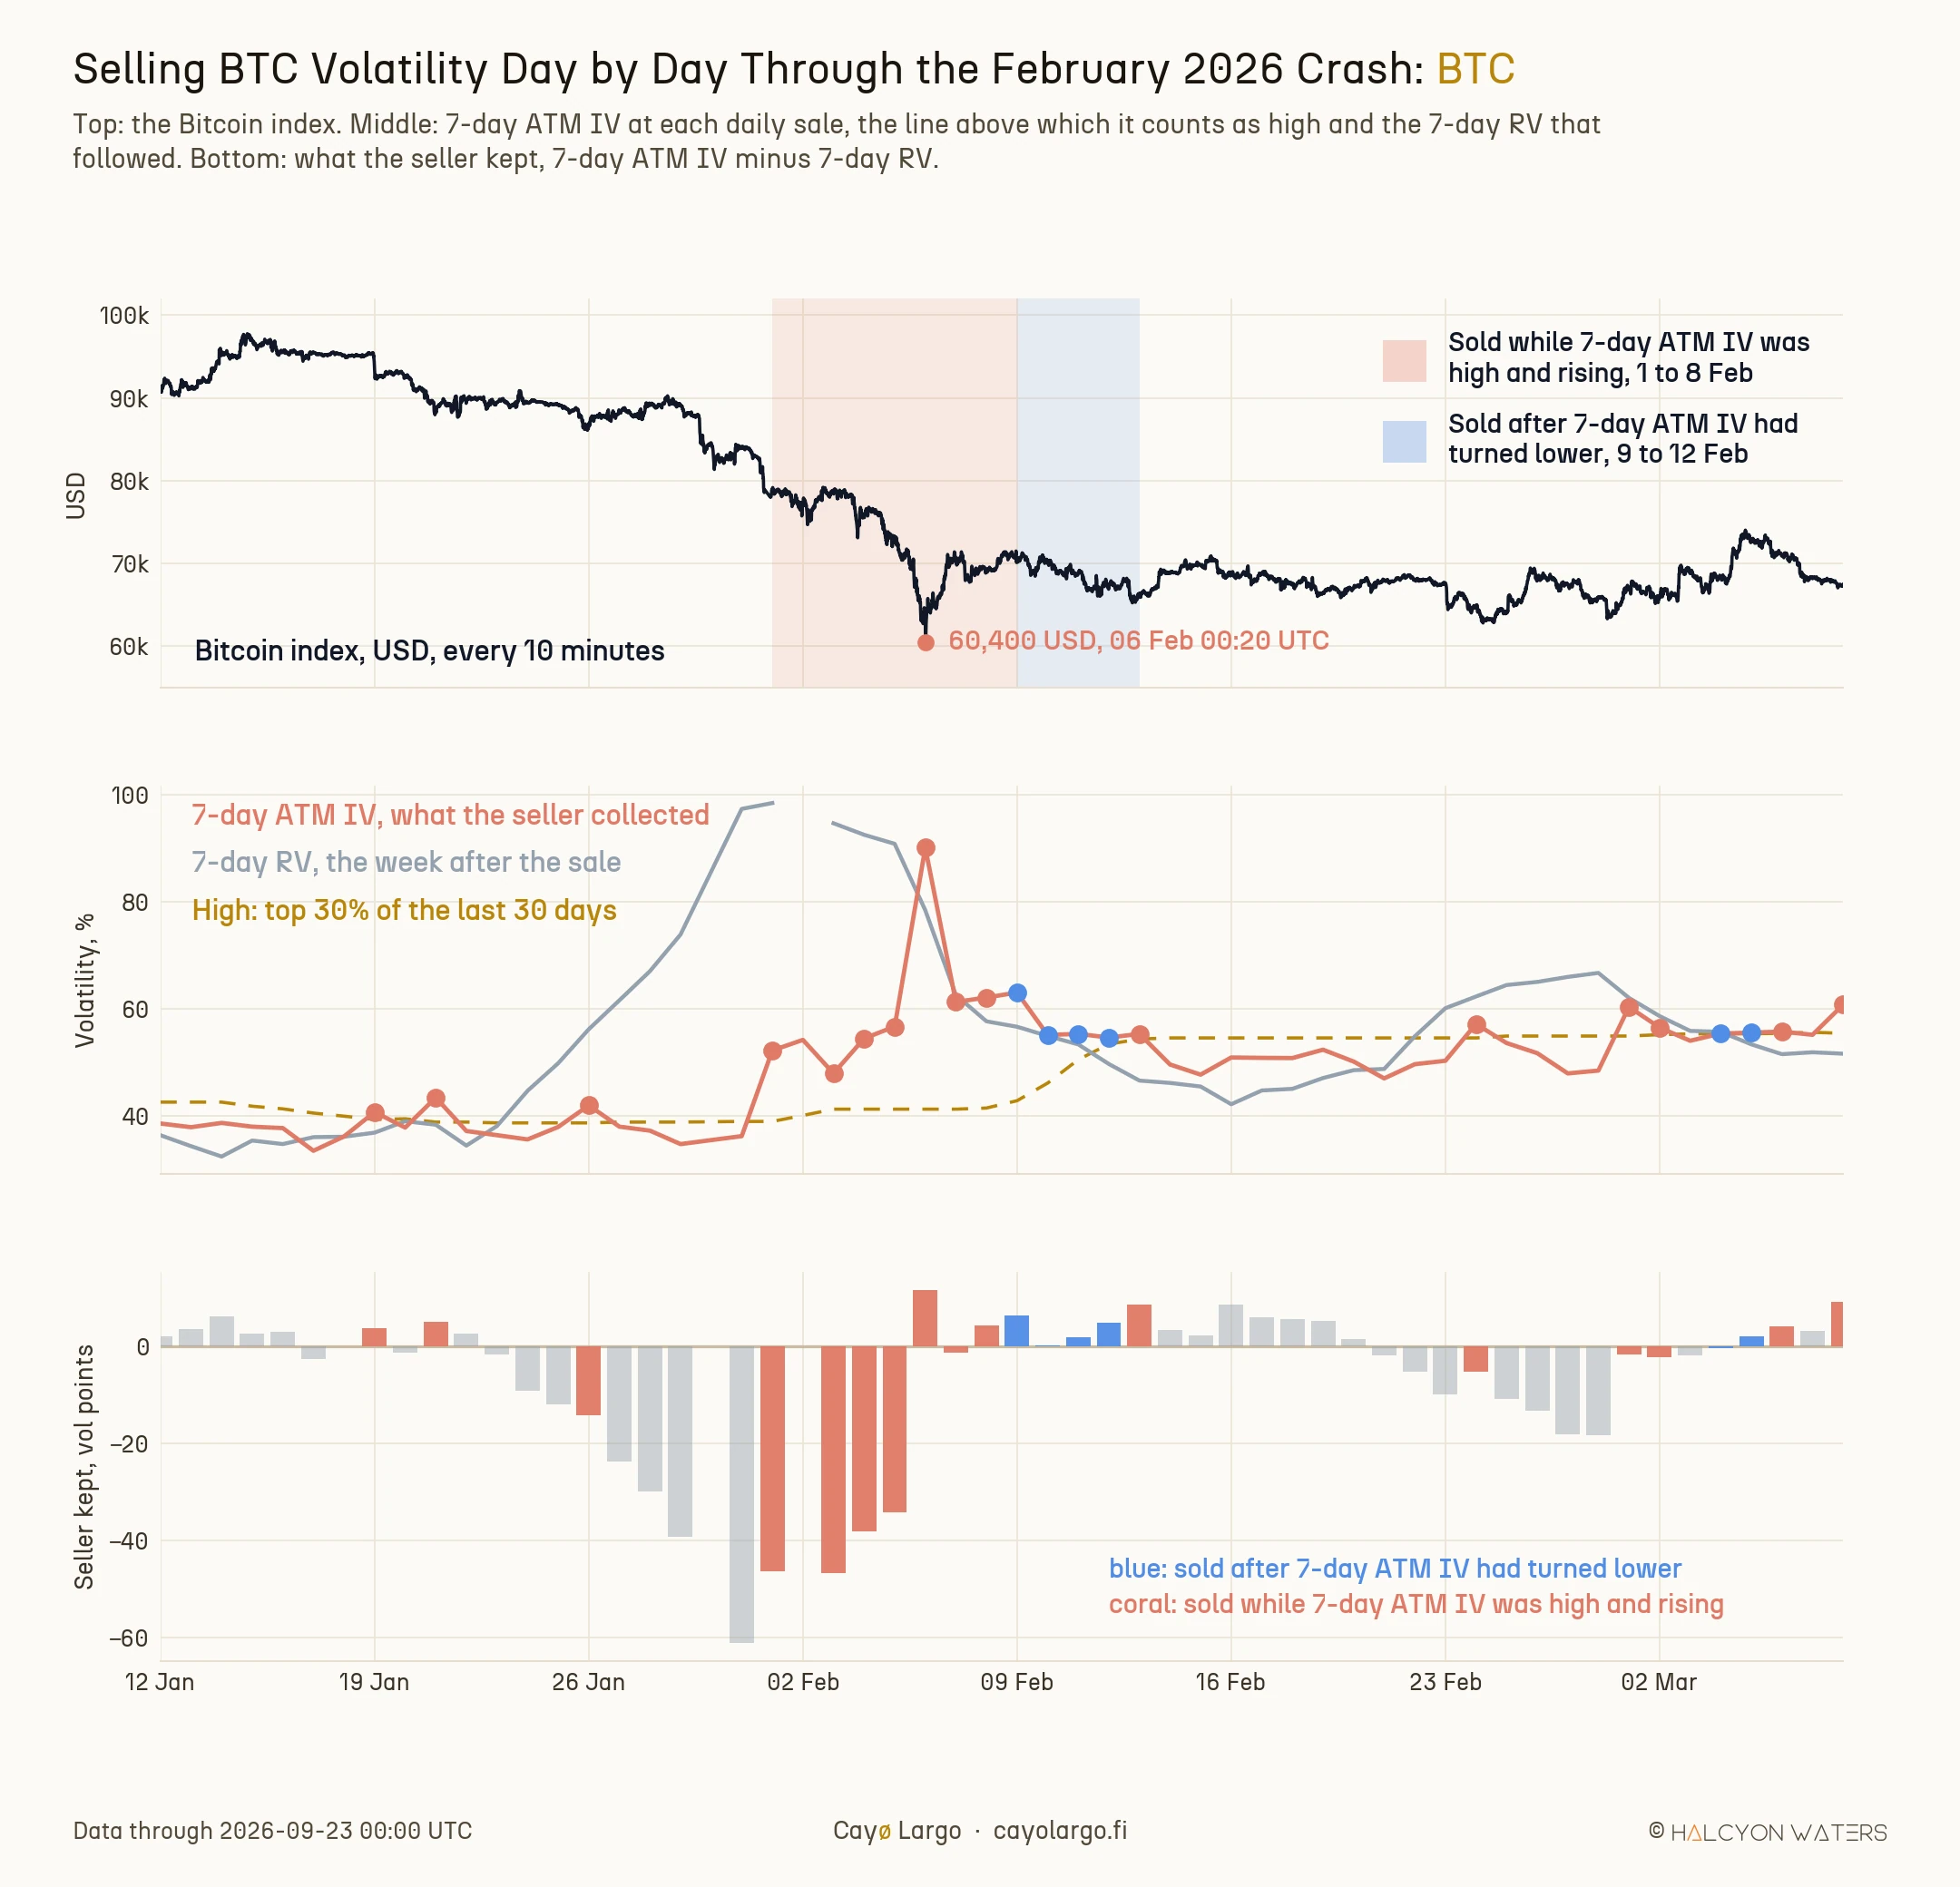
Figure 1: Bitcoin through the February 2026 crash. Top: the Bitcoin index, which touched 60,400 USD on 6 February. Middle: 7-day ATM IV against the 7-day RV that followed, with coral marking sales made while implied was high and still rising and blue marking sales made after it had already come off. Bottom: what each sale kept.
At the time, both sales looked reasonable. On 1 February implied jumped to 52.2%, far above anything seen in the previous month. It kept climbing for about a week. The first four sales in that run each lost between 34.1 and 46.7 points, because the 7-day RV that followed ran well above 90%. From 9 February implied was still high but had started to come down. All four sales made from 9 to 12 February were paid, between +0.2 and +6.4 points. The book and the regime were the same. Only a few days separated the two groups of sales.
What did each sale keep?
A single episode proves very little. Here is every sale in the archive, 1,622 of them across BTC, ETH, SOL, XRP and AVAX, sorted by the state of implied at the moment of the sale.
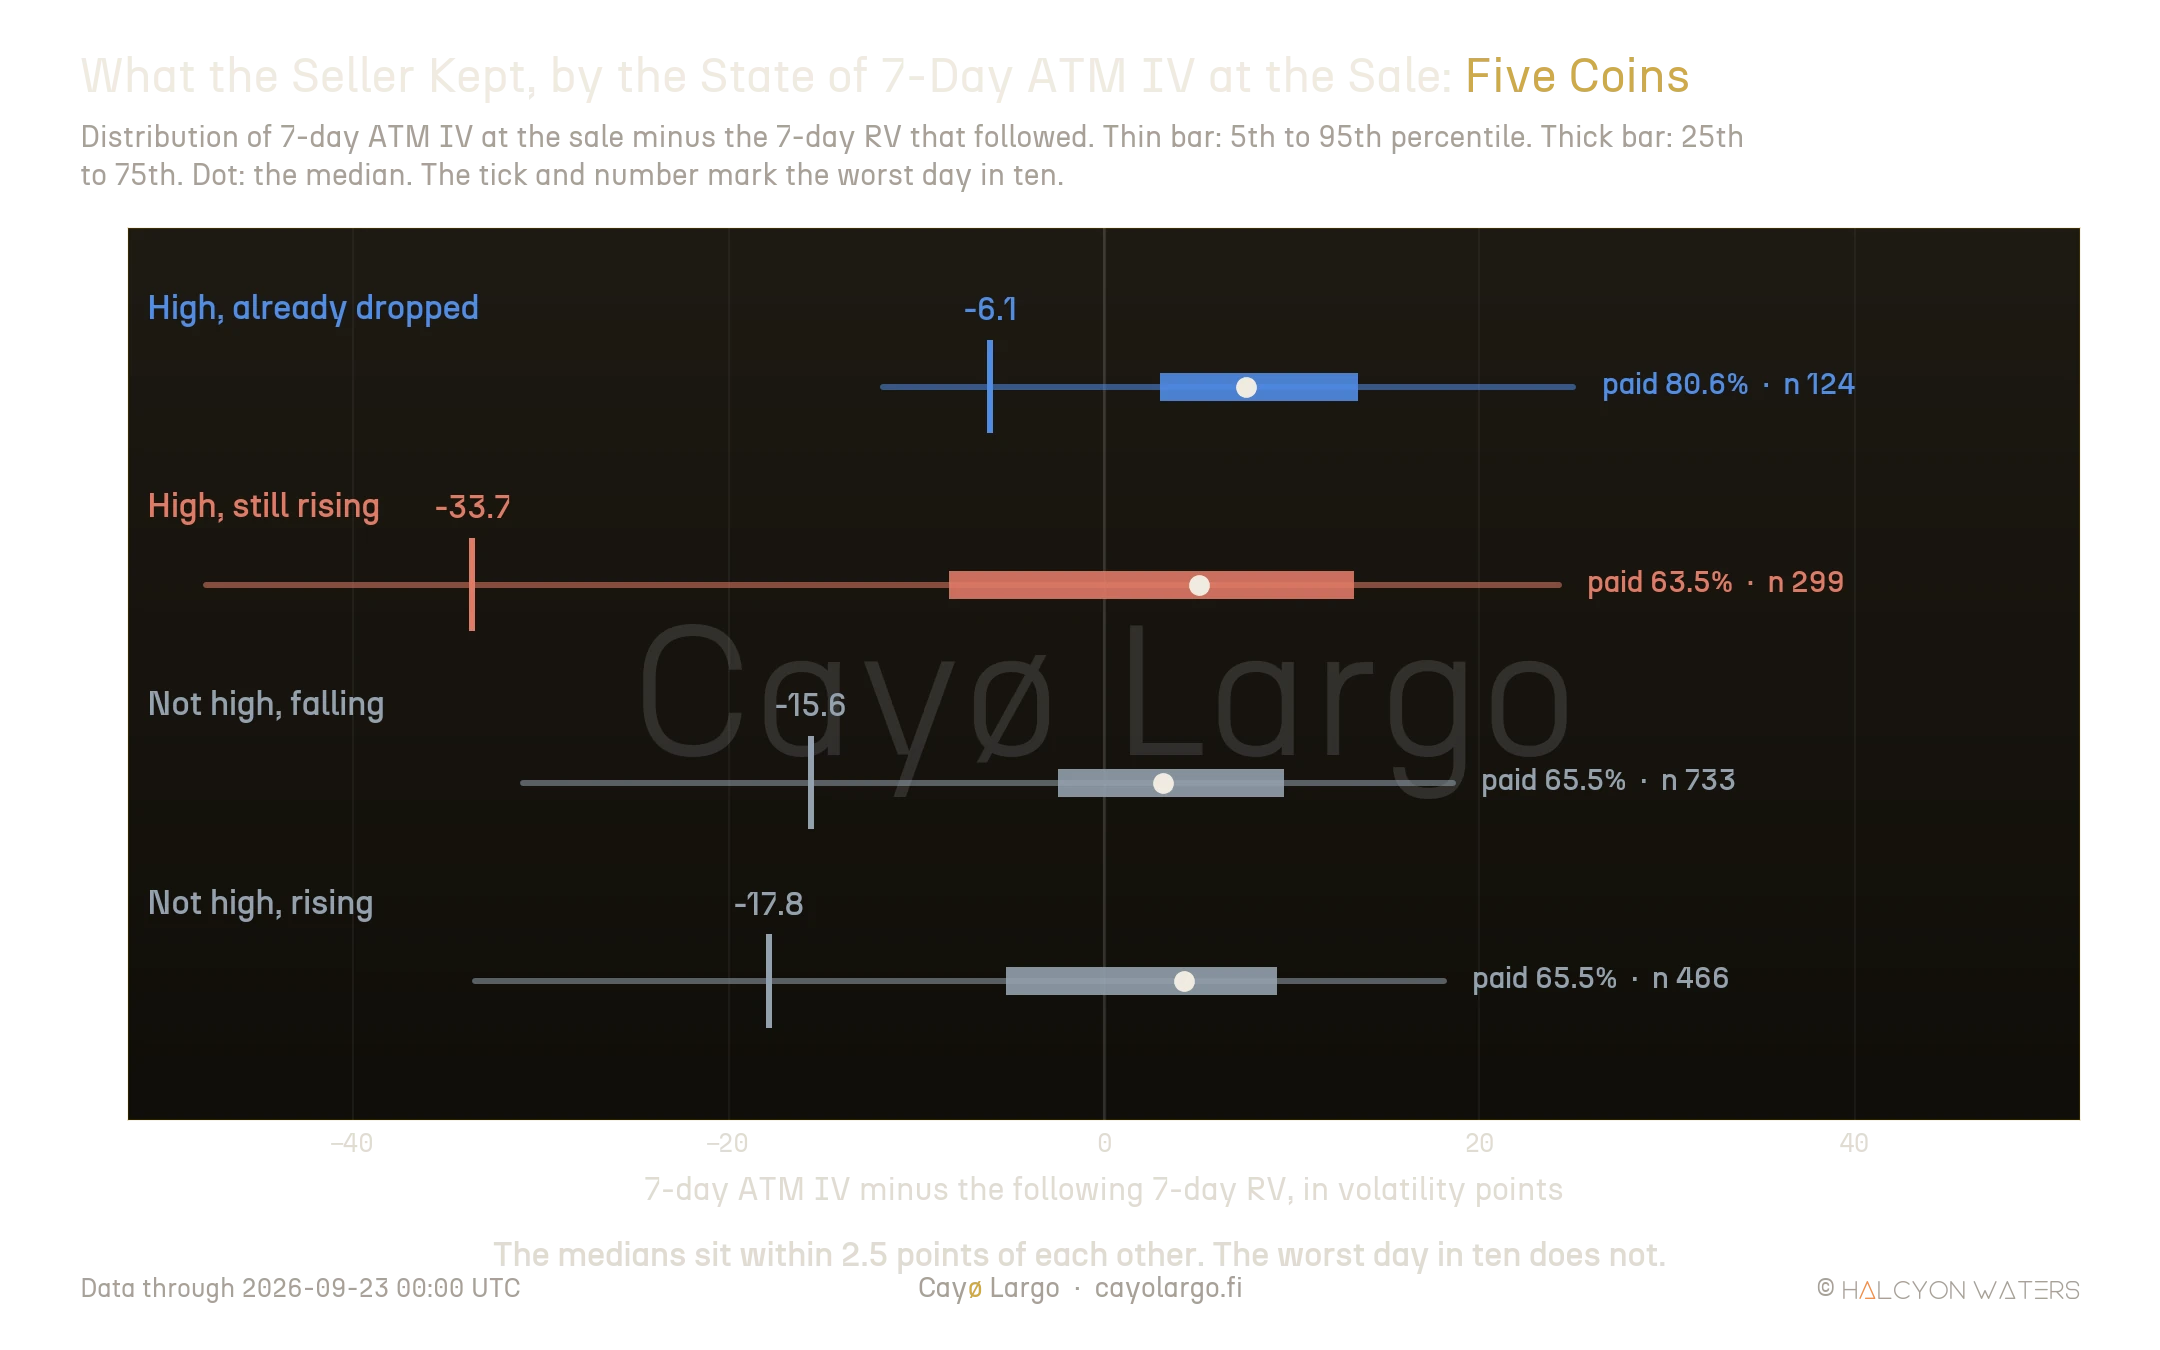
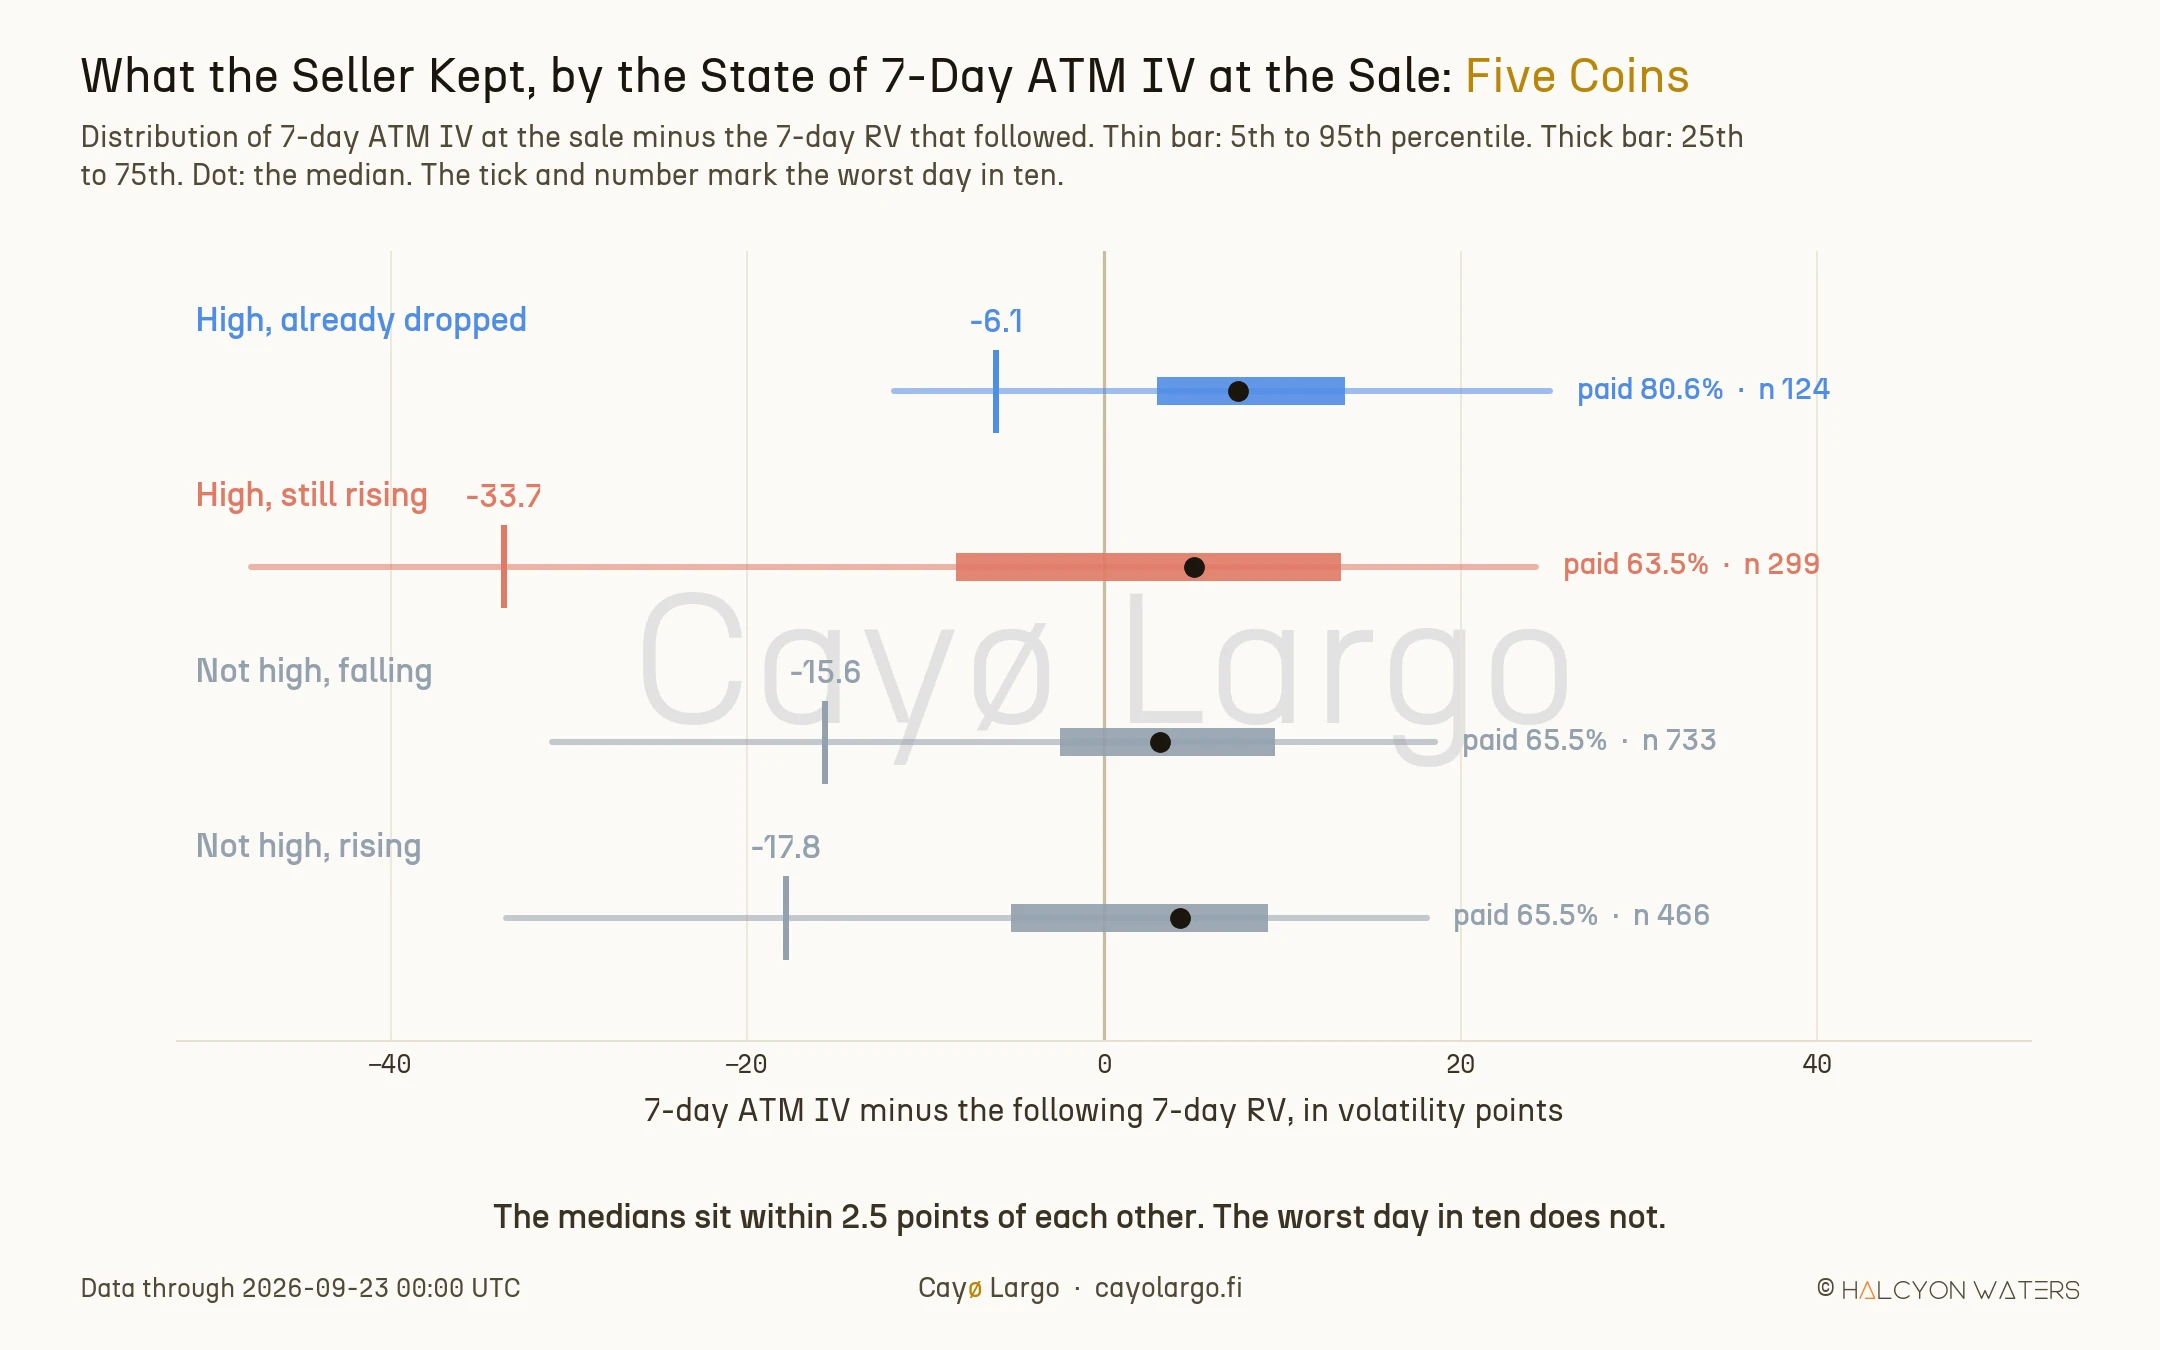
Figure 2: What the seller kept, by state at the sale. The typical sale was paid in every state; the worst day in ten was not.
| State at the sale | Sales | Seller paid | Median | Average | Worst 1 in 10 | Worst 1 in 20 |
|---|---|---|---|---|---|---|
| High, still rising | 299 | 63.5% | +5.1 | -0.4 | -33.7 | -47.8 |
| Not high, rising | 466 | 65.5% | +4.2 | -0.4 | -17.8 | -33.5 |
| Not high, falling | 733 | 65.5% | +3.1 | +0.5 | -15.6 | -30.9 |
| High, already dropped | 124 | 80.6% | +7.5 | +7.1 | -6.1 | -11.8 |
Edges are in volatility points. Three things stand out.
The typical sale looks much the same in every state. Medians run from +3.1 to +7.5 points, so a seller who judged the trade by how it usually goes would see no reason to wait.
The tail looks very different. Selling while implied was high and still rising put one day in ten at -33.7 points or worse, about twice as bad as selling on an ordinary day. Selling after it had already come off put the same day at -6.1. The seller who waited was also paid more often, on 80.6% of days against 63.5%.
High and still rising turns out to be the worst state in the archive, not an ordinary one. Its average edge is below zero and its tail is the longest of the four. On this evidence, the volatility that looks most expensive is the volatility most likely to be underpriced. The same practitioner made a similar case in a longer essay, that high IV is only expensive if RV does not keep up, using silver and crude oil as his examples. Our archive lets us measure it.
Why does waiting work?
The explanation is simple. It appears as soon as we add the 7-day RV of the week before each sale.
| State at the sale | 7-day ATM IV at sale | 7-day RV, week before | 7-day RV, week after |
|---|---|---|---|
| High, still rising | 67.1% | 69.3% | 67.5% |
| High, already dropped | 69.6% | 88.3% | 62.5% |
These are averages over each state. When implied had already come off, the storm was already behind it. The 7-day RV was 88.3% in the week before and 62.5% in the week after, a median fall of 25.4 points per sale. When ATM IV was still rising, the realized move was still arriving. It ran at 69.3% before the sale and 67.5% after, roughly level with the implied the seller collected.
There is a twist here worth keeping. On the days that paid best, implied sat well below the volatility of the week just gone, 69.6% against 88.3%. Compared with the trailing 7-day RV, volatility looked cheap. Yet those were the best days to sell. The trailing comparison describes a storm that has already passed, while the seller is paid on a week that has not happened yet.
Twelve months, coin by coin
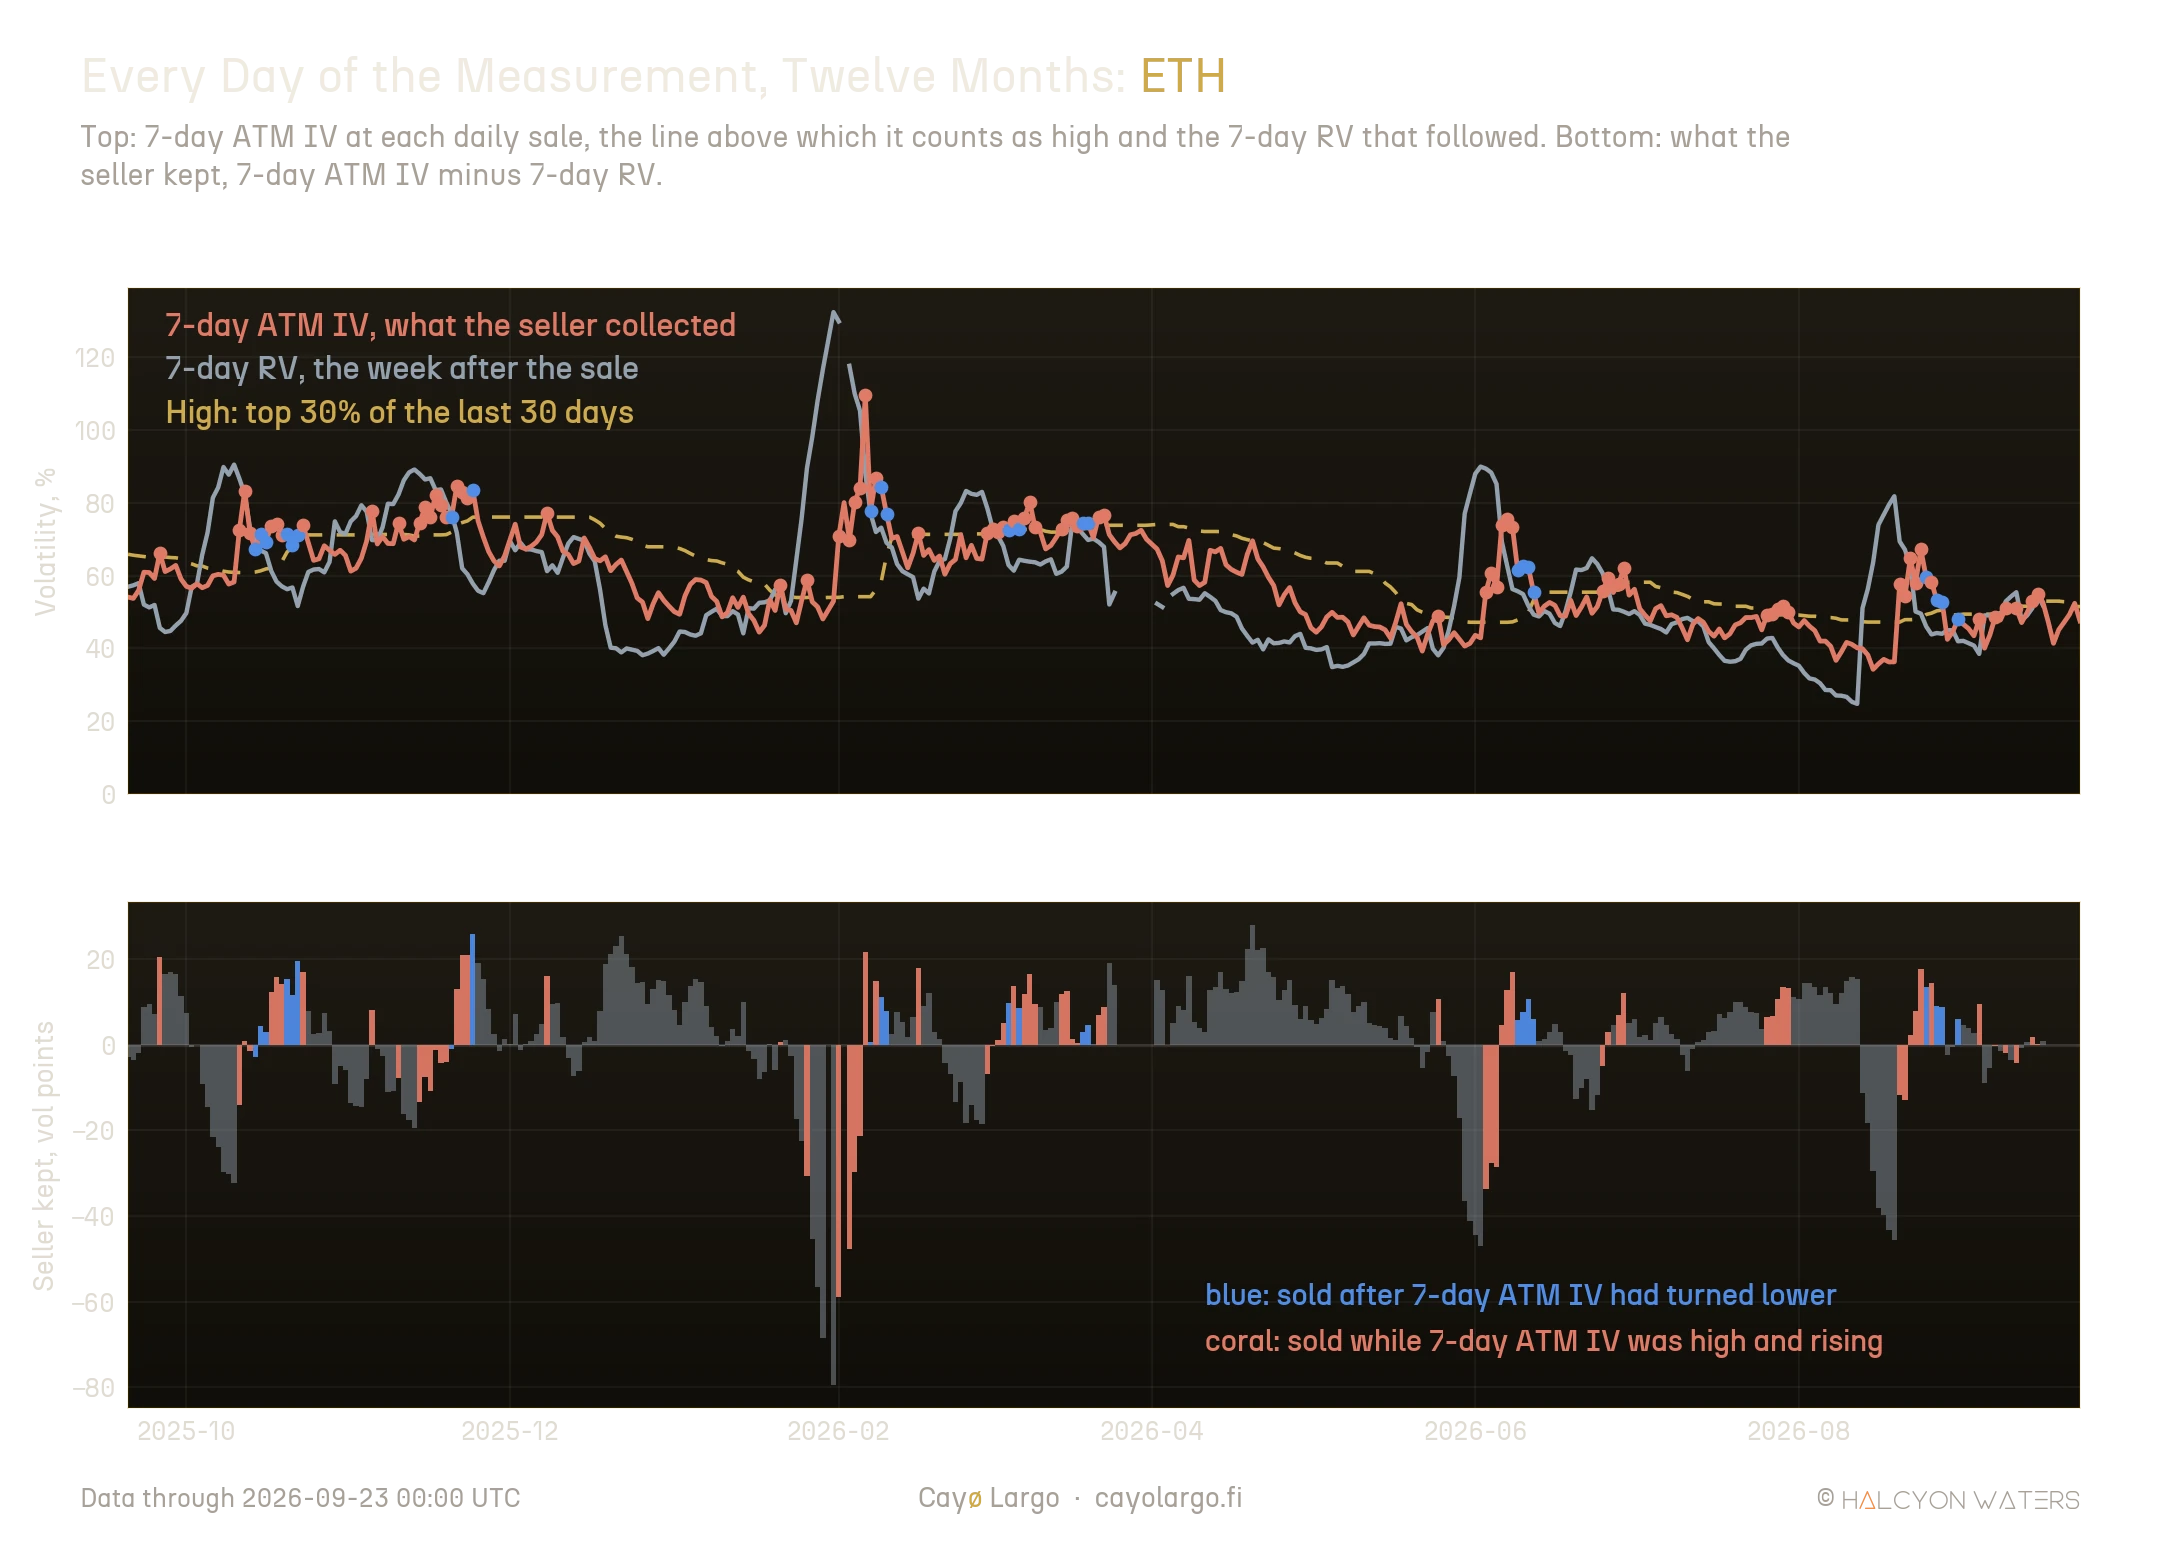
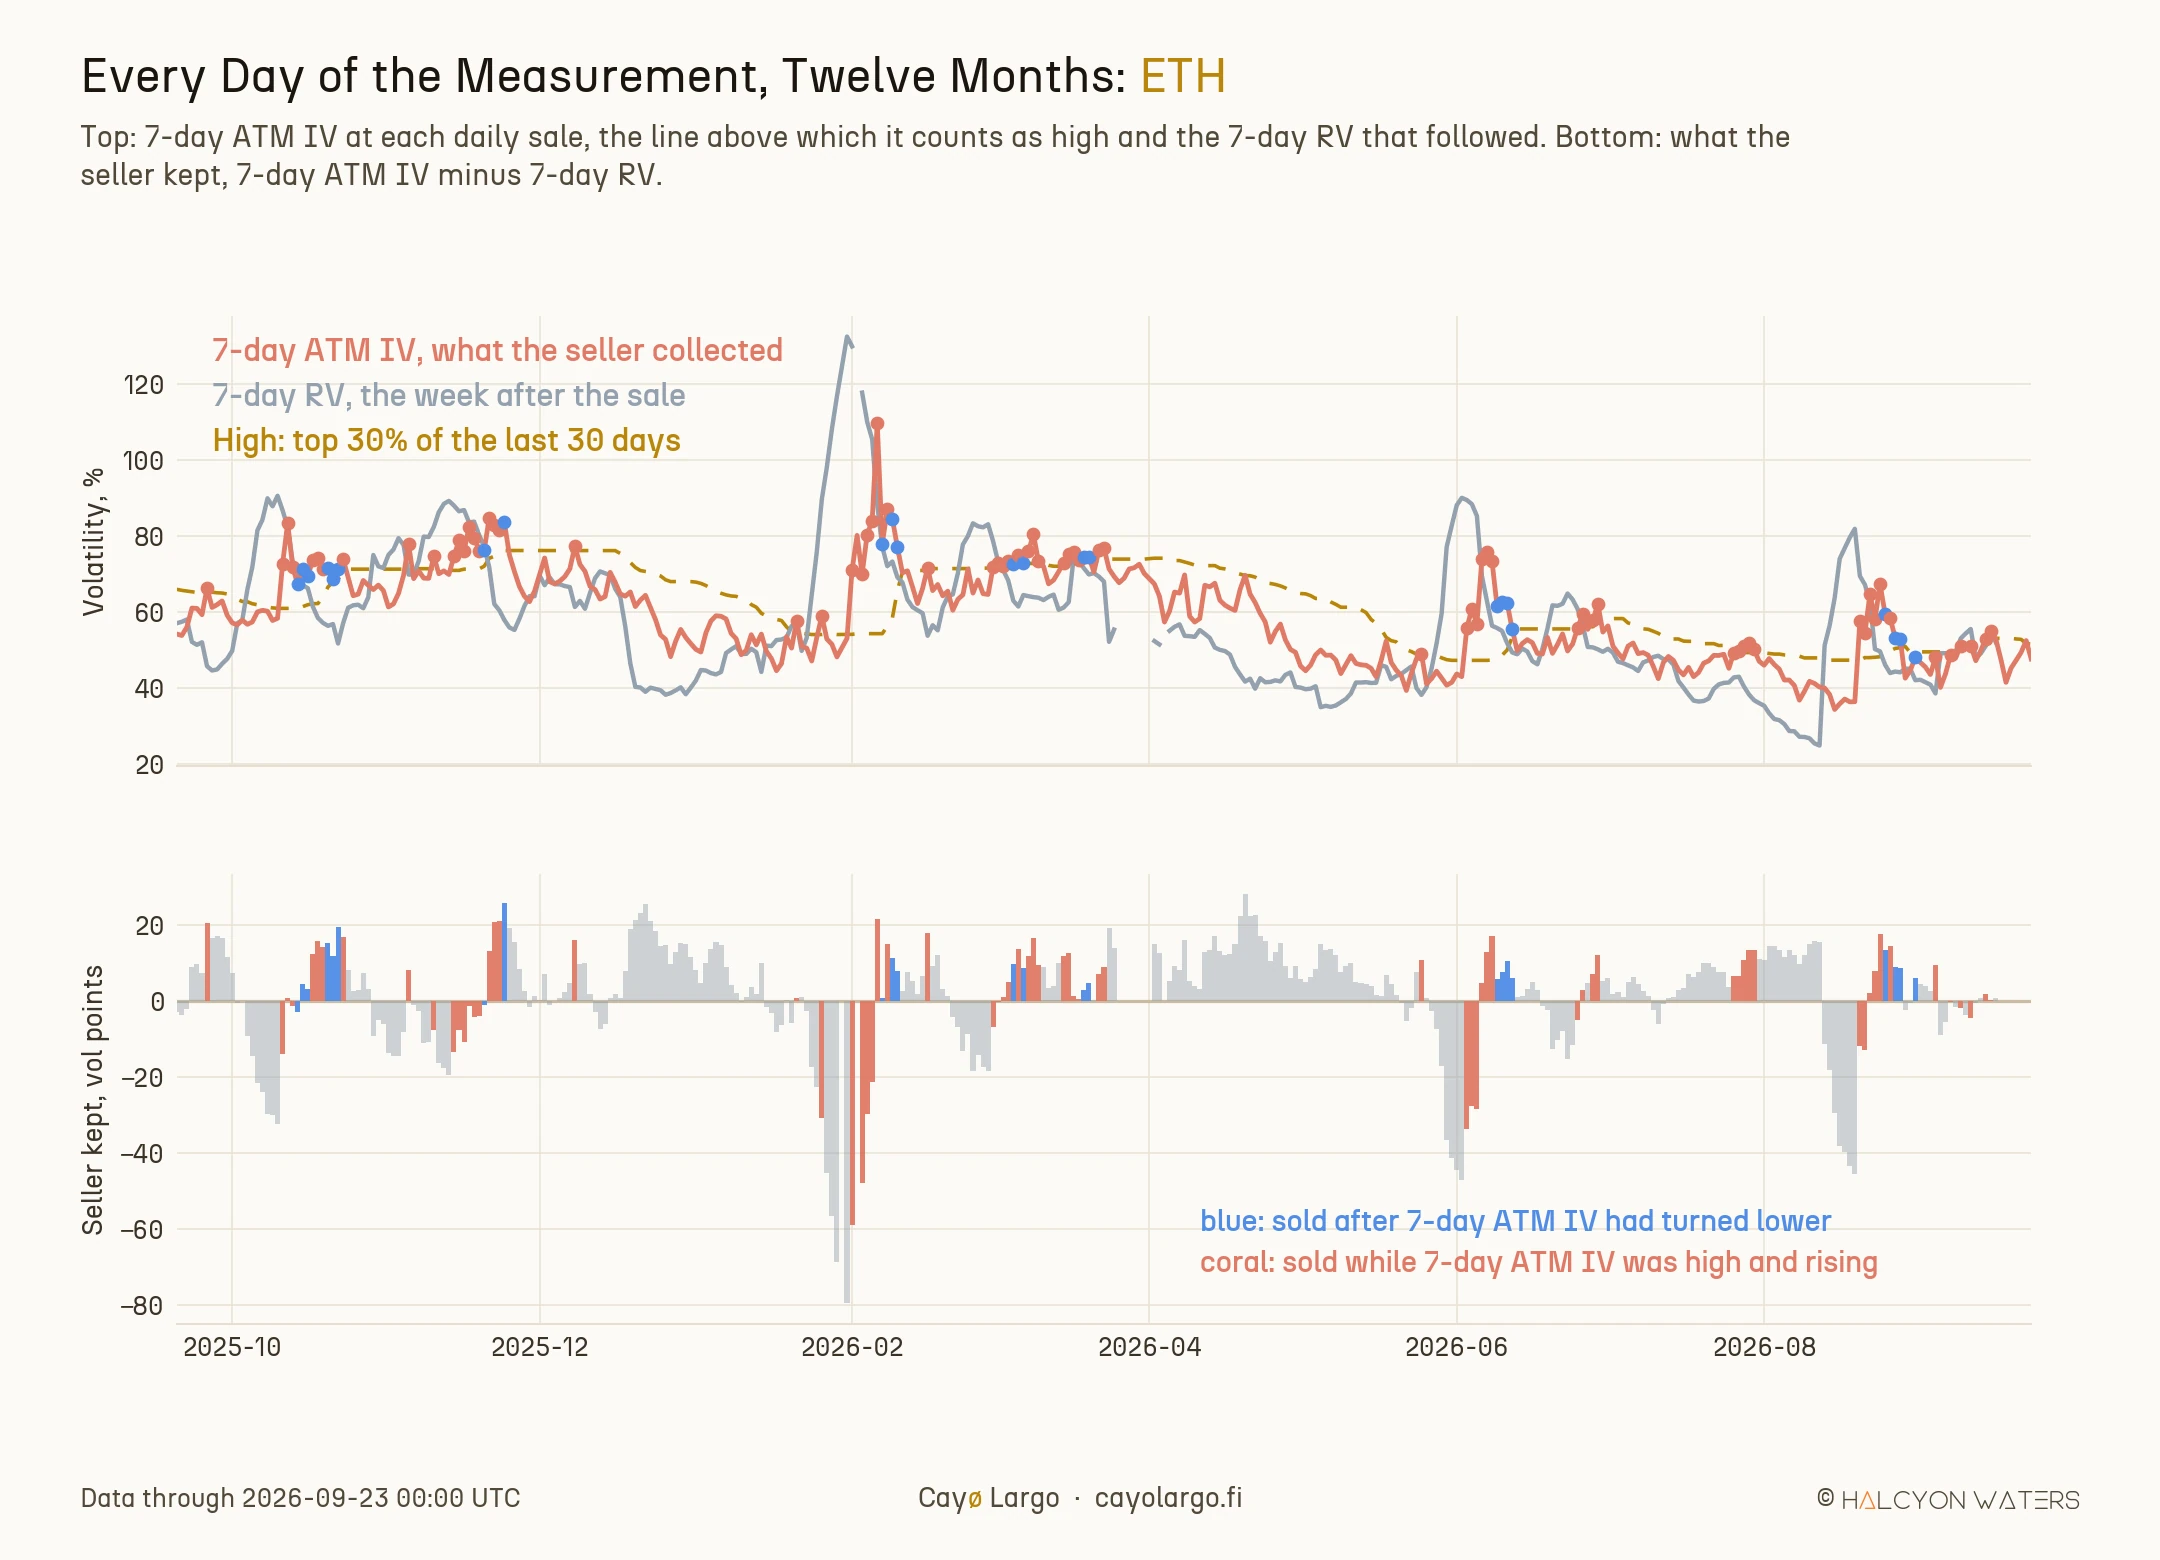
Figure 3: Every daily sale on ETH over twelve months. The deep coral losses sit at the front of each volatility spike; the blue sales sit on its far side.
| Coin | Sales, rising / dropped | Paid, rising | Paid, dropped | Worst 1 in 10, rising | Worst 1 in 10, dropped |
|---|---|---|---|---|---|
| BTC | 79 / 22 | 63.3% | 68.2% | -14.5 | -10.2 |
| ETH | 71 / 23 | 64.8% | 91.3% | -21.3 | +1.2 |
| SOL | 53 / 29 | 64.2% | 75.9% | -41.1 | -8.3 |
| XRP | 51 / 34 | 64.7% | 88.2% | -46.7 | -1.8 |
| AVAX | 45 / 16 | 60.0% | 75.0% | -51.4 | -10.9 |
All five coins point in the same direction, both in the share of sales paid and in the tail. The effect is weakest on Bitcoin, where the tail improves by 4.3 points. It is strongest on the thinner books, where selling into a rising spike was most dangerous: 41.1 points or worse on SOL, 46.7 on XRP and 51.4 on AVAX. On ETH, the worst day in ten among the sales that waited was still a small gain.
Does it survive other choices?
A 70% threshold, a three-day window and a sale at midnight are all choices. A result that depends on them is closer to a coincidence than to a finding, which is why we re-ran the comparison under nine different sets of rules. The intervals come from resampling whole calendar weeks with replacement, 4,000 times, so neighbouring days that share much of their outcome are never counted as independent evidence.
| Rules | Worst 1 in 10, gain from waiting | Average day, gain from waiting |
|---|---|---|
| Main rules | +24.1 +3.7 to +41.6 | +7.1 +2.1 to +12.9 |
| Sale at 10:50 UTC | +33.6 +6.4 to +52.5 | +10.8 +4.2 to +18.4 |
| High = top 50% | +16.3 +3.8 to +35.0 | +5.5 +1.4 to +9.9 |
| High = top 40% | +21.5 +4.2 to +40.1 | +6.9 +2.5 to +12.3 |
| High = top 20% | +27.1 +3.4 to +42.9 | +6.6 +0.3 to +14.0 |
| 5‑day change | +26.0 +5.1 to +41.7 | +8.0 +3.5 to +12.7 |
| 1‑day change | +16.1 -7.7 to +32.4 | +5.0 +0.1 to +10.3 |
| 30‑day option | +7.5 +1.0 to +15.2 | +3.0 -0.3 to +7.1 |
| 30‑day option, 10:50 UTC | +7.8 -0.5 to +18.0 | +2.2 -1.8 to +6.8 |
Volatility points, "already dropped" minus "still rising", with the 90% interval beneath each figure. The main rules are the ones used everywhere else in this note: 7-day options, high meaning the top 30%, a 3-day change, a sale at 00:00 UTC. On seven-day options the tail gain clears zero under every rule but one. The exception is instructive: a single day of falling implied is not yet confirmation, while a three-day or five-day fall is. The practitioner's advice was to watch it drop first and the data suggests the drop needs to have lasted a few days.
On 30-day options the gain shrinks to about a third and sits at the edge of chance. That is what the mechanism would predict. A seven-day option lives almost entirely inside the storm or after it, while a 30-day option lives through both.
Where the books sit this morning?
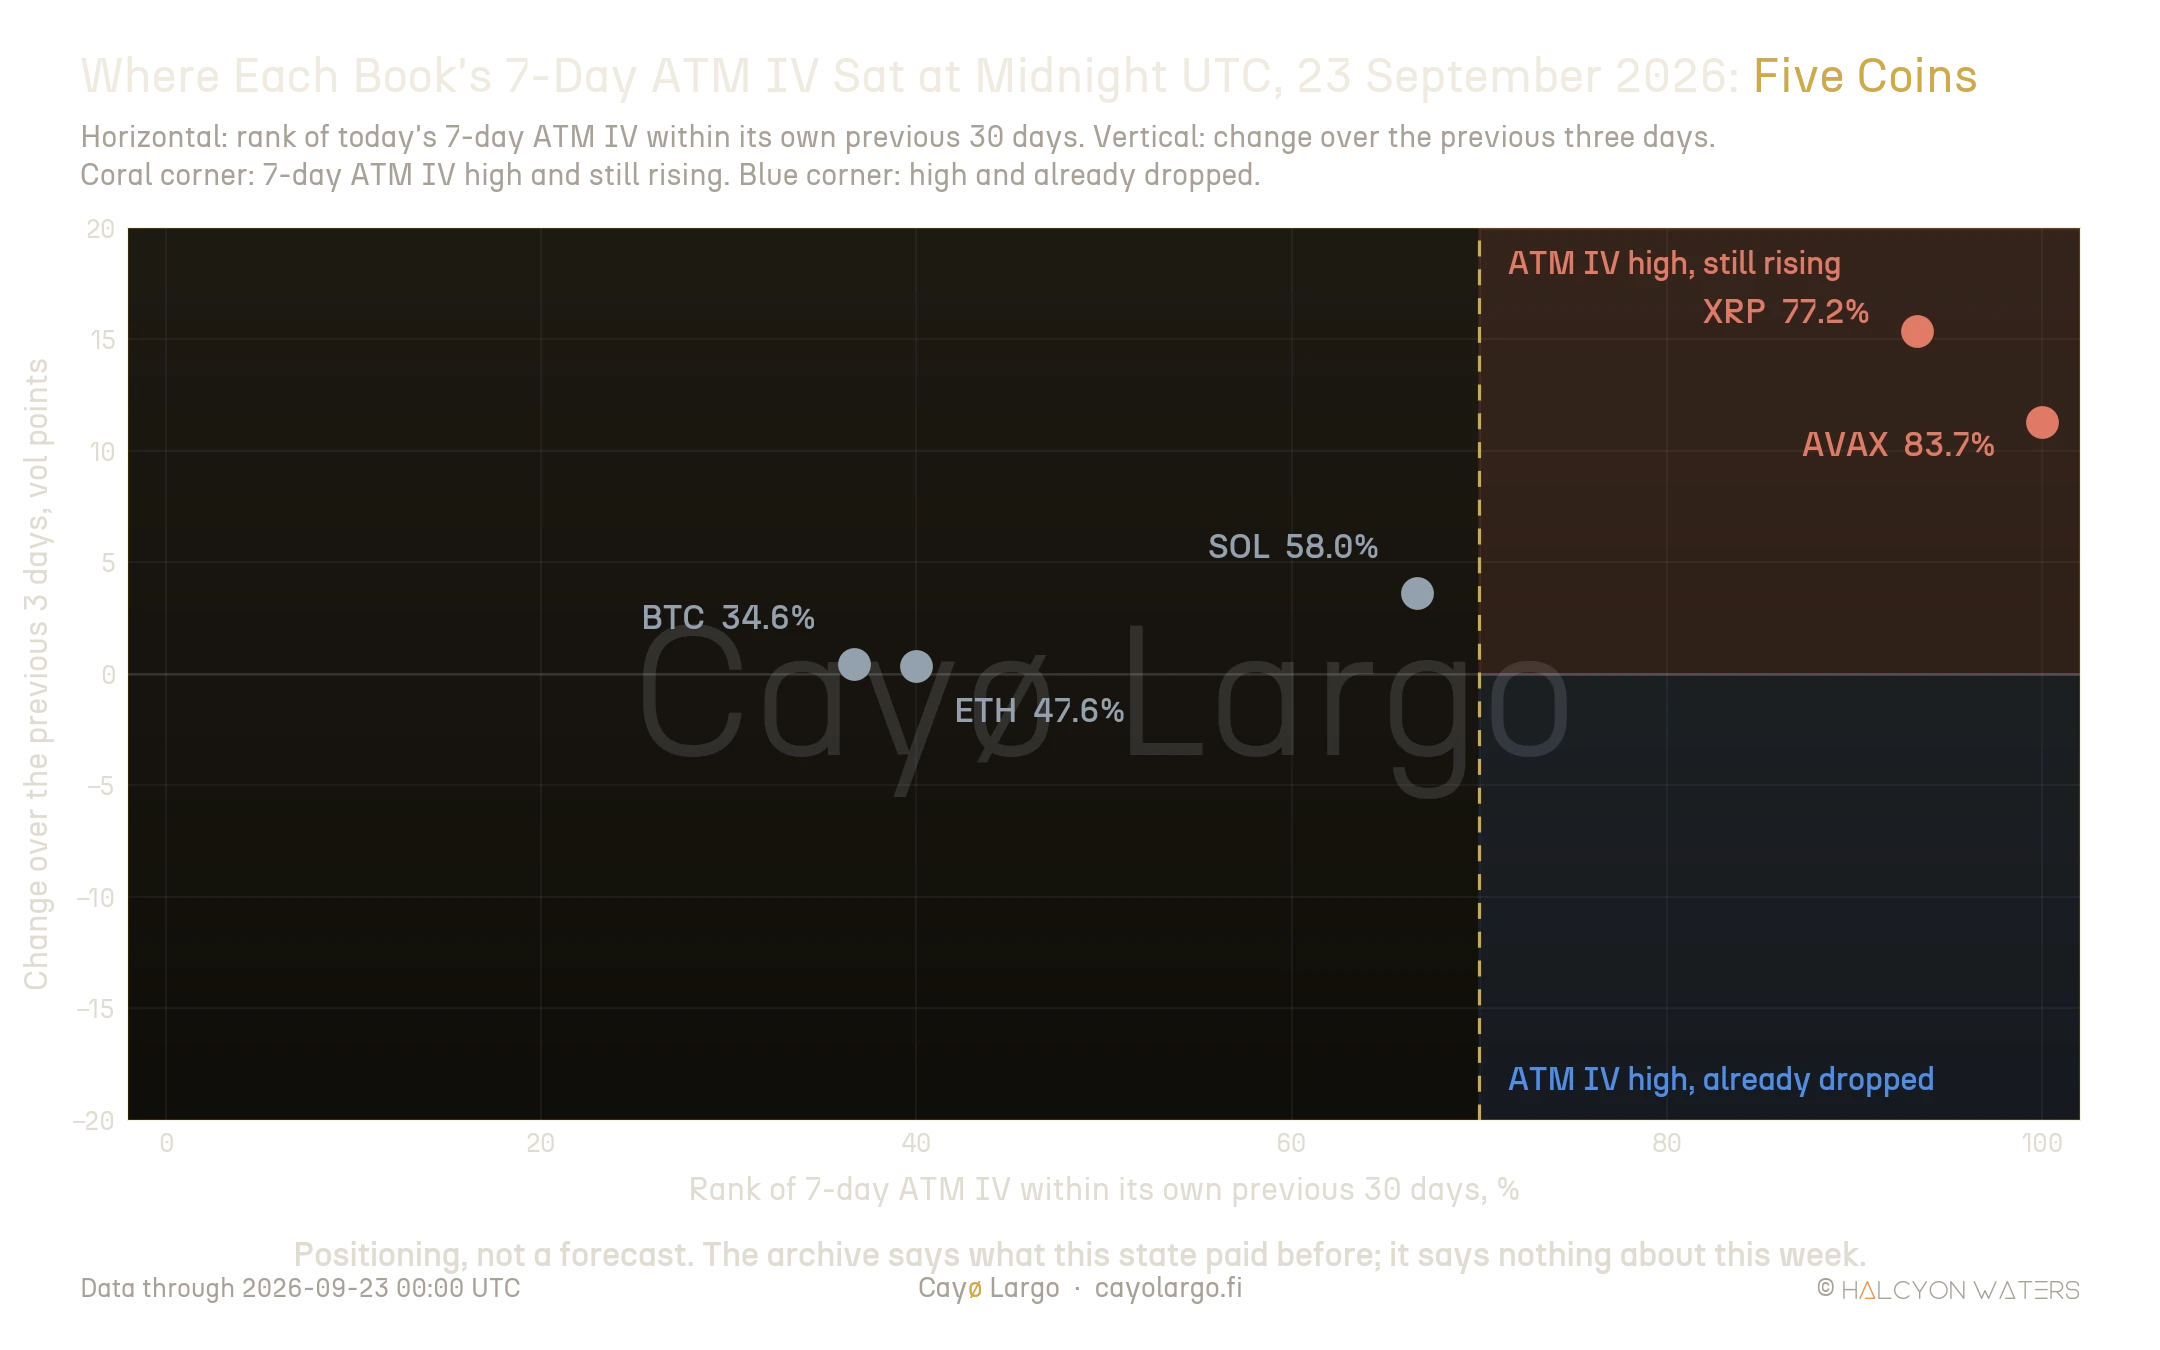
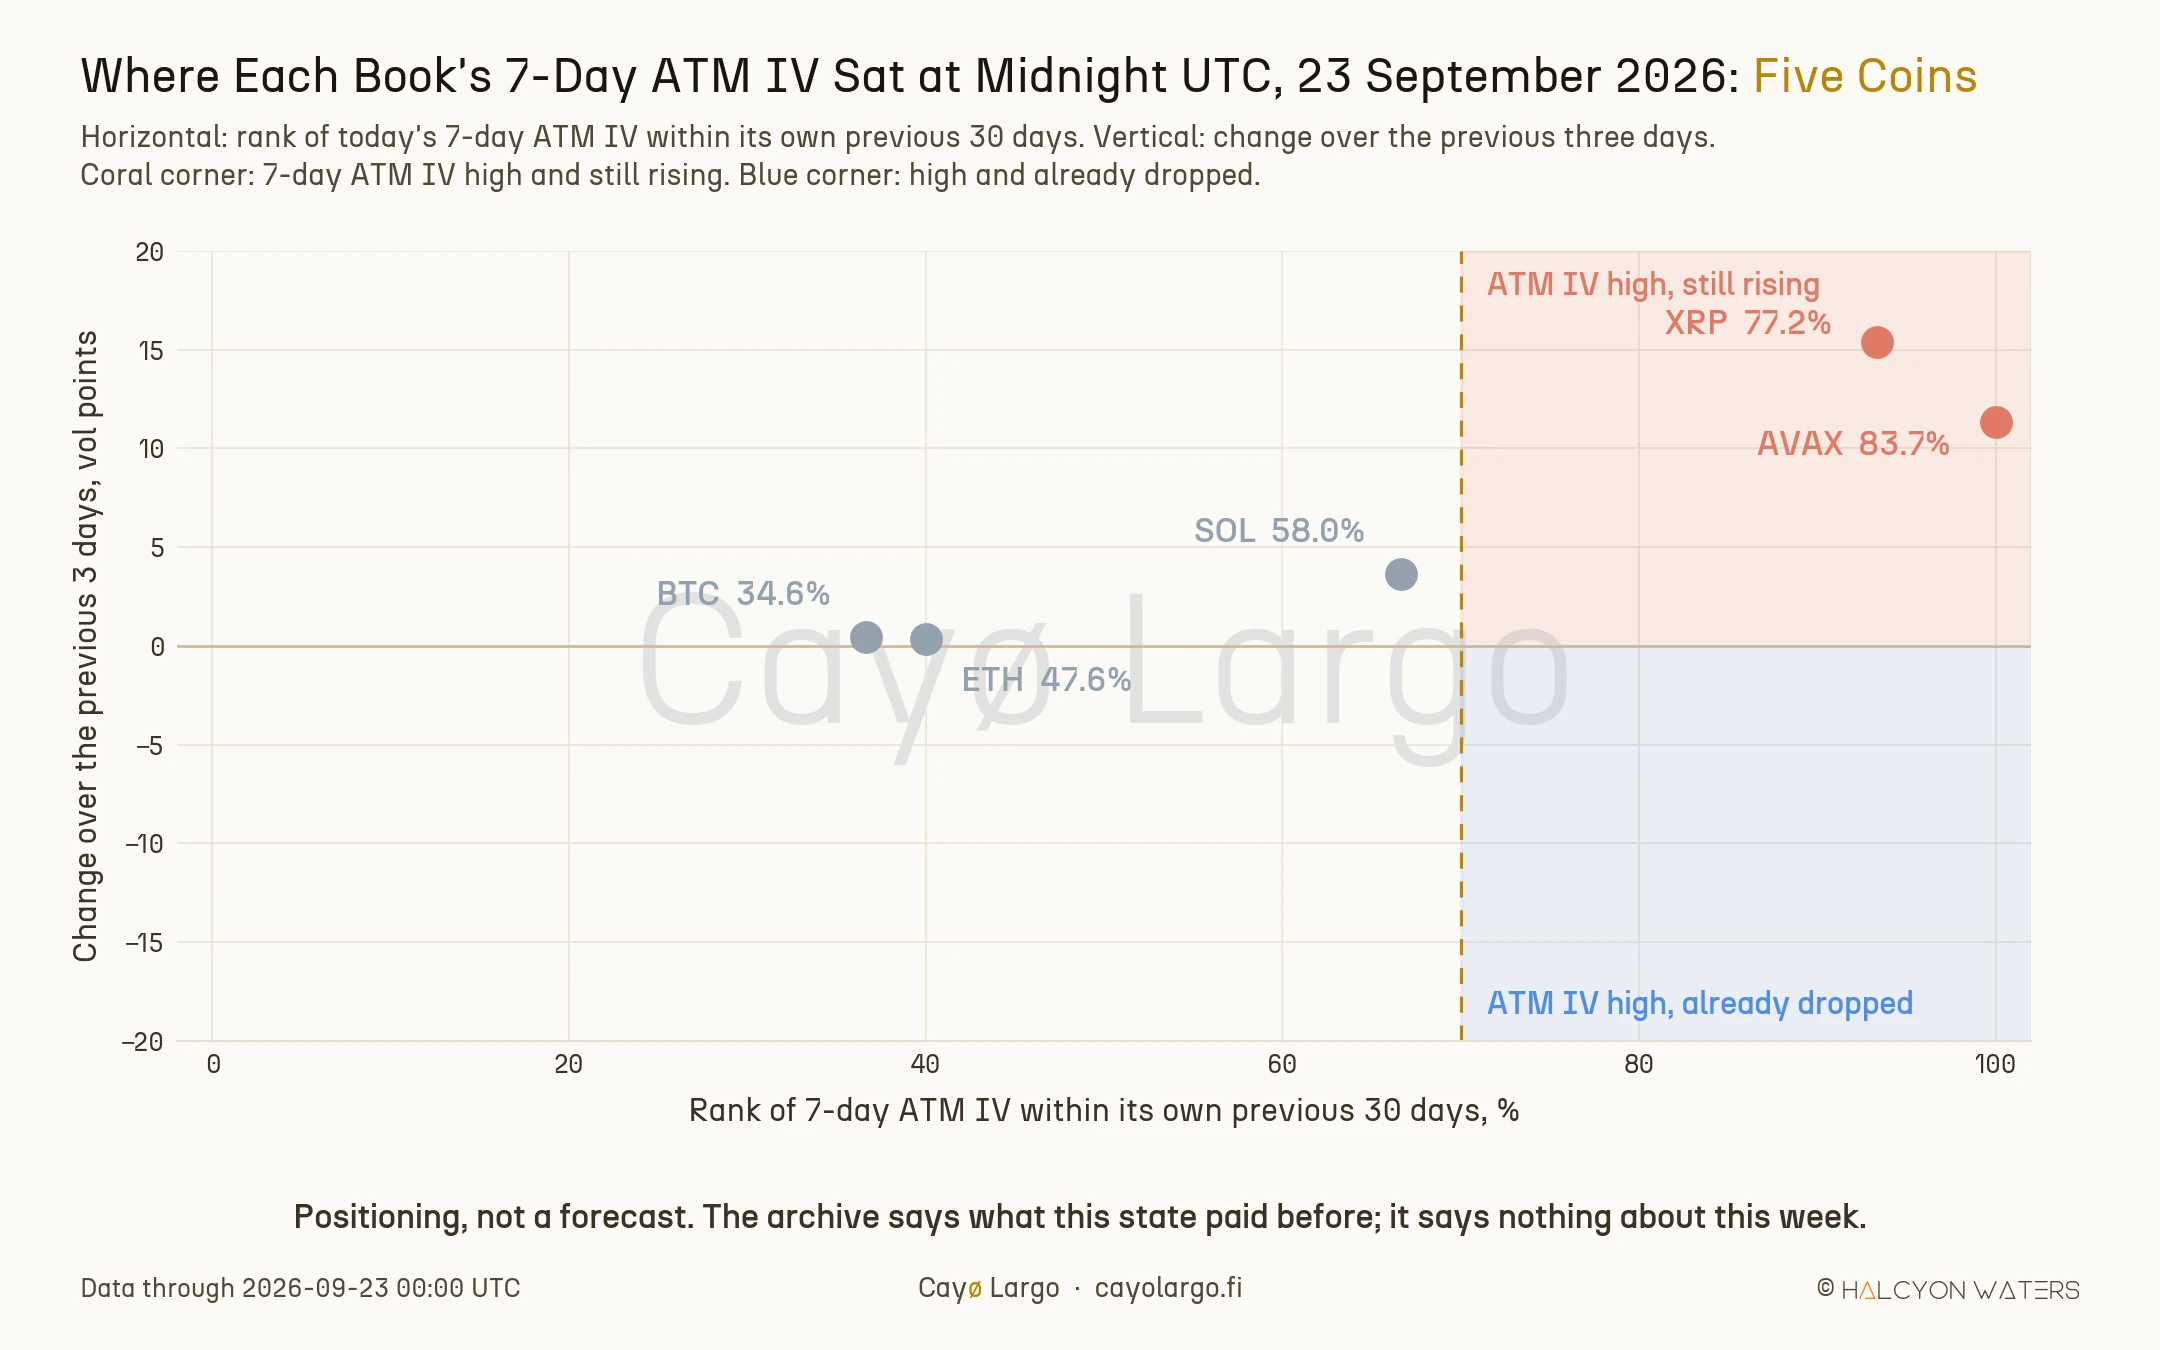
Figure 4: The five books at midnight UTC on 23 September 2026. Two sit in the state that paid sellers least; none sits in the state that paid them most.
Two books sit in the coral corner this morning, AVAX and XRP. AVAX's 7-day ATM IV stood at 83.7% at midnight UTC, the highest reading of its previous 30 days and 11.3 points above three days earlier. That came after a week in which the coin rose more than 50%. XRP sat at 77.2%, up 15.4 points in three days. Bitcoin, ETH and SOL are not high. The blue corner is empty. The plate shows where the books are and nothing more: the archive tells us what that state paid before, not what this week will bring.
How we measured it?
Every sale is read from Deribit's option marks as Cayø Largo records them every ten minutes, one sale per coin per day at 00:00 UTC. The window runs from 20 September 2025 to 16 September 2026 for BTC, ETH, SOL and XRP. For AVAX, whose archive starts later, it runs from 5 February 2026. The first weeks of each coin's archive serve only as the look-back for the first rank, which needs 20 earlier readings. TRX is left out as too thin a book.
The 7-day ATM IV is a fixed tenor, interpolated in total variance between the two listed expiries either side of seven days. Its at-the-money quote is the average mark of the options at the two strikes nearest each expiry's forward. The per-expiry quotes are the ones served by the volatility surface endpoint. Why a fixed tenor matters and how it is read off the curve is set out in when the crypto front week is actually cheap. The 7-day RV uses ten-minute returns on Deribit's index, served by the spot rates endpoint, after removing isolated prints the surrounding hour disagrees with. A week needs 90% of its returns present.
The live counterpart of this comparison is the IV vs RV page, which tracks 30-day ATM IV against the trailing 30-day RV for every coin. For how to read it, see the variance risk premium guide. The trailing reading tells you what the last storm cost. This note adds one more thing to read next to it: the direction implied has taken over the last few days decides how much of that reading carries into the week ahead.
What we did not test?
As usual, our research is not free of assumptions and limitations and three of them are worth naming here.
The first is the second half of the original argument, which we left aside. His claim was conditional. If dealer gamma rose on a rally and implied then came in, the drop would confirm that dealers are long and that would be the moment to sell. We tested only the drop. Cayø Largo's gamma exposure archive can answer whether dealer gamma sharpens the result. That deserves its own note.
The second is profit. The edge measured here is in volatility points on an at-the-money option held for seven days. A real short straddle also pays the bid-ask spread, the cost of hedging and whatever path the coin takes. None of that is modelled. The comparison between the states is fair but the level is not a P&L.
The third is independence. The 124 "already dropped" sales come from 19 separate weeks and no single week holds more than 18.5% of them. The bad "still rising" sales, on the other hand, cluster in a handful of weeks, above all in the February 2026 crash. That is simply how a volatility seller's risk tends to arrive. It also means that twelve months cover a single market cycle and only another year of archive will make these intervals narrower.
A closing thought
Selling volatility is a patient trade. This archive suggests that some of the patience belongs before the sale. A high implied invites the seller in. While it is still climbing, though, the storm usually has more to deliver. Let it turn and give the turn a few days. Much the same premium can then be collected on the far side of the weather. The dealer-gamma half of the argument is the next thing we want to measure.
References
- 2023-01-24, Amberdata, Bitcoin Options: Finding edge in four years of volatility regimes. In the systematic volatility trading section, finds 30-day BTC IV above the 30-day RV that followed nearly 70% of the time since April 2019 and charts the spread as a time series whose deepest trough, near -95 volatility points, falls in the March 2020 crash.
- 2025-05-21, Cryptarbitrage, Option Backtest: Selling Weekend Vol, Revisited. A backtest of short Bitcoin strangles over the weekend, which warns that negatively skewed strategies look better the shorter the sample, because a short sample can miss the left tail entirely.
- 2026-03-09, Imran Lakha, The Volatility Trap: Why "High" Isn't Always "Expensive". Argues from silver and crude oil that high implied volatility is cheap while realized keeps outrunning it and that the safest volatility sales come when dealers are long gamma and realized is being held down, not at the peak.
- 2026-09-17, Imran Lakha, The safer time to sell vol is after it's already dropped. The claim tested here: wait for implied to come in before selling, rather than selling at the 70th percentile because it is high.
- 2026-09-18, Thalex, BTC pumping while vol is still crushed. A post on Bitcoin calls whose thread continues, in Thalex's own reply, that Saturday morning to noon UTC tends to give the best implied volatility entries of the week, for October to December calls.
Frequently Asked Questions
When is the best time to sell crypto volatility?
In twelve months of Deribit data on five coins, selling 7-day at-the-money volatility while it sat in the top 30% of its own month was far safer after it had come off over the previous three days than while it was still climbing. The worst day in ten lost 6.1 volatility points against 33.7. The seller was paid on 80.6% of days against 63.5%.
Is high implied volatility expensive?
Not while it is still rising. On days when crypto 7-day ATM IV was high and still climbing, the next seven days delivered on average slightly more volatility than the option charged: the seller's average edge was -0.41 volatility points. After implied had turned lower, the average edge was +7.08 points, even though the implied level itself was similar.
Why does waiting for implied volatility to drop make selling safer?
Because the drop usually comes after the storm, not before it. On days when high implied had already come off, the 7-day RV of the week just gone was 88.3% while the 7-day ATM IV stood at 69.6%. The 7-day RV then fell by a median of 25.4 points over the following week. Selling into a still-rising ATM IV means selling while the realized move is still arriving.
Is Saturday the cheapest time to buy crypto options?
On Bitcoin and ETH, slightly. At 10:50 UTC on Saturdays the fixed 30-day ATM IV sat 0.34 points below the rest of the same week on Bitcoin and 0.43 on ETH, cheaper in about two weeks out of three over twelve months. That is under 1% of the premium. It fades at 60 days, while SOL and XRP do not show it reliably.
Does this work at longer tenors?
Less. On 30-day options the same comparison still favours waiting. The tail improvement shrinks to 7.5 volatility points. Its interval only just clears zero at one anchor hour and does not at the other. The effect is strongest where it matters most for a short-dated seller, in the front week.
Related Articles
When Is The Crypto Front Week Actually Cheap?
Across 1,396 crypto coin-days the front week was worth its price 31.2% of the time and the curve barely moved it: 28.8% inverted, 34.5% in contango.
Crypto Variance Risk Premium: Live IV vs RV on Six Coins
How to read IV vs RV charts and the variance risk premium to figure out whether crypto options are overpriced, underpriced, or fairly valued. Live AVAX example from Deribit.