Deribit Options Execution Slippage: The Exit Costs More
We measured 469,000 Deribit option trades over six months: the buyer fills at mark, the seller gives up 1.4% to 2.9%, and the quoted spread predicts neither.
On 2 September a whale bought 18.7 contracts of BTC-25SEP26-84000-C, a Bitcoin call with ten days left on it, and paid 0.00900 BTC for each. Spot was $77,231, so that is $695 a contract and $12,998 for the lot.
Twelve days later spot is $78,002, which is 1% higher, and the call is marked at 0.00510 BTC, which is 43% lower. In dollars the contract has gone from $695 to $398. Direction never went against this position for a moment: time and volatility did the damage, and that part is ordinary.
Here is the part that is not. The screen values those contracts at $7,439. The best bid on the book will pay $7,001. The missing $438 is not a loss anyone took. It is the toll for leaving, and you pay it on the way out whatever the position did on the way in.
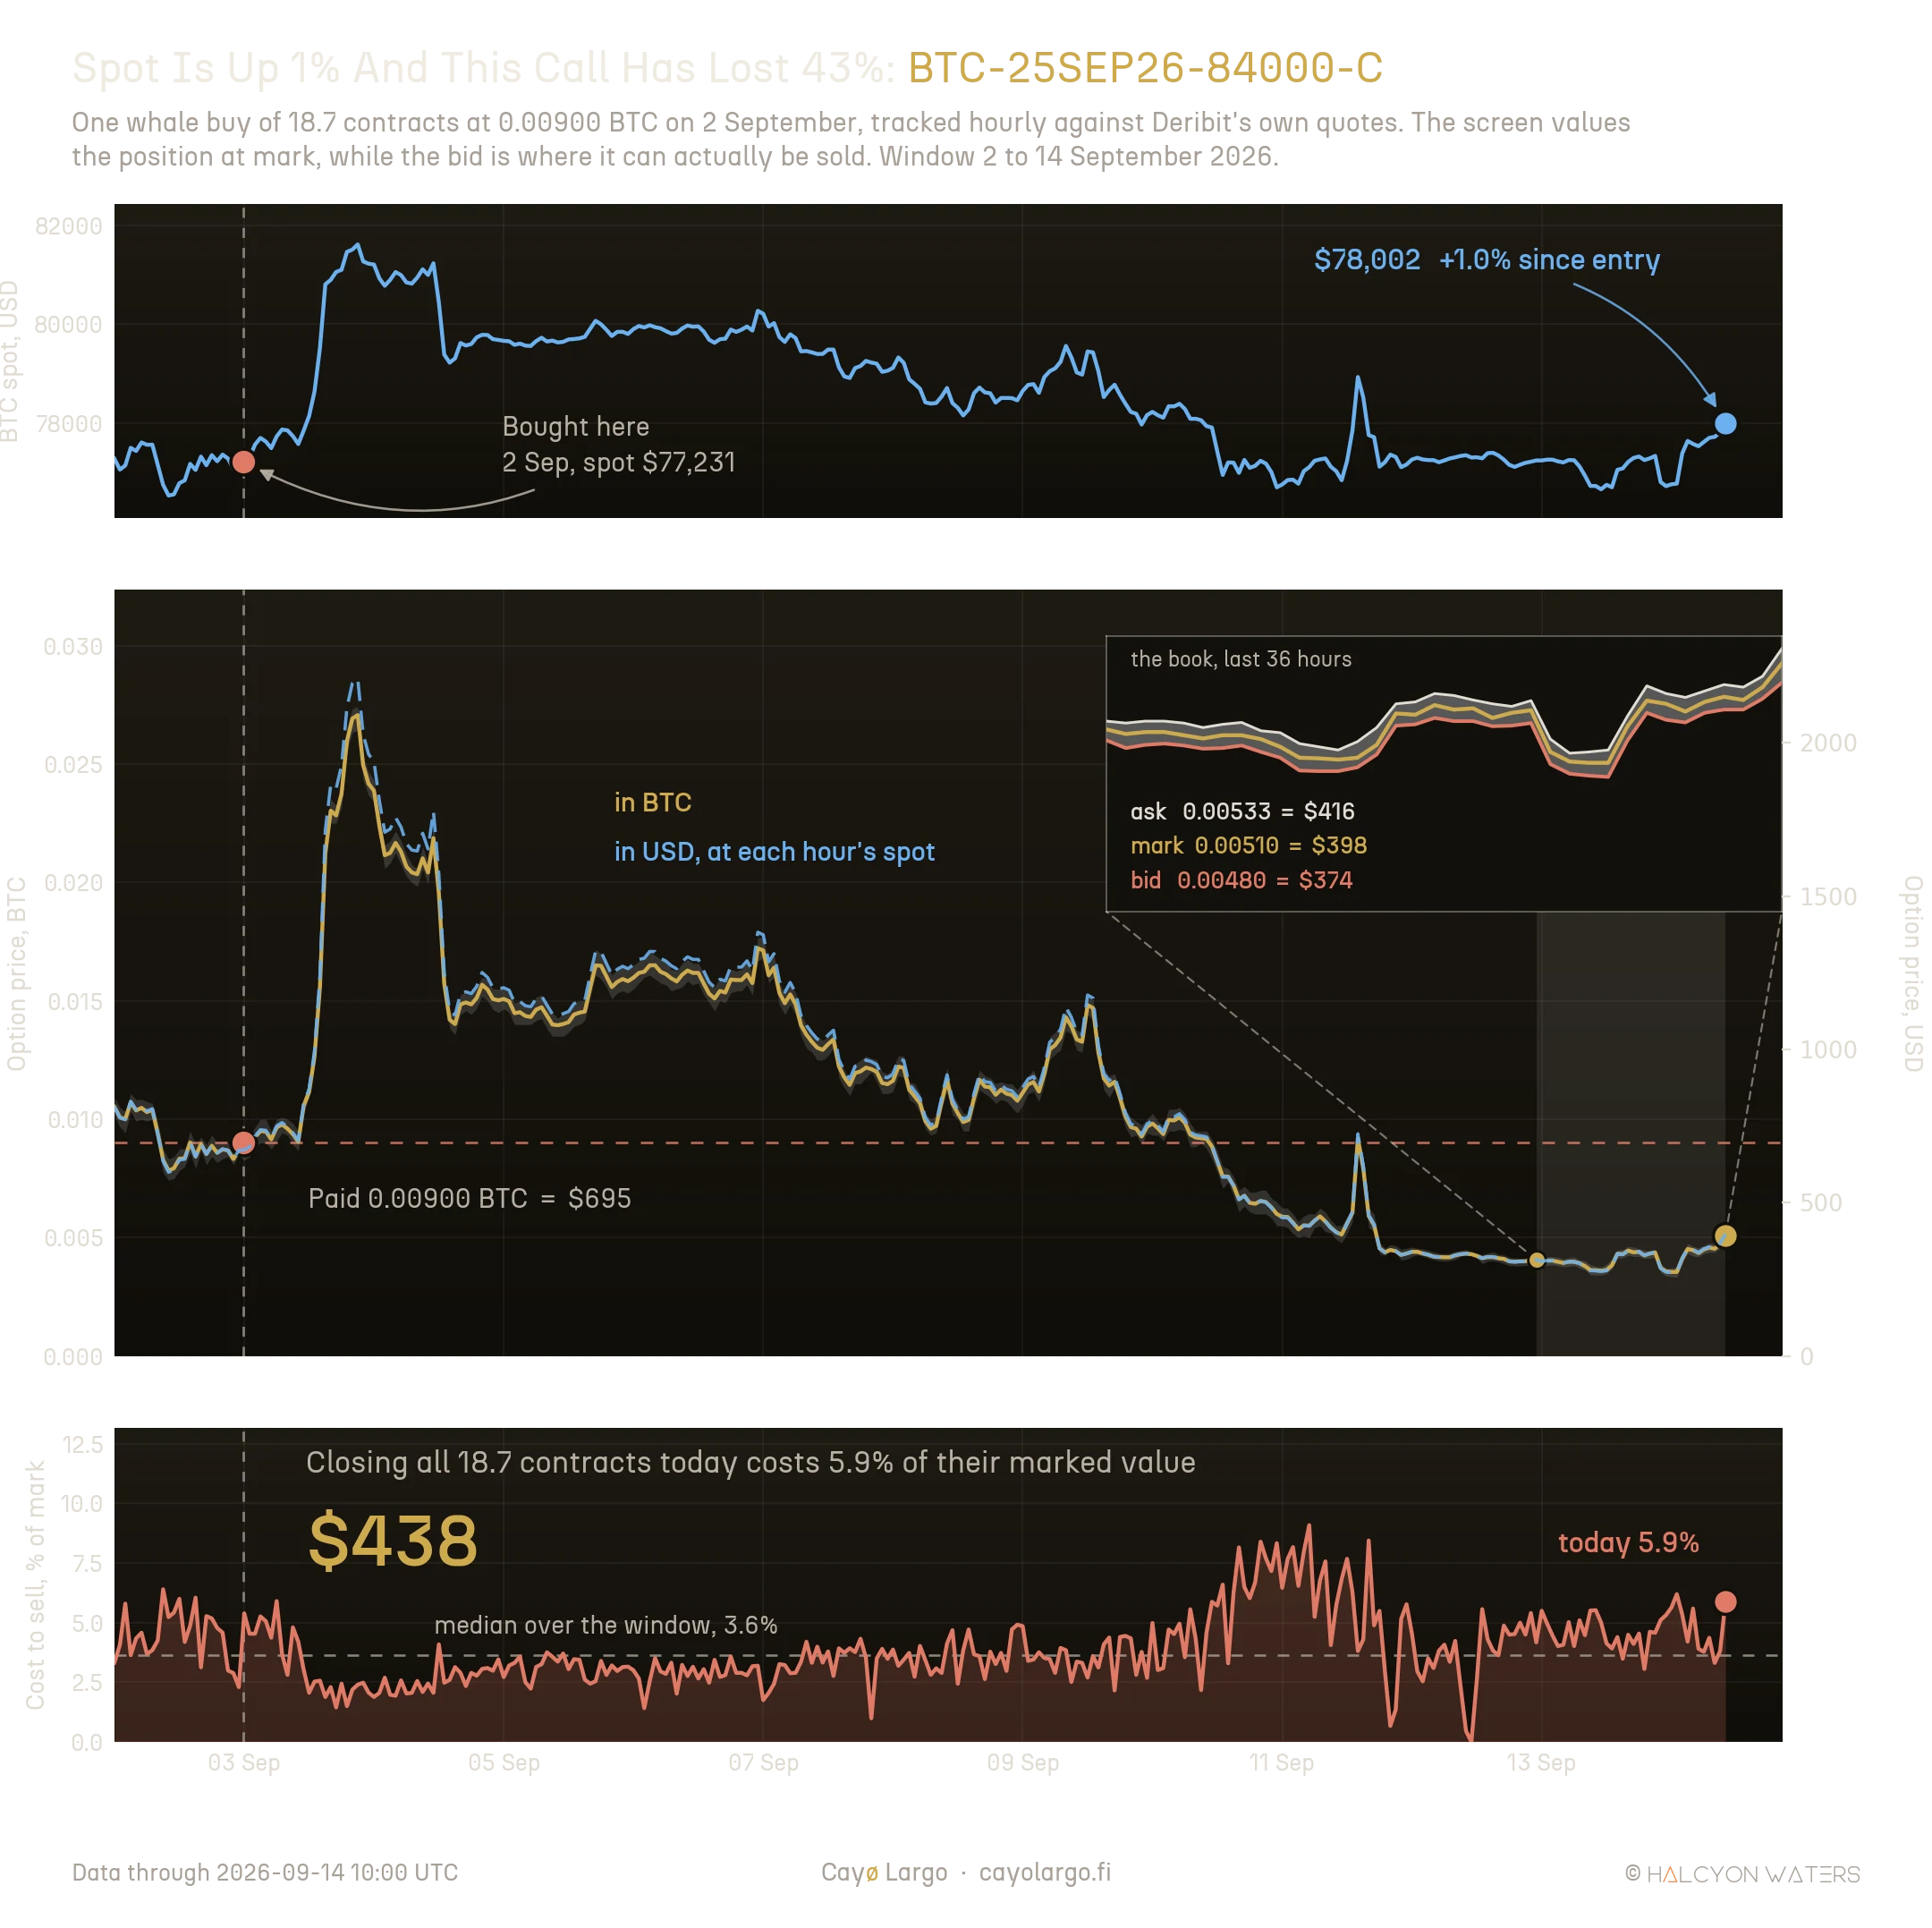
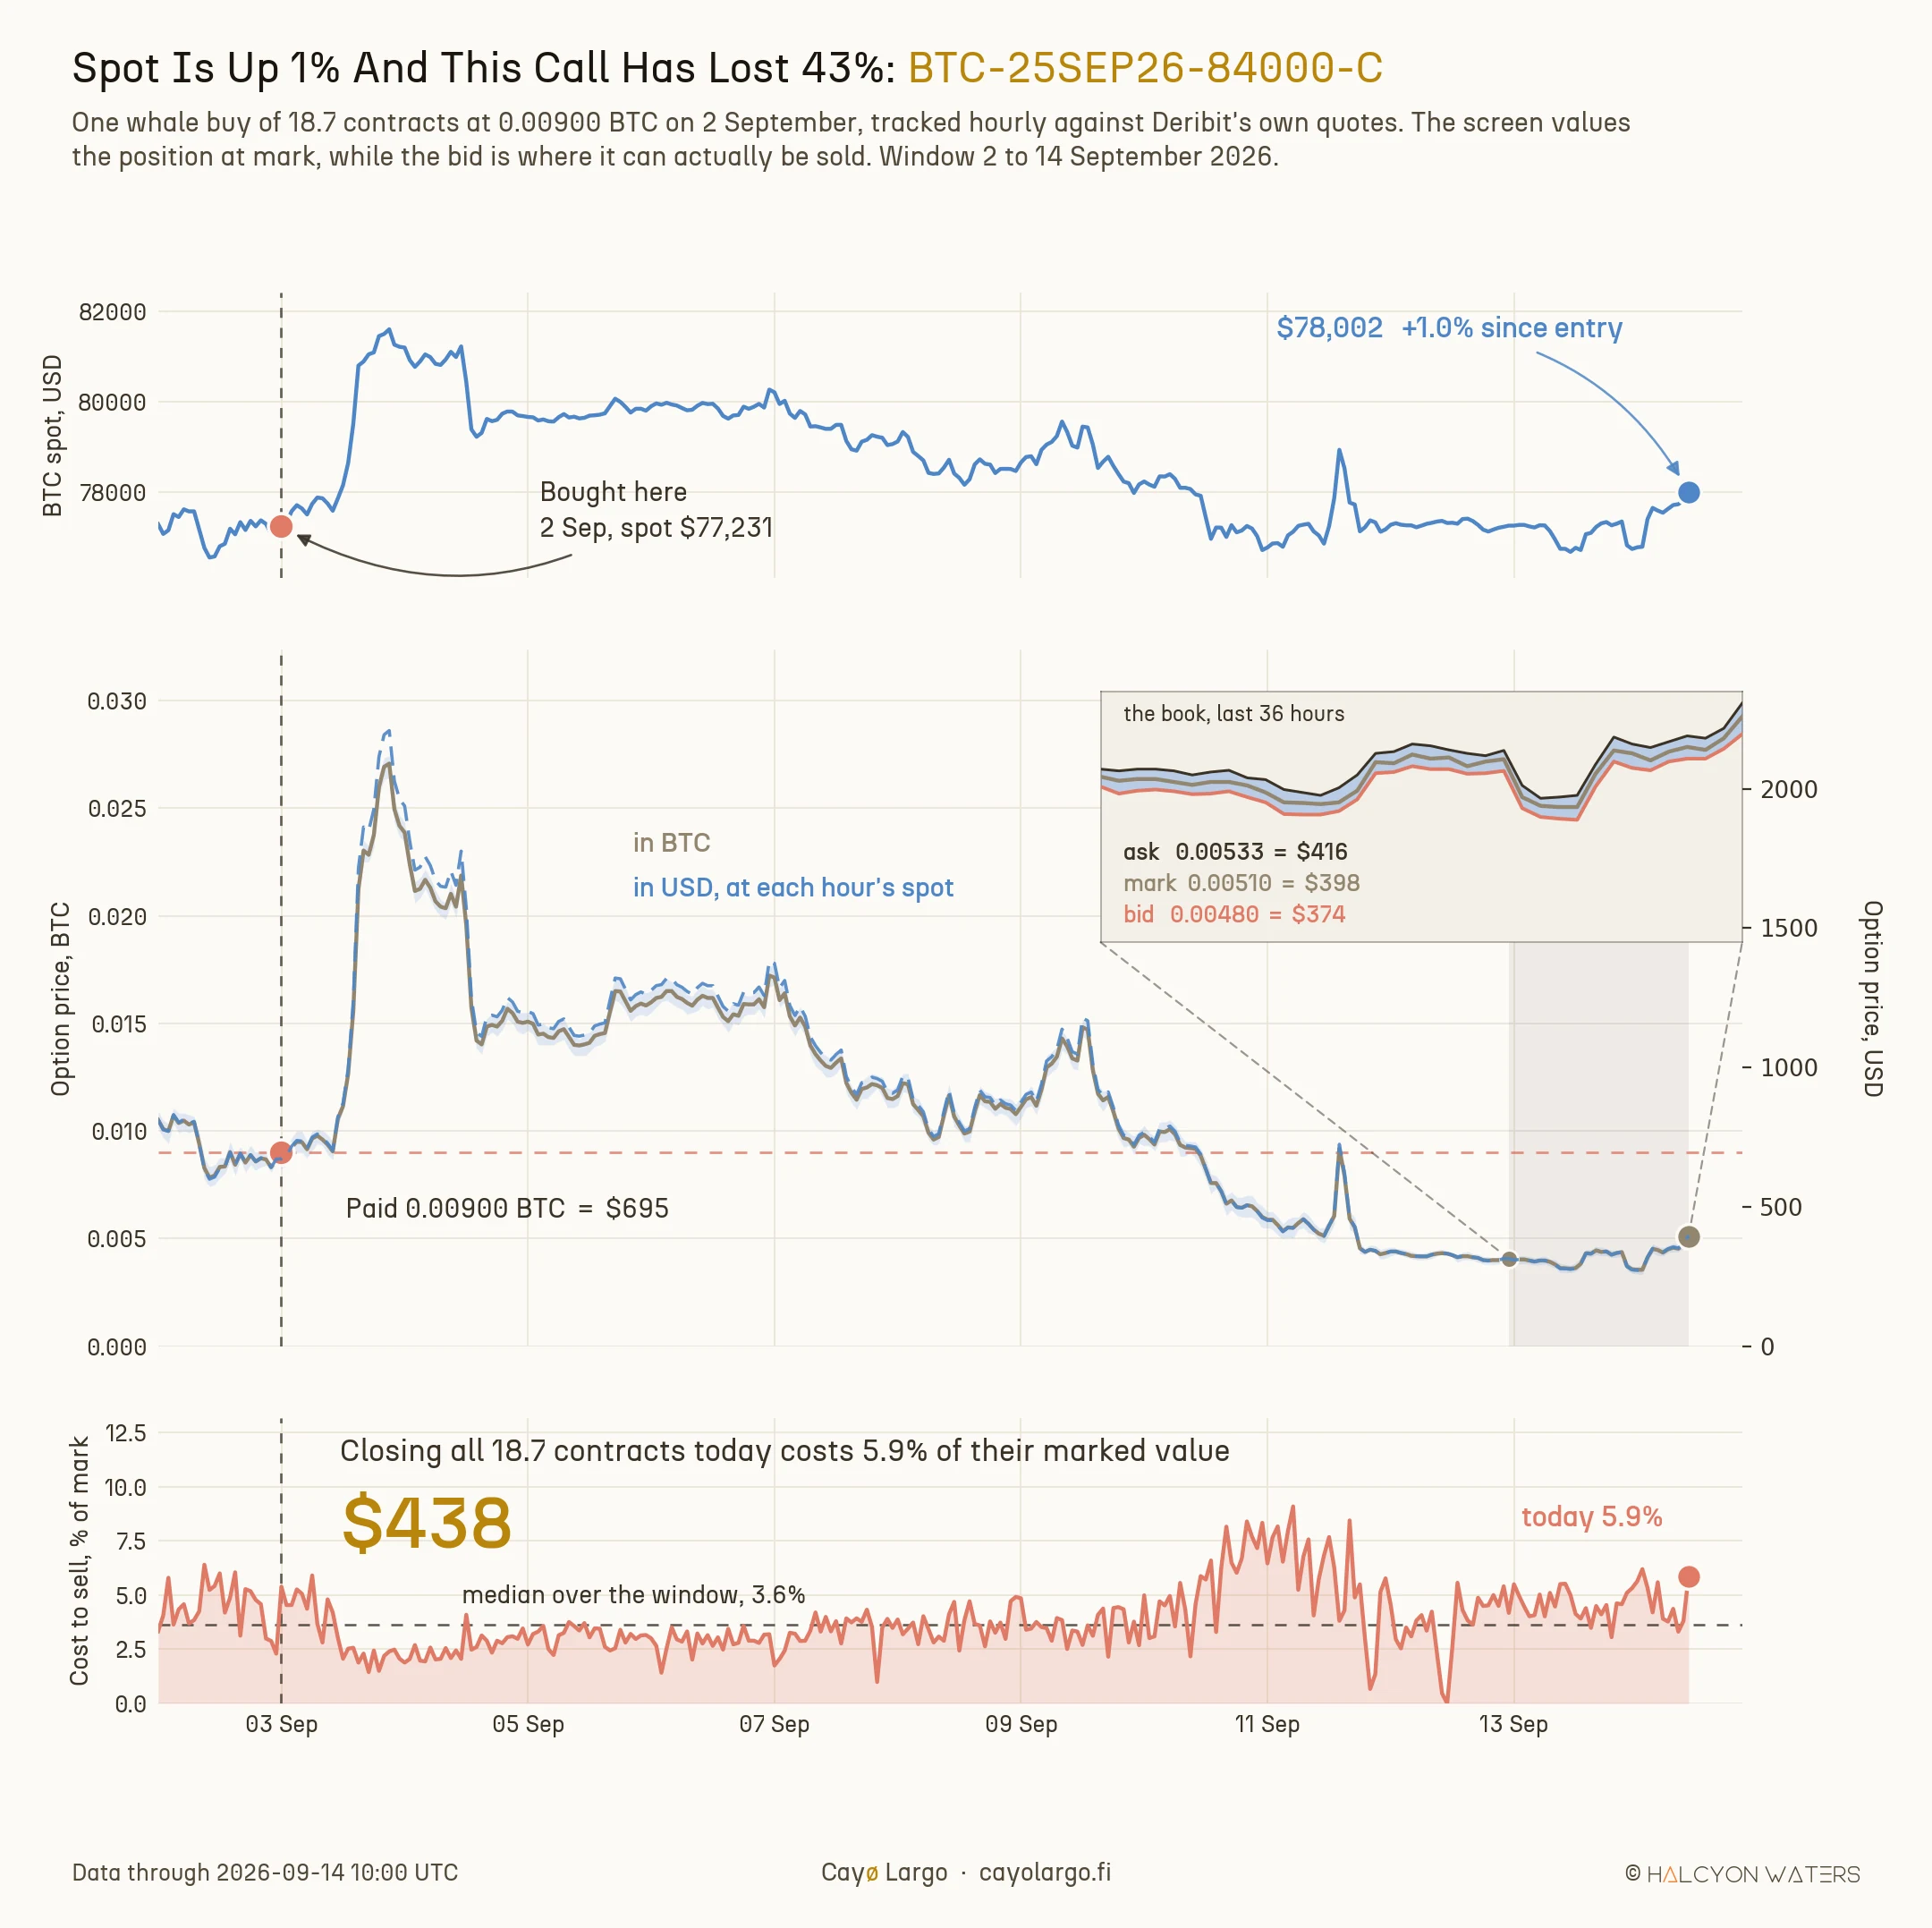
Figure 1: Spot on top, the option in BTC and in dollars converted at each hour's own spot, and the cost of leaving at the foot. The inset magnifies the last 36 hours, the only scale at which ask, mark and bid separate. Contract and quotes are real; the holding is an illustration, since we know 18.7 contracts were bought and not by whom.
That toll is not a quirk of one contract: over six months of Deribit's tape the median seller gave up 1.4% to 2.9% of premium against mark, and the median buyer filled at mark.
In this note we take every option trade Deribit printed between April and September 2026, split it by which side crossed, and measure every fill against the exchange's own mark price. Then we test the yardstick itself, namely whether mark sits where everyone assumes it does. After that, the same measurement across tenor and across all six coins, and we finish with what it does not settle.
The cost that gets budgeted as one number
Execution cost in options gets carried as one figure. Enter, exit, done.
Practitioner writing is consistent on this and has been for a decade. Gavin's butterfly course, 2013, tells readers to prefer liquid underlyings because "highly liquid stocks and ETF's will help reduce slippage due to narrower bid-ask spreads", treating the quoted width as the thing you pay. Cryptarbitrage's Deribit backtest of a weekend short-volatility strategy states the assumption outright: regular Deribit fees, "as is 5% slippage on the premiums collected". And Imran Lakha, relaying Mark Anderson on where the money goes in a large short-dated book, quotes "we roughly spend 55% of our P&L on slippage". One number. Applied to the trade.
None of that is wrong, and without the underlying tape it is the sensible thing to do, what all three of them are open about. What it cannot show is that the number splits, and splits badly, between getting in and getting out.
Let's define what we are measuring, because execution slippage is the distance between the price a trade printed at and the option's mark price at that moment, as a share of that mark:
where is the executed price of the trade and is the exchange's mark price for that instrument at the time of execution.
A taker who buys lifts the offer, so comes out positive and the buyer has paid up. A taker who sells hits the bid, what makes negative. Both are costs to the aggressor. Keep that in mind, because if the book were symmetric around mark the two would be mirror images of each other.
They are not.
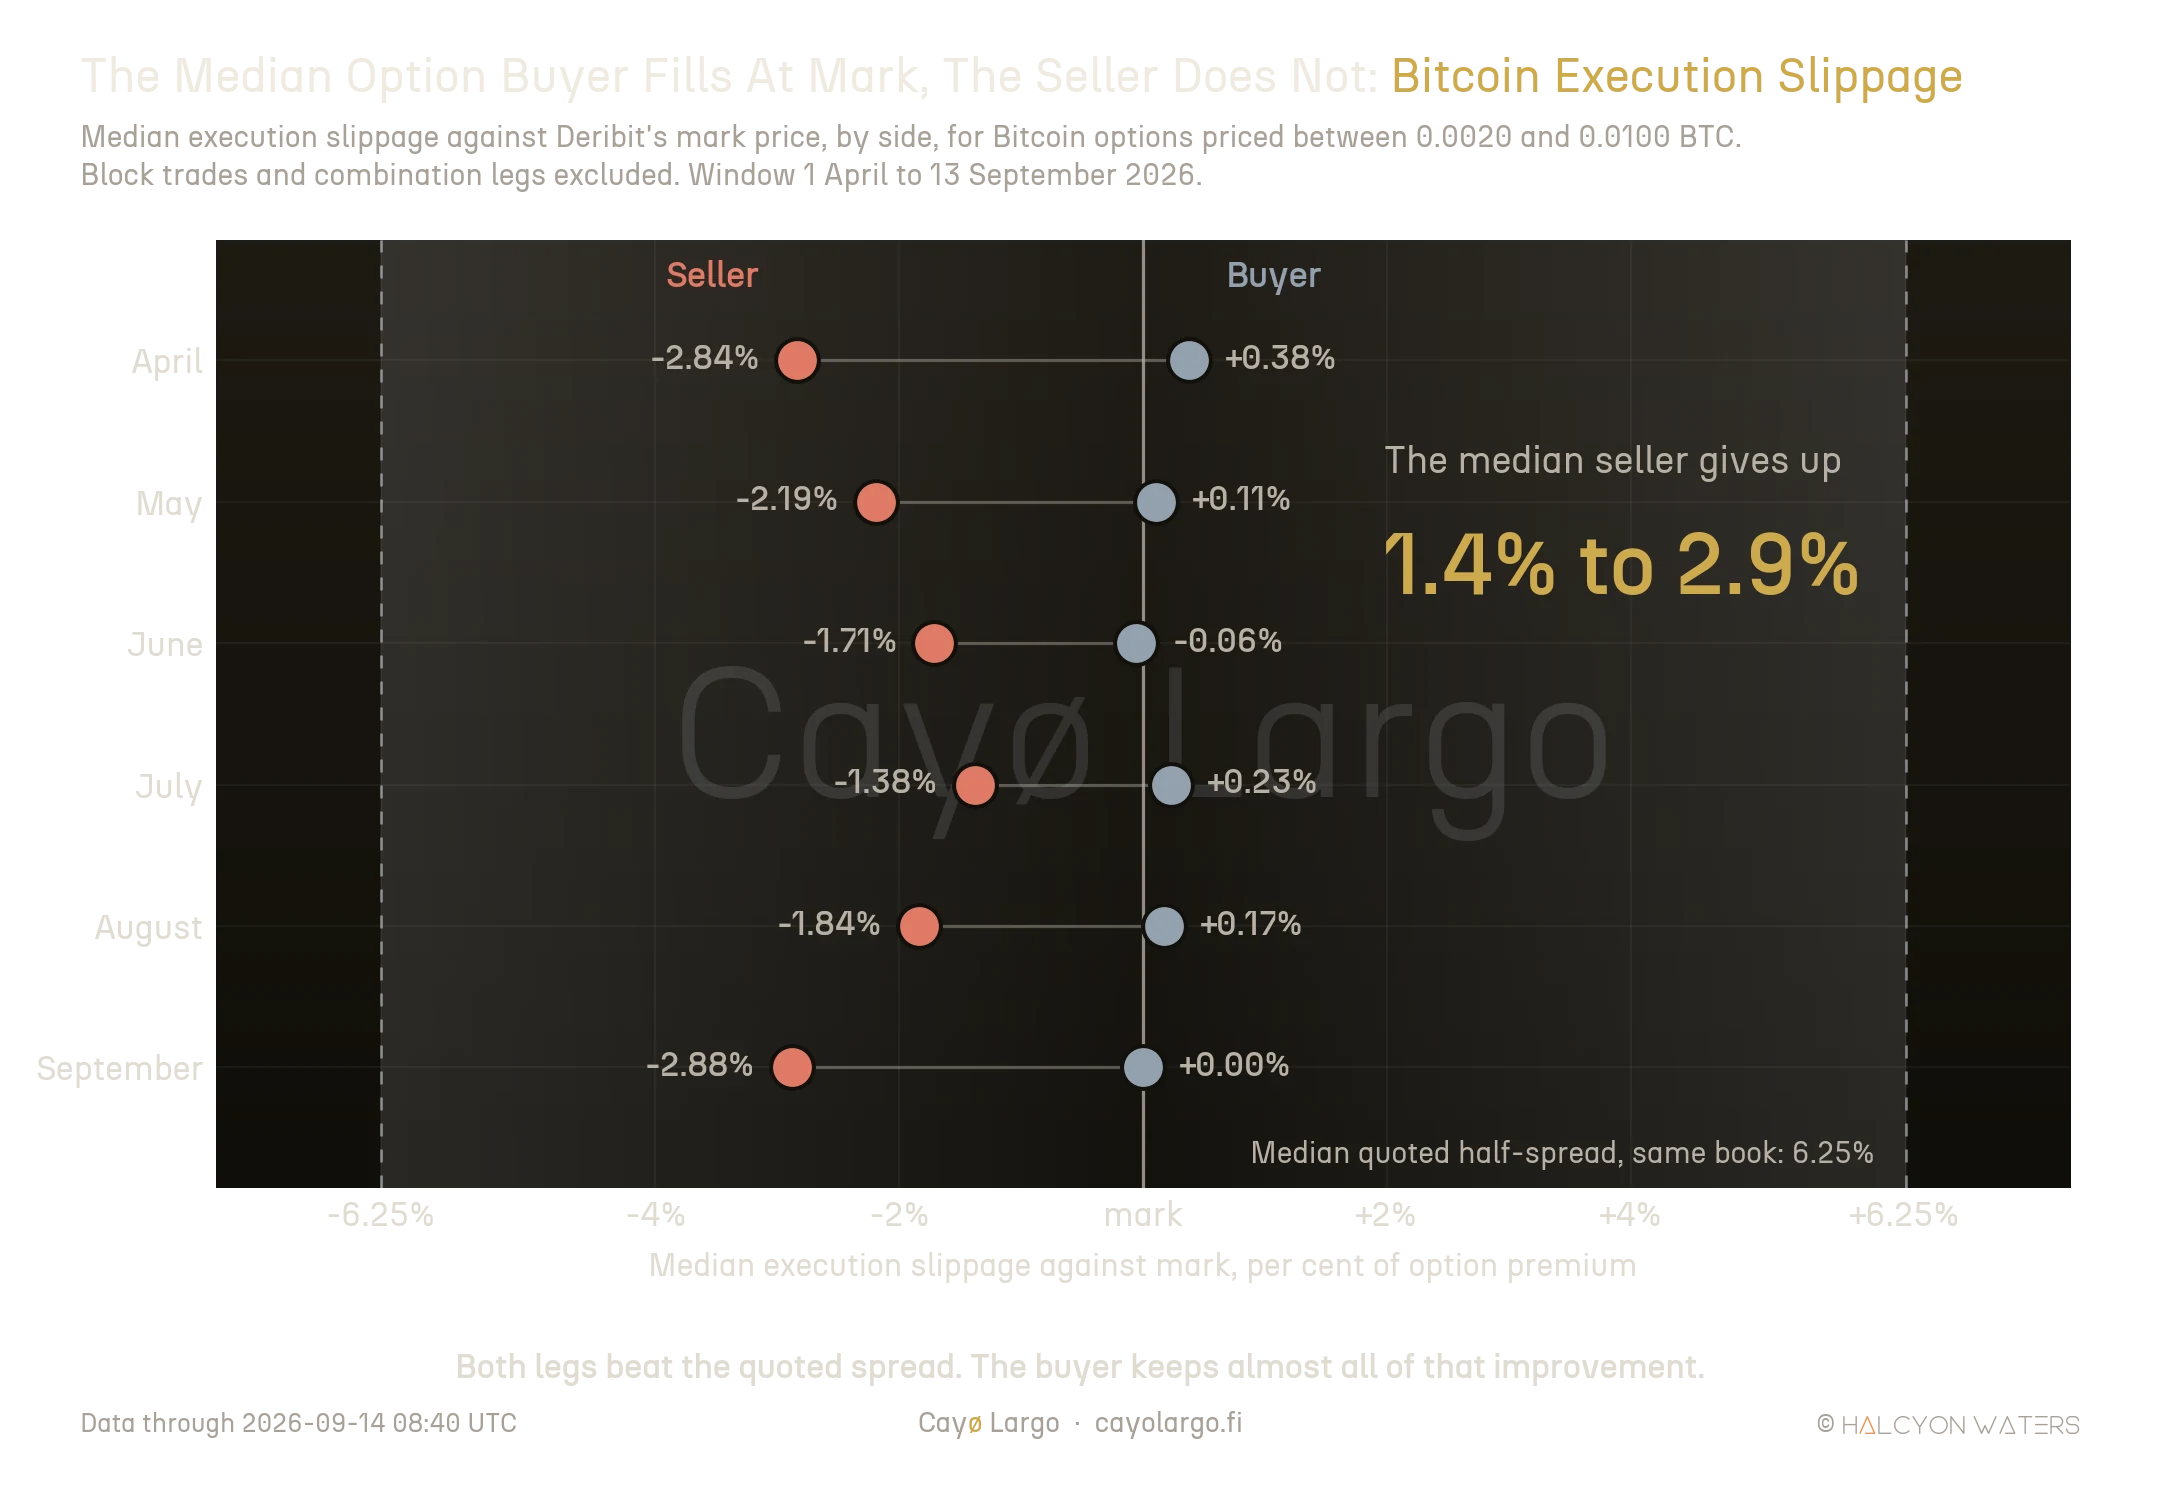
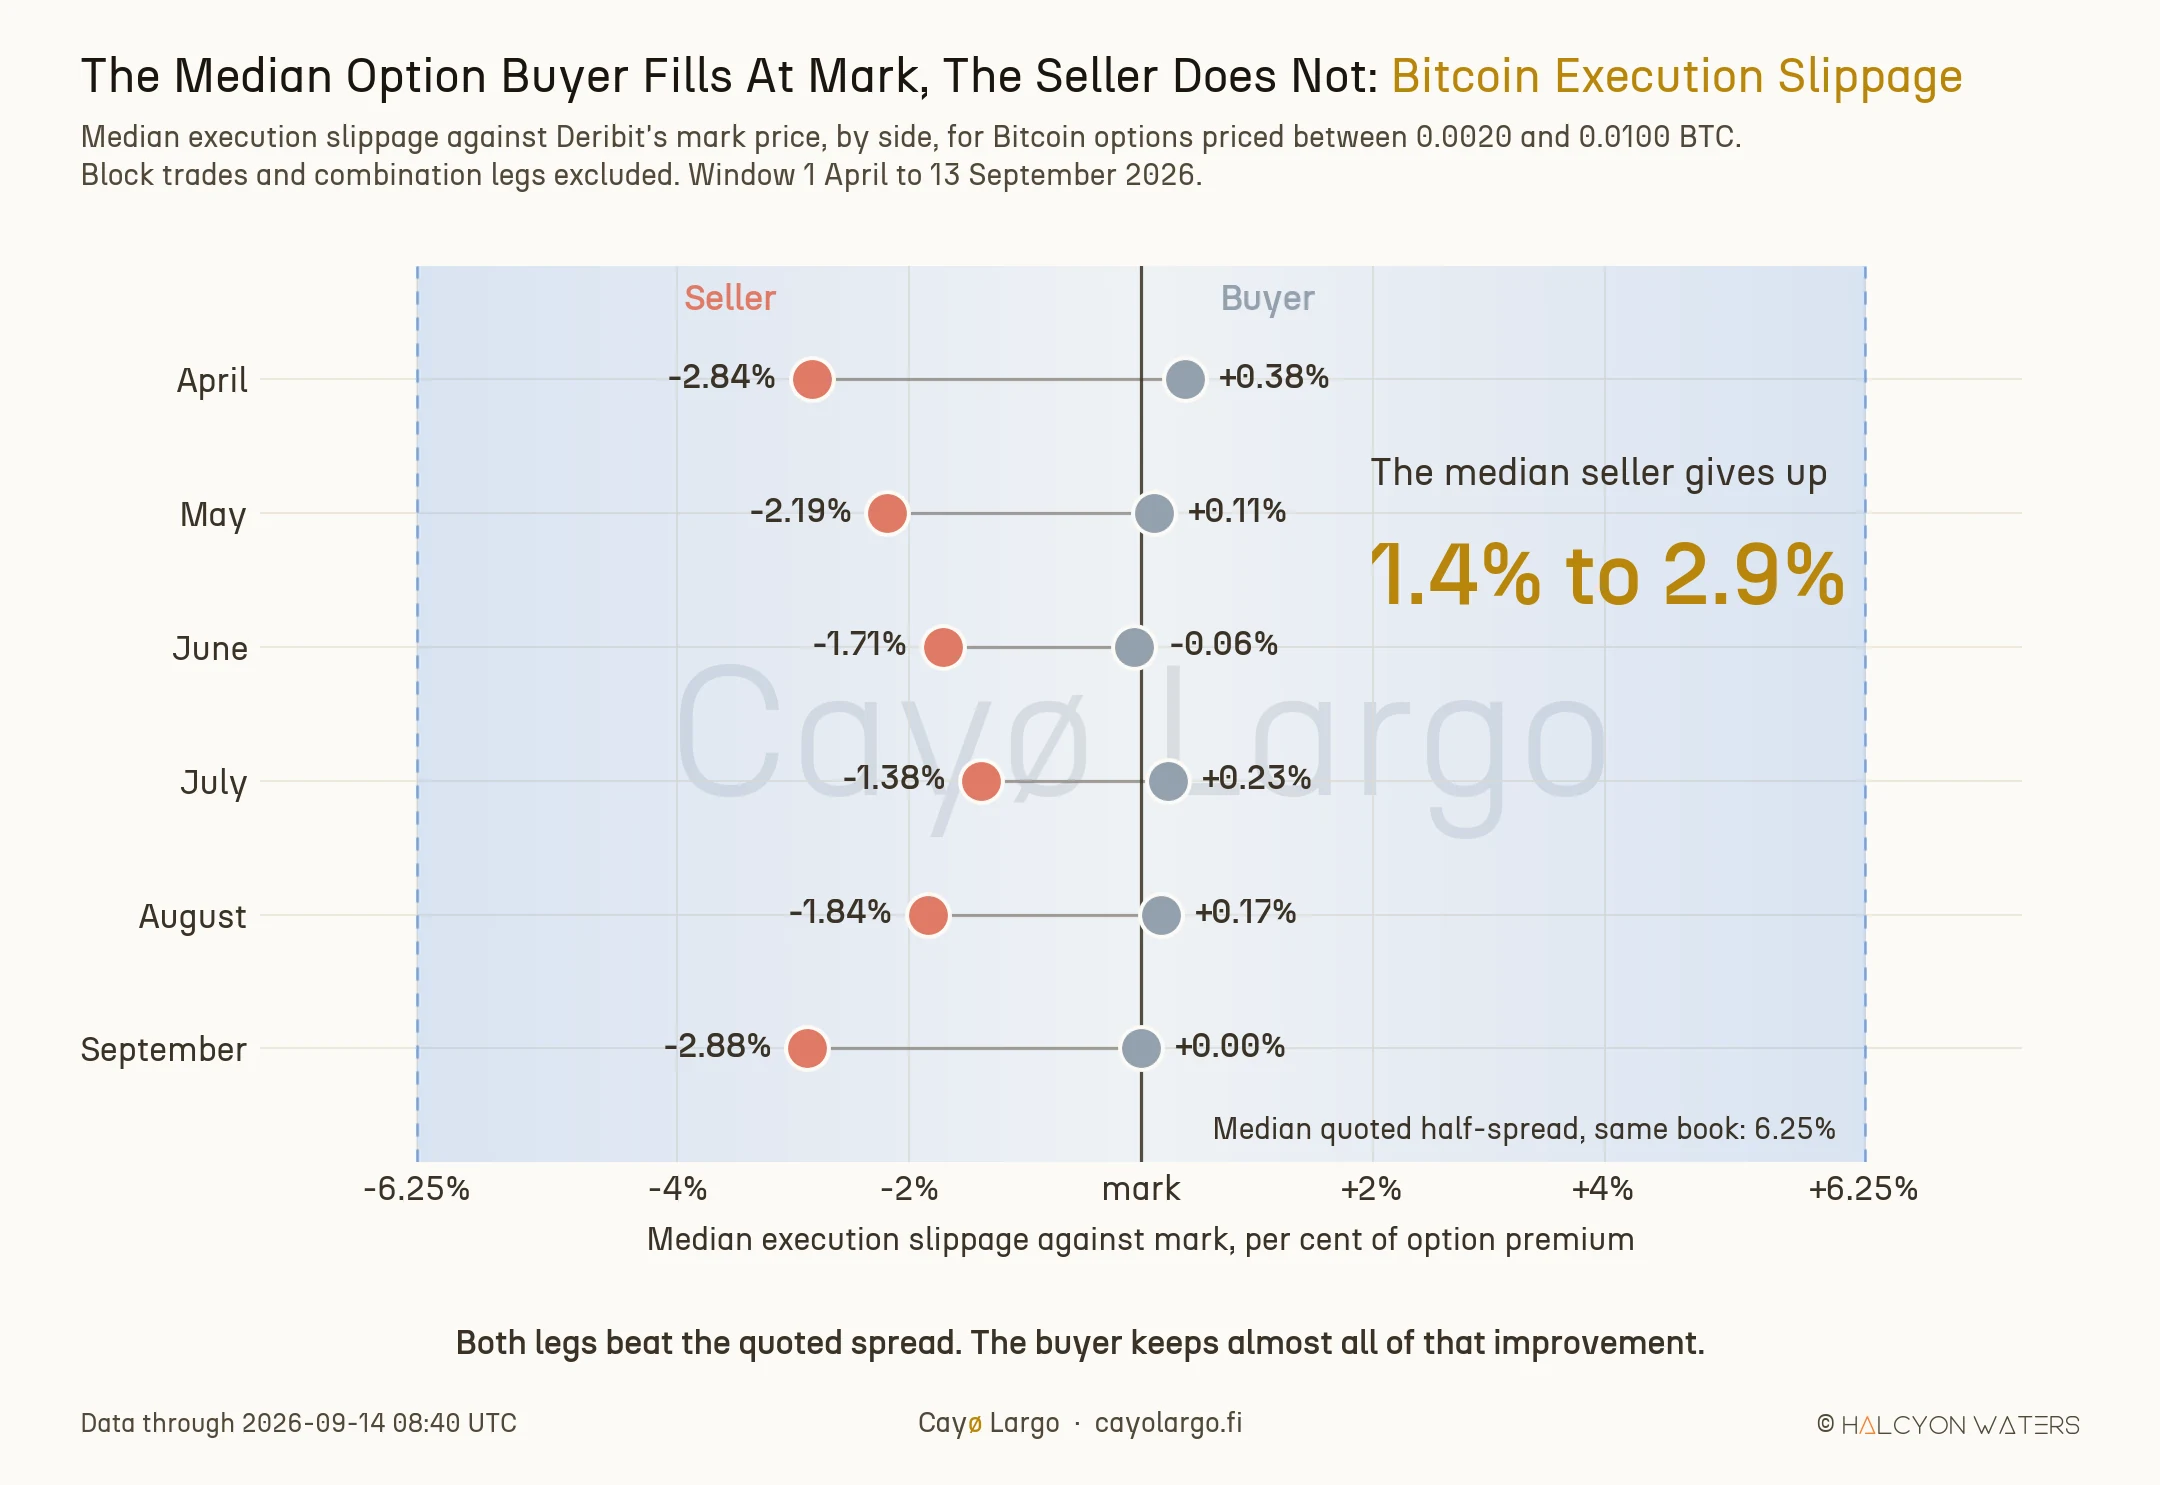
Figure 2: Each row is one month. The silver marker is the median buy, the coral marker the median sell, both measured against mark. The vertical line is mark itself. The shaded band is the median quoted half-spread of the same book over the same period, so the plate carries the screen and the tape together.
The numbers
Bitcoin options priced between 0.0020 and 0.0100 BTC, i.e. roughly 780 of premium at current spot. Blocks and combination legs are out, because both are negotiated rather than taken off the screen.
Have a look at the monthly split.
| Month | Median buy | Median sell | Buy trades | Sell trades |
|---|---|---|---|---|
| April 2026 | +0.38% | -2.84% | 45,484 | 42,080 |
| May 2026 | +0.11% | -2.19% | 44,191 | 43,290 |
| June 2026 | -0.06% | -1.71% | 56,207 | 53,883 |
| July 2026 | +0.23% | -1.38% | 49,589 | 44,736 |
| August 2026 | +0.17% | -1.84% | 34,749 | 31,521 |
| September 2026, to the 13th | 0.00% | -2.88% | 12,092 | 11,376 |
Six consecutive months. 469,138 trades. The buy leg never wanders more than 38 basis points of premium from mark in either direction. The sell leg never gets closer than 138.
Read it as a trader and it says something plain. Getting in is close to free. Getting out is the trade.
The yardstick is straight
The obvious objection is that our ruler is bent. If Deribit's mark sat nearer the offer than the bid, every buy would look cheap and every sell expensive, and nothing real would be happening in the book at all. It is worth killing that idea before anything else.
Let's write down where mark sits inside its own quoted book:
where is the best bid, is the best ask and is the mark price. A value of means mark is exactly the mid. means it sits on the offer.
Across 52,672 quote snapshots on Bitcoin options inside 45 days to expiry, taken every ten minutes between 7 and 14 September 2026, the median comes back 0.5000. The band below it and the band above it give the same answer.
So the ruler is straight, and the asymmetry is in the fills rather than in the reference.
The same snapshots hand us the width, namely a median quoted half-spread in that mid-premium band of 6.25% of mark. That is what the screen says each leg should cost, what makes a round trip at the quoted extremes
against a realised round trip of of premium, taking August as the example.
The screen overstates that round trip by roughly six times. Worse, it splits it down the middle. The tape does not.
Where the asymmetry lives
Two cuts locate it.
By tenor, the penalty piles into the front, namely where the book is thinnest. At 0 to 7 days to expiry the median sell runs -3.63% against a median buy of +0.13%, on 7,643 buys and 7,339 sells over the first thirteen days of September. Push out to 8 to 30 days and it falls to -1.27%. Beyond 30 days the samples thin to a few hundred trades a side, so we keep them out of the argument.
By premium, it is a mid-book phenomenon. On the deepest contracts, at or above 0.0100 BTC, the legs are near enough even at +0.10% and -0.14%. In other words, the exit penalty belongs to exactly the contracts a desk actually rolls.
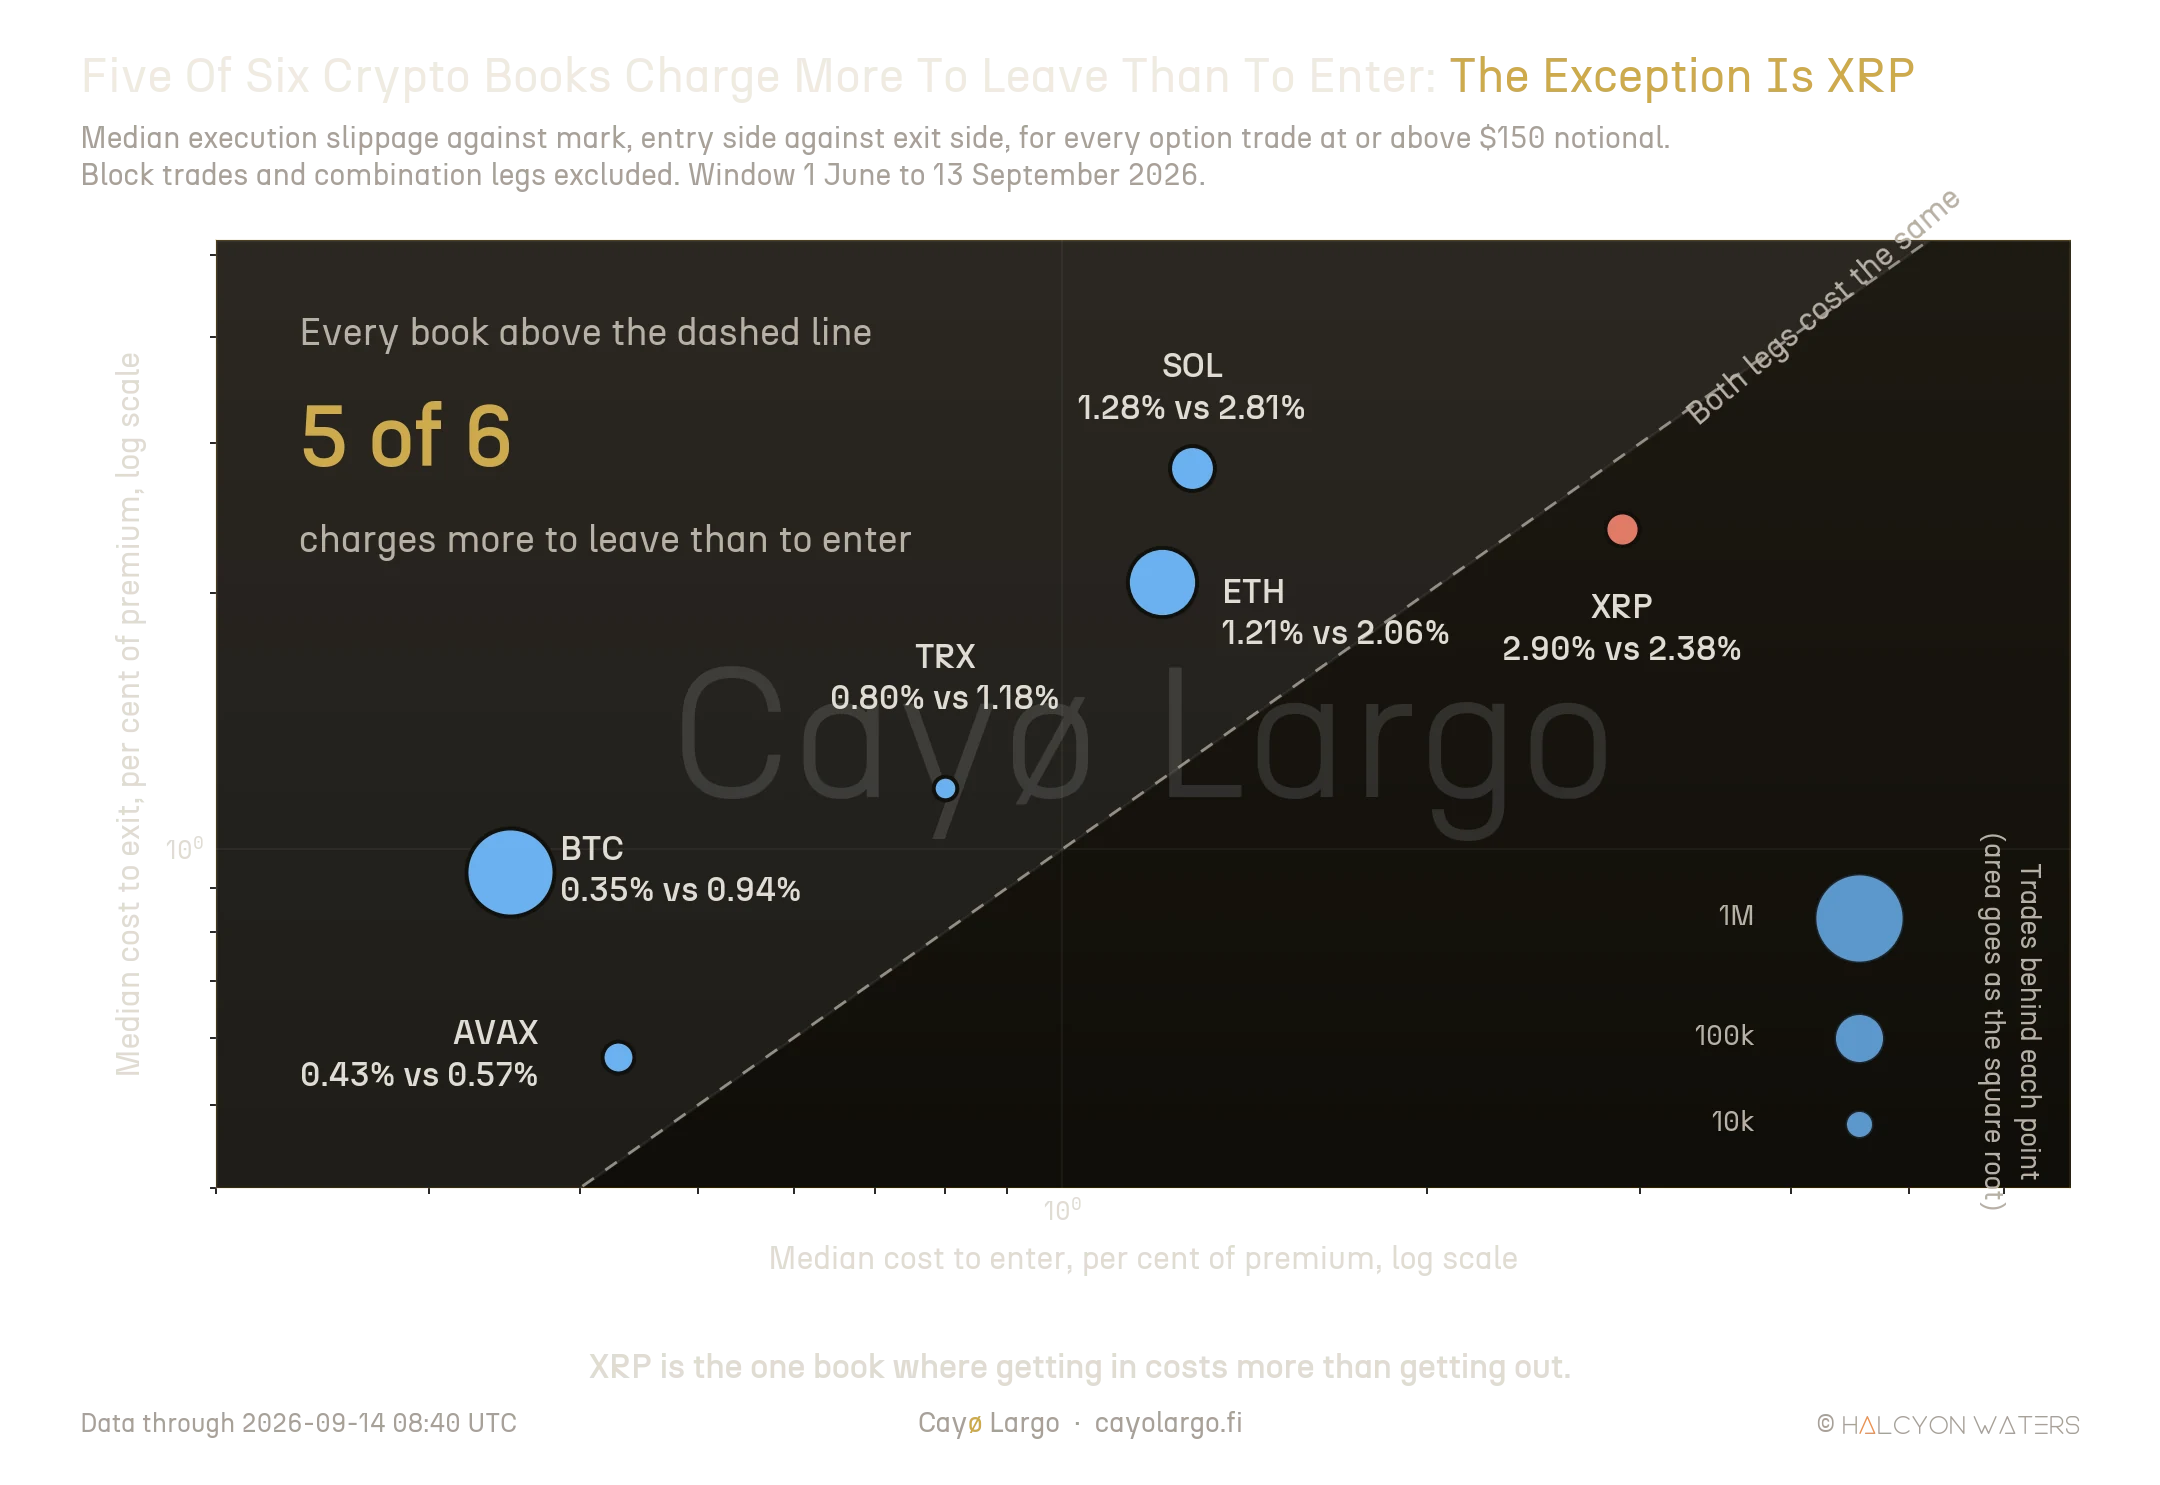
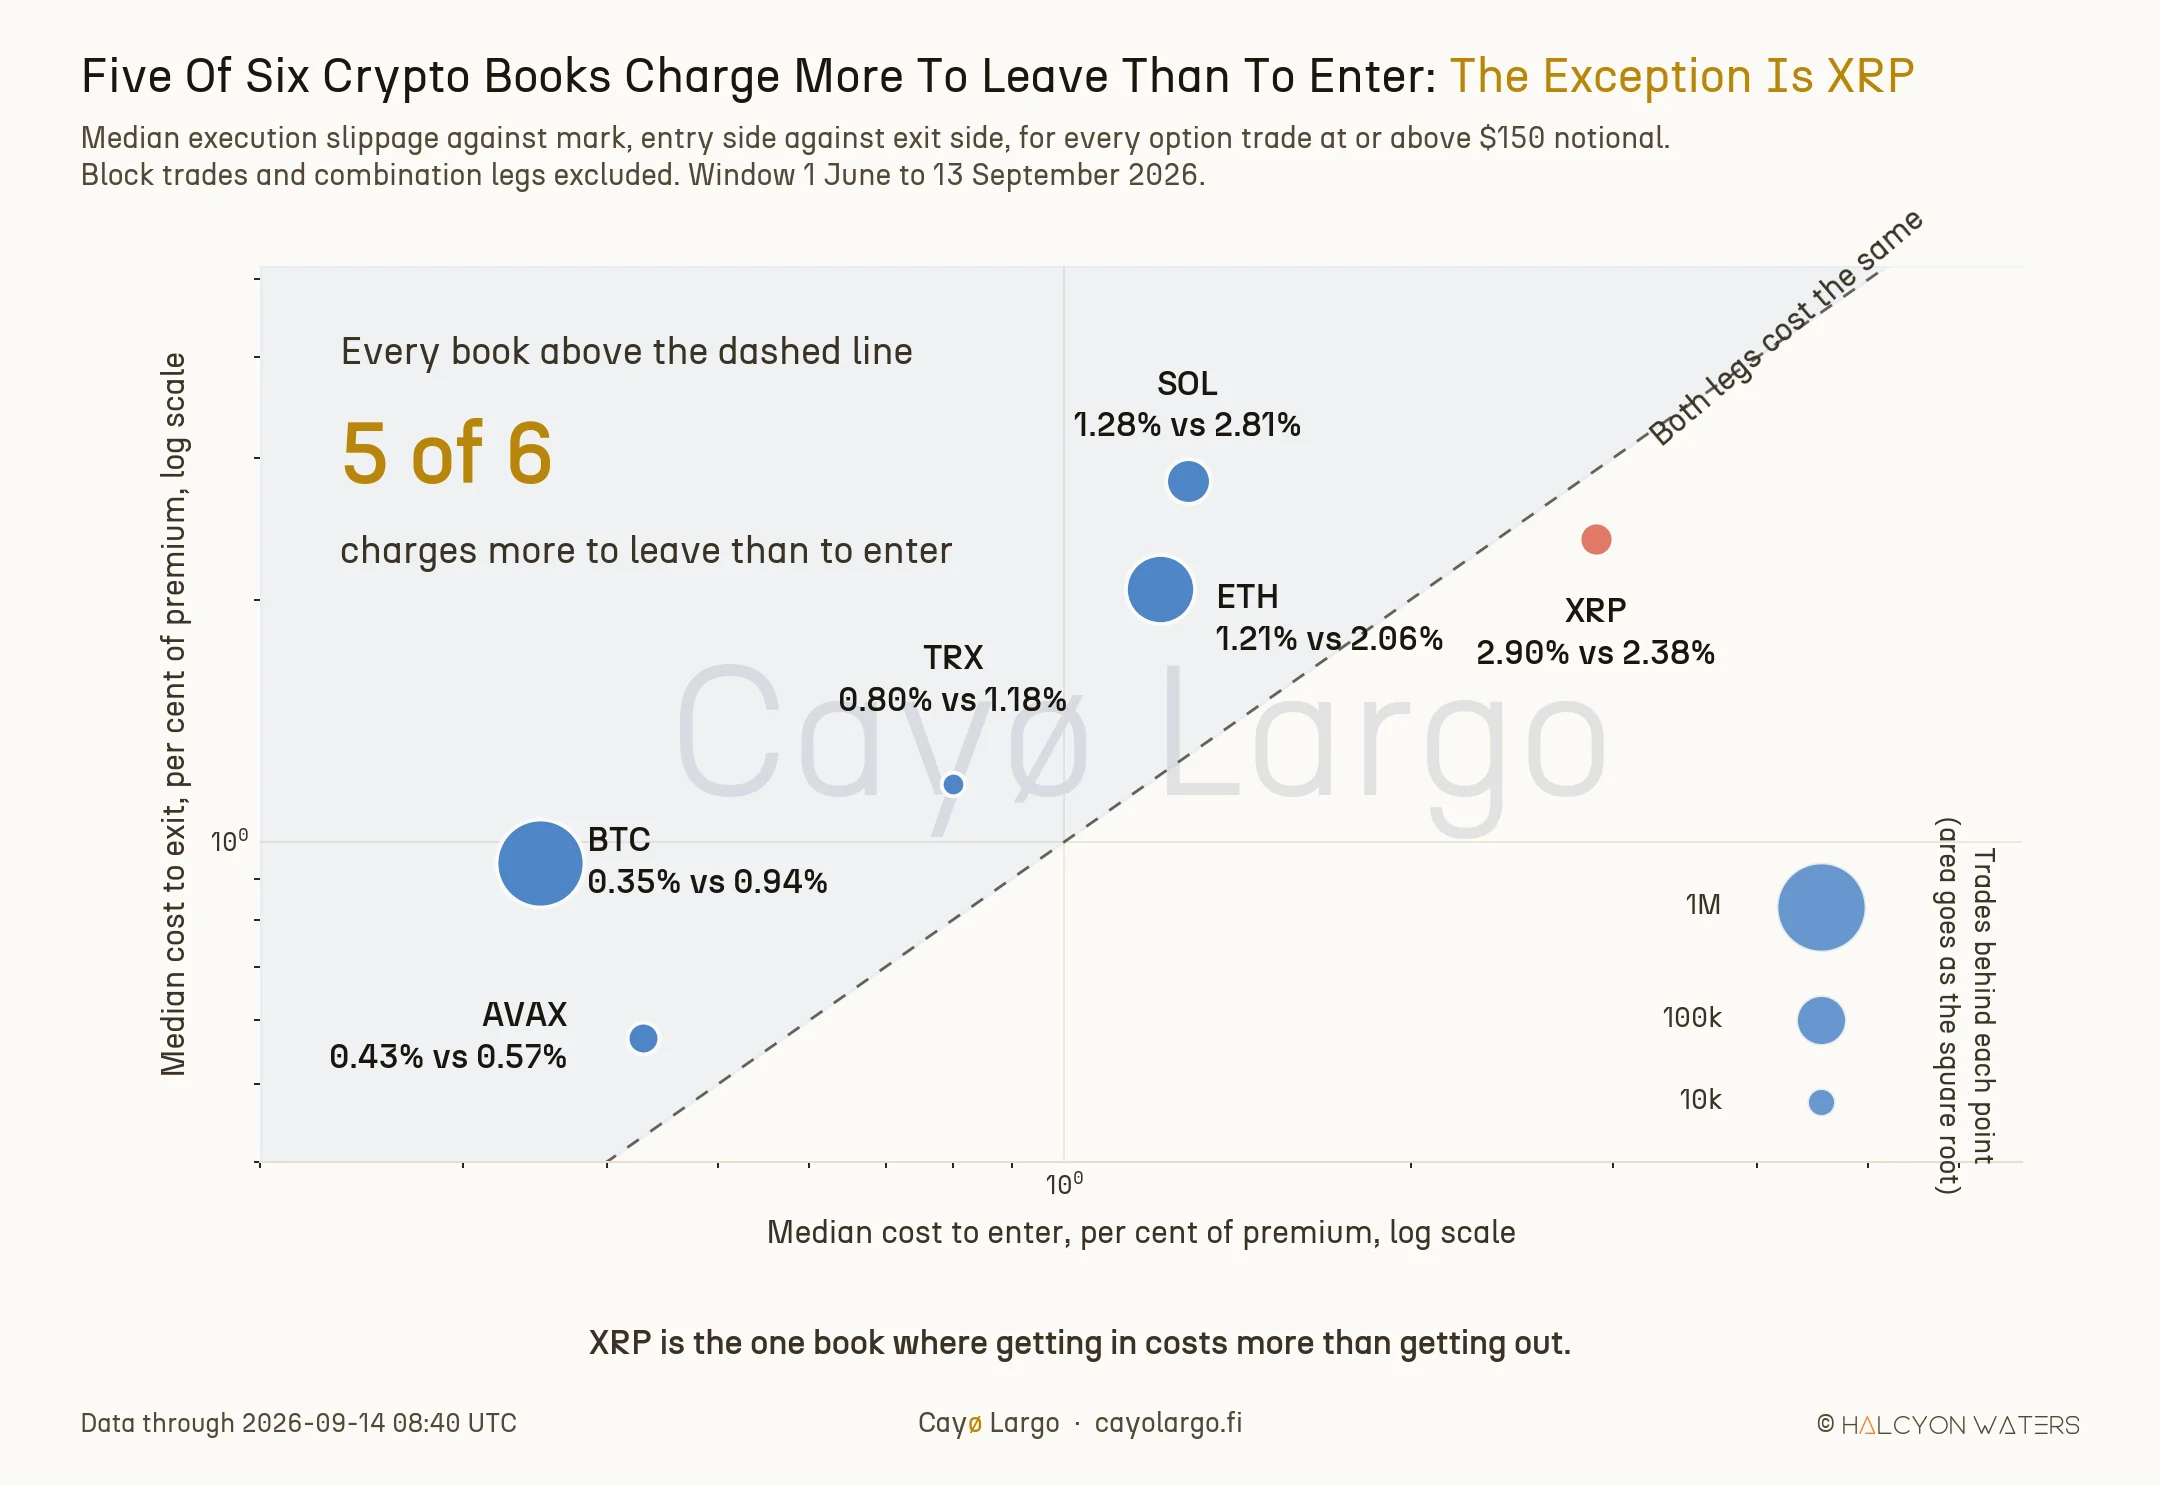
Figure 3: Entry cost on the horizontal axis against exit cost on the vertical, both as a share of premium, both on a log scale. The dashed diagonal is where the two legs cost the same; everything above it pays more to leave. Marker area scales with the square root of the trade count behind each point.
Across the six coins the pattern holds five times and breaks once. One filter for all of them, every trade at or above $150 notional between 1 June and 13 September 2026.
| Coin | Median cost to enter | Median cost to exit | Trades |
|---|---|---|---|
| SOL | 1.28% | 2.81% | 63,639 |
| ETH | 1.21% | 2.06% | 360,400 |
| BTC | 0.35% | 0.94% | 944,103 |
| TRX | 0.80% | 1.18% | 4,878 |
| AVAX | 0.43% | 0.57% | 16,183 |
| XRP | 2.90% | 2.38% | 21,383 |
| All six | - | - | 1,410,586 |
XRP is the exception, and we are not going to pretend we know why. Its book runs about one forty-fourth of Bitcoin's by trade count. That is a candidate explanation. It is not a finding.
How this was measured
Slippage comes from execution_slippage_pct on the option trades endpoint, what carries Deribit's public trade tape with the aggressor direction attached, one row per trade. Direction is the field that makes any of this measurable. An order book snapshot records the state of the market, never which side crossed it. Quoted bid, ask and mark come from the options liquidity endpoint at ten-minute cadence. That is the same feed the live Options Thermography surface reads for volume and depth across the strike and time grid.
Every figure here is a median, and that choice is not cosmetic.
Slippage is a ratio to the option's own premium, so a cheap contract divides by a small number. On Bitcoin options priced below 0.0005 BTC one tick is 41.7% of mark. The arithmetic mean of buy slippage in that band reaches +3,125% across 17,654 trades. The median sits at +11.94%. Means are useless down there. Medians are not, what is exactly why the archive's cohort layer publishes buy_slippage_median and sell_slippage_median rather than averages, and why that cheapest band is read on its own rather than pooled with the rest.
Windows, so they can be checked: monthly medians over 1 April to 13 September 2026; the tenor split over 1 to 13 September; cross-coin over 1 June to 13 September; quote geometry over 7 to 14 September. percentile_cont is unavailable in our read-only analysis path, so medians are taken by rank, averaging the two middle observations where the count is even.
What this does not say
Here is what we cannot tell you.
The comparison between the quoted spread and the realised fills is not tick-synchronised. Quote snapshots cover the clock evenly, while trades do not and instead cluster when the book is tight. So some part of the gap between a 6.25% quoted half-spread and the 2.0% the tape pays is when people choose to trade. Not price improvement handed out at a constant rate. We have not separated the two.
That caveat leaves the main finding standing. The buy against sell asymmetry is measured inside the tape, on the same instruments at the same moments, so whatever selects the moment selects it for both sides at once.
Blocks and combination legs are excluded throughout, because negotiated execution is a different animal and deserves its own study.
And we have not established the mechanism. Two readings are on the table and we have tested neither. Cao and Wei, working on equity options over 1996 to 2004, report that "compared with the inventory risk, information asymmetry plays a more dominant role in influencing options liquidity", and also that call and put spreads move in opposite directions with the underlying market. That points at adverse selection on the side a market maker is most exposed to. The alternative is plain inventory preference, and separating the two needs a study of its own, and we are not going to guess in the meantime.
The distinction itself is not new either. Anand and Muravyev, studying auction mechanisms in equity options in January 2025, found that when auction use was restricted "quoted spreads decline, while the impact on effective spreads is more muted". The two quantities move independently, and crypto options are no exception. What is new is the measurement on this market.
What a desk does with it
Price the two legs separately.
A structure modelled at mark on both sides understates what it costs. One modelled at the quoted bid and offer overstates it, by about six times on the round trip. Our own four traps between a crypto-options backtest and a profit prices entries at the offer and exits at the bid deliberately, as the conservative bound. The tape says the honest number sits between the two bounds, and much nearer one of them.
The consequence bites hardest where the penalty is largest, namely the front week, where the median exit costs 3.63% of premium and posted depth is thinnest. A short-dated structure you have to close rather than hold to expiry pays that. It appears nowhere on the screen before you trade.
Take the spread off the screen and you have a quote. Take it off the tape and you have a bill. Only one of the two ever arrives.
References
Gavin, Butterfly Course Part 4: Trading Rules, Options Trading IQ, 20 August 2013. Advises selecting underlyings by liquidity because narrower quoted spreads mean less slippage, which is the standard treatment of the quoted width as the cost you pay.
M. Cao and J. Wei, Commonality in Liquidity: Evidence from the Option Market, OptionMetrics research, around 2023. Studies equity options over January 1996 to December 2004 and finds information asymmetry dominates inventory risk in setting options liquidity, with call and put spreads responding in opposite directions to the underlying market.
Cryptarbitrage, Option Backtest: Selling Weekend Vol, Revisited, Deribit Insights, 21 May 2025. A multi-year Deribit backtest that states its cost assumption openly as a flat 5% slippage on premiums collected, alongside exchange fees.
A. Anand and D. Muravyev, Do Auctions Impact Quote Competition?, OptionMetrics research, 15 January 2025. Finds that restricting auction use narrows quoted spreads while leaving effective spreads much less changed, a direct demonstration that the quoted and realised measures are different quantities.
Imran Lakha, quoting Mark Anderson, X, 20 August 2026. Reports that a large short-dated options book spends roughly 55% of its profit and loss on slippage, stated as a single round-trip figure.
Frequently Asked Questions
How much does it cost to exit a Bitcoin option position on Deribit?
Measured on the public trade tape from April to September 2026, the median seller of a mid-priced Bitcoin option executed between 1.4% and 2.9% below the exchange's mark price, depending on the month. The median buyer executed at mark. The exit leg therefore carries almost all of the round-trip execution cost, which comes to about 2% of premium in total.
Is Deribit's mark price the mid of the order book?
Yes, at the median. Across 52,672 quote snapshots on Bitcoin options inside 45 days to expiry, the mark price sat at exactly 0.5000 of the distance between the best bid and the best ask. That makes mark a fair reference point for measuring execution, and it rules out a mark skewed toward the offer as an explanation for the buy and sell asymmetry.
Should a crypto options backtest assume fills at the bid and the offer?
That assumption is conservative rather than accurate. The median quoted half-spread on mid-priced Bitcoin options is 6.25% of premium, so a round trip priced at the quoted extremes costs 12.5%. The tape pays about 2%. Pricing at mark is too kind and pricing at the quoted extremes is too harsh, and neither captures that the two legs differ.
Why is options slippage measured as a share of premium rather than in dollars?
Because slippage is defined relative to the option's own mark price. That makes the statistic scale-free and comparable across strikes, but it also means a cheap option divides by a small number. On Deribit options priced under 0.0005 BTC, one tick is 41.7% of mark, so those contracts are read separately from the rest.
Related Articles
4 Traps Between a Crypto-Options Backtest and a Profit
Four crypto-options signals that shine in backtest and die at real fills. What the spread, the wrong vehicle, overlapping windows and a trending coin cost you.
How Noisy Is the 25-Delta Risk Reversal?
BTC's front-week 25-delta risk reversal moves 2.07 volatility points every ten minutes and travels only a third of the expected distance across a day.