Crypto Covered Calls, Part 1: How to Choose and Cap the Call
This series introduces crypto covered calls, with Bitcoin on Deribit as the worked example. They pay a holder a premium in the coin itself, on a coin kept anyway. Part 1 reads a real option chain, chooses the call and follows it through 2026. One rally sank the plain call; a cheaper second call kept the stack roughly level.
Suppose you hold one bitcoin and have no intention of selling it. It is 08:00 UTC on Friday, 28 August 2026. The August options have just settled and BTC is trading at $79,713. Deribit's screen shows twelve expiry dates with hundreds of calls between them. Somewhere on that screen is the one call worth selling against it. This note shows how to find it.
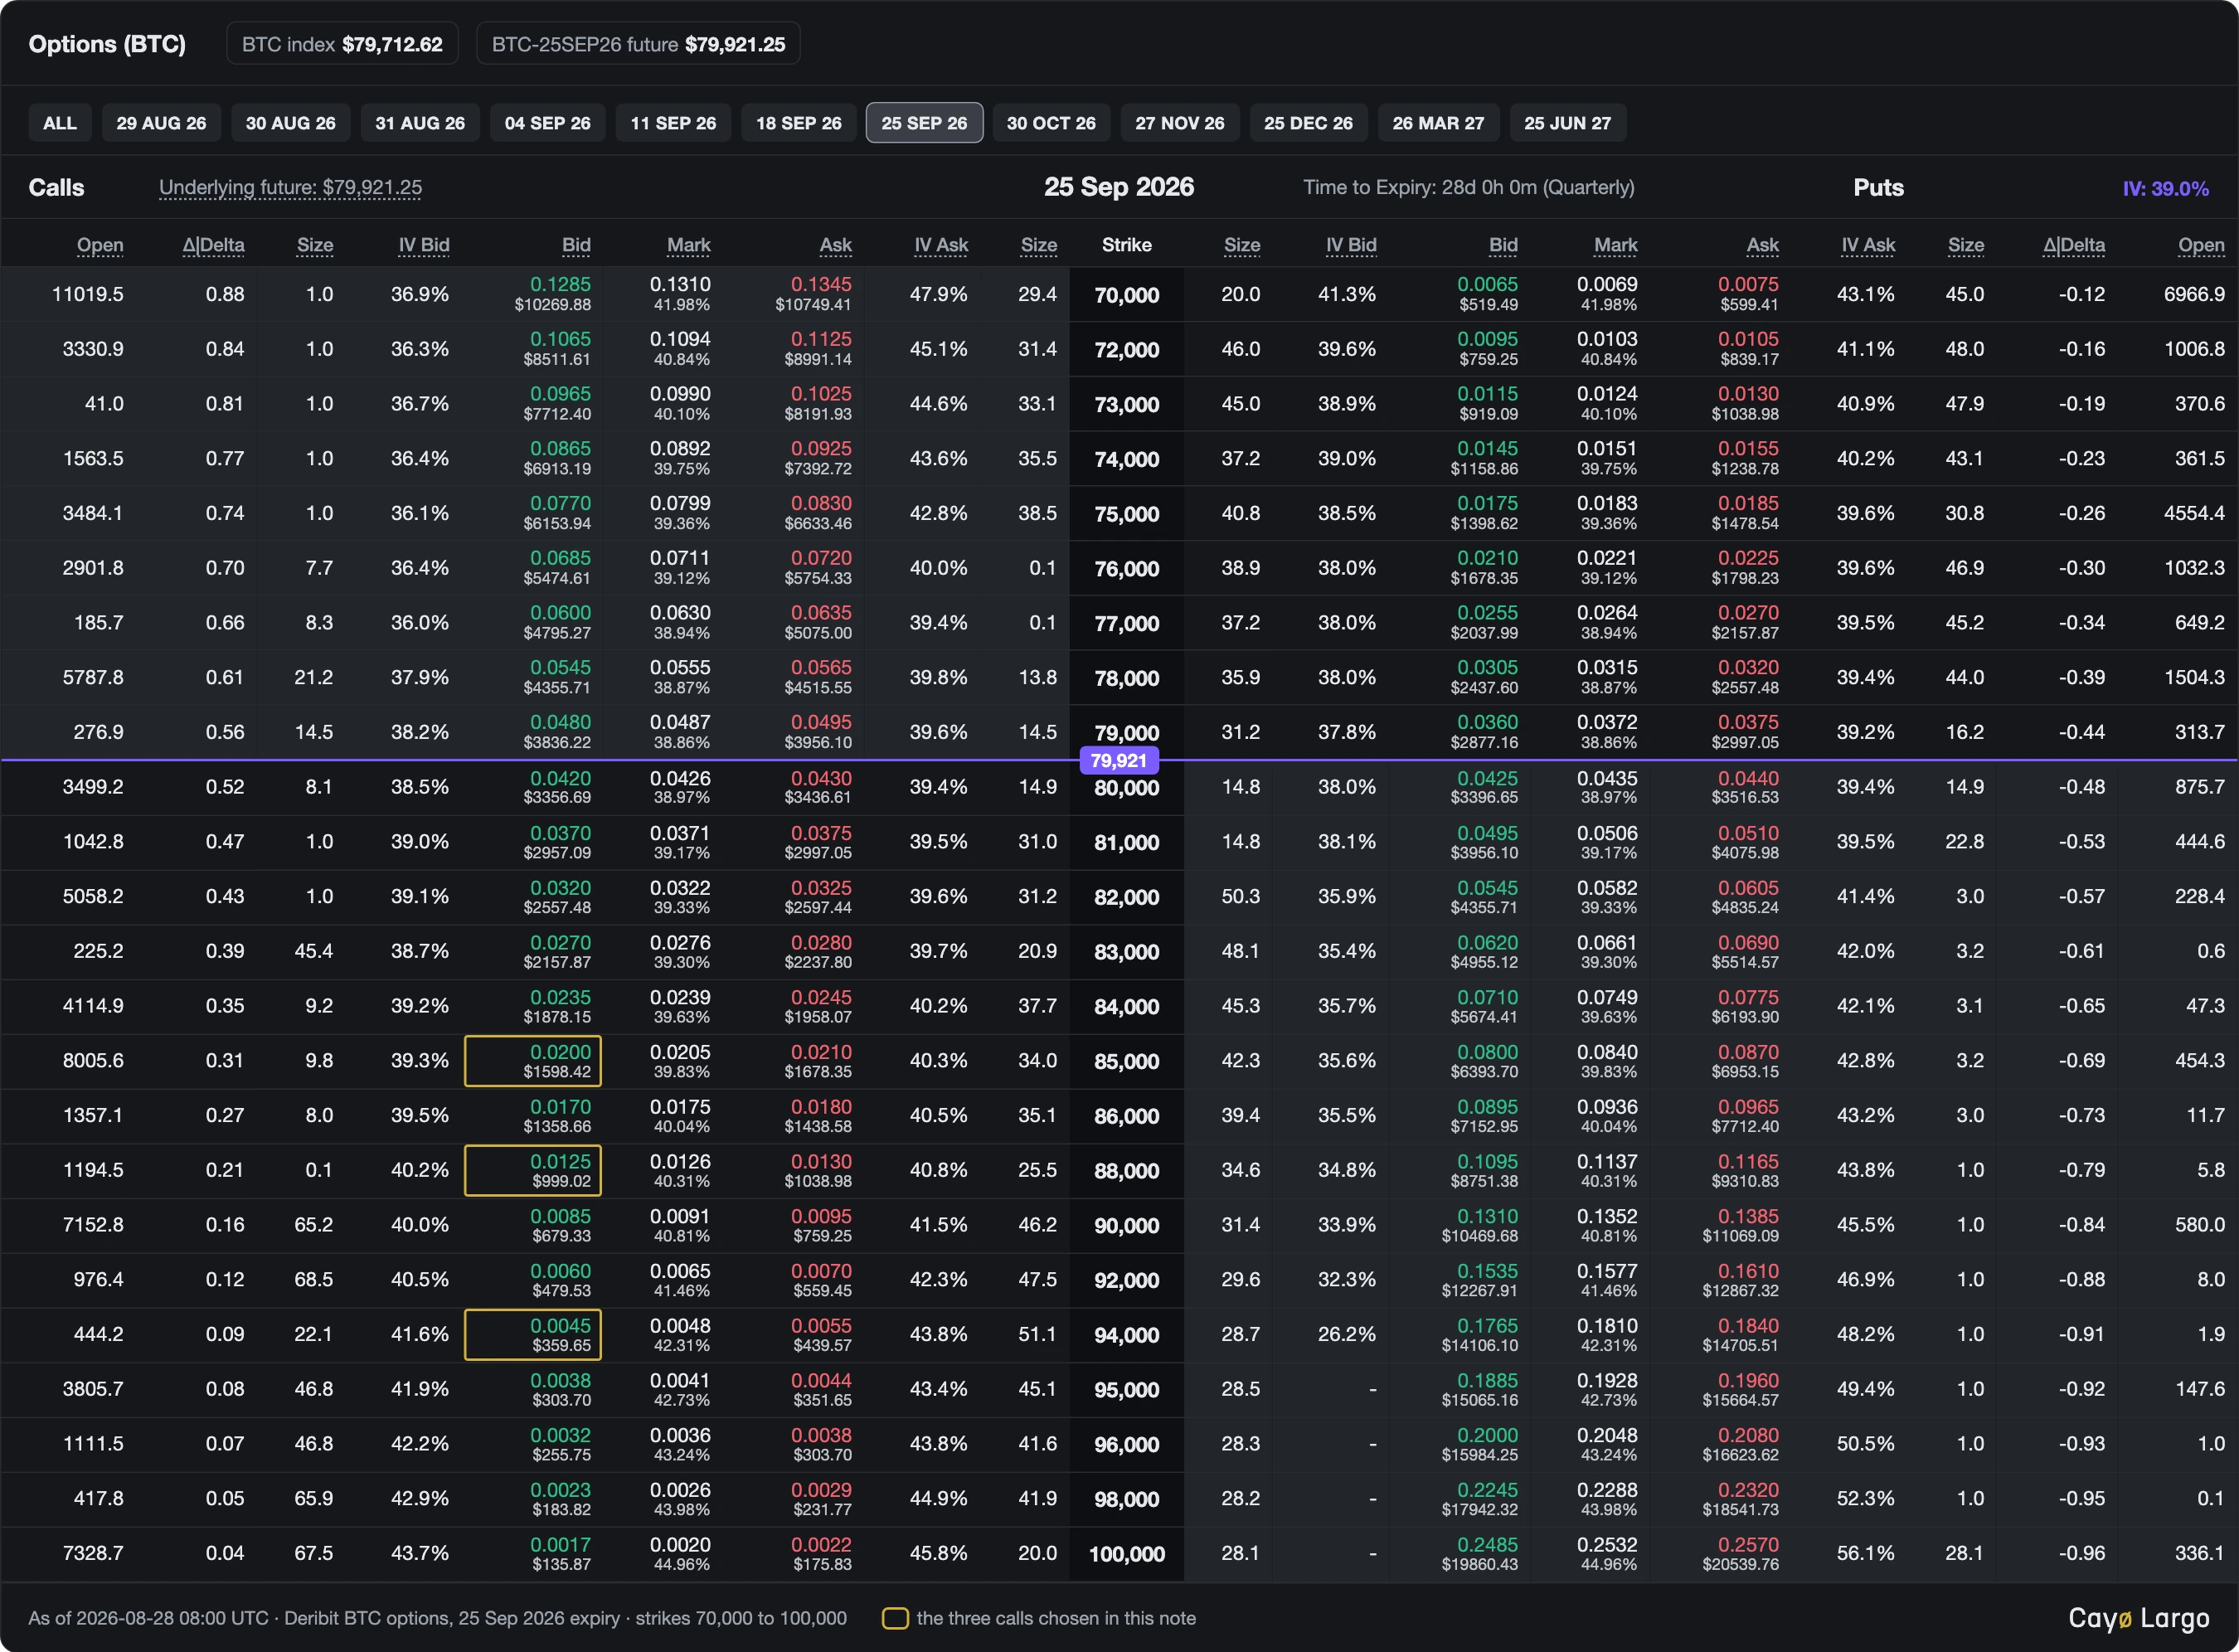
Figure 1: The September chain as it stood at 08:00 UTC on 28 August, laid out the way Deribit's options screen shows it and filled from our archive. Calls sit on the left, puts on the right and strikes down the middle. Every price is in BTC with its dollar value beneath it. The purple line marks the September future at 79,921 and the gold boxes are the three calls this note chooses. The bid and ask implied volatilities are our own calculation from the quotes. Click to enlarge.
We read the chain as it stood at that minute, one column at a time, then choose three candidate calls. For each we work out what it pays in sats (satoshis, the hundred-millionth units of one bitcoin) and as a yield, together with the settlement price above which it stops paying. Then we look at what the price on the screen hides. The three calls come from a fixed rule, written down before we looked at how September settled. That lets the later sections do something a single example cannot: follow the same rule through every monthly cycle of 2026, the losing ones included, then test the simplest protection against its worst month. This is the first part of a series on covered calls. If you already trade crypto options, the sections on the price you actually get and on the capped call are the ones to read.
What is a covered call when the coin is Bitcoin?
A covered call is a long position in an asset plus a short call on it. You collect a premium today and in exchange you give up the part of any rally that lands above the strike. The stock version, taught on every options channel, involves 100 shares per contract, dividends, early assignment and shares being called away. On Deribit none of that applies.
BTC options on Deribit are inverse options: they are quoted, margined and settled in BTC itself. Deribit has always carried more than 90% of exchange trading in crypto options and lists only inverse products, as an academic study of these contracts sets out, together with how their pricing and hedging differ from the textbook kind. Deribit's own introduction to its USDC-settled contracts describes the inverse ones as better suited to traders who keep their funds in the coin, naming long-term holders and miners. The options are European, so nobody can exercise early. They settle at 08:00 UTC on a 30-minute time-weighted average of the index. Since 1 August 2026 an in-the-money option first settles into a future, which then settles into cash, a change Deribit explained in its note on the inverse delivery process. The amount paid is unchanged: an in-the-money call pays (index minus strike) divided by the index, in BTC.
For one BTC covered, the change in the stack at expiry is therefore
where is the change in the number of BTC held, is the premium received in BTC, is the settlement price in USD and is the strike. Below the strike the call expires worthless and the whole premium stays in the stack. Above it, the payout grows with every dollar, which puts a precise number on the level where the trade stops paying:
where is the settlement price at which the payout exactly equals the premium. Above the stack ends the cycle smaller than it started.
That is the sats view. The dollar view is the one the stock courses teach. It is worth holding both. In dollars, a covered call that finishes in the money leaves you with the strike plus the premium. Had BTC settled at $100,000, the 85,000 call below would have taken 13.0M sats from a one-coin stack, while the stack left over would still be worth the $85,000 strike plus the premium's $2,000. A holder who counts in sats and one who counts in dollars are looking at the same trade through different windows.
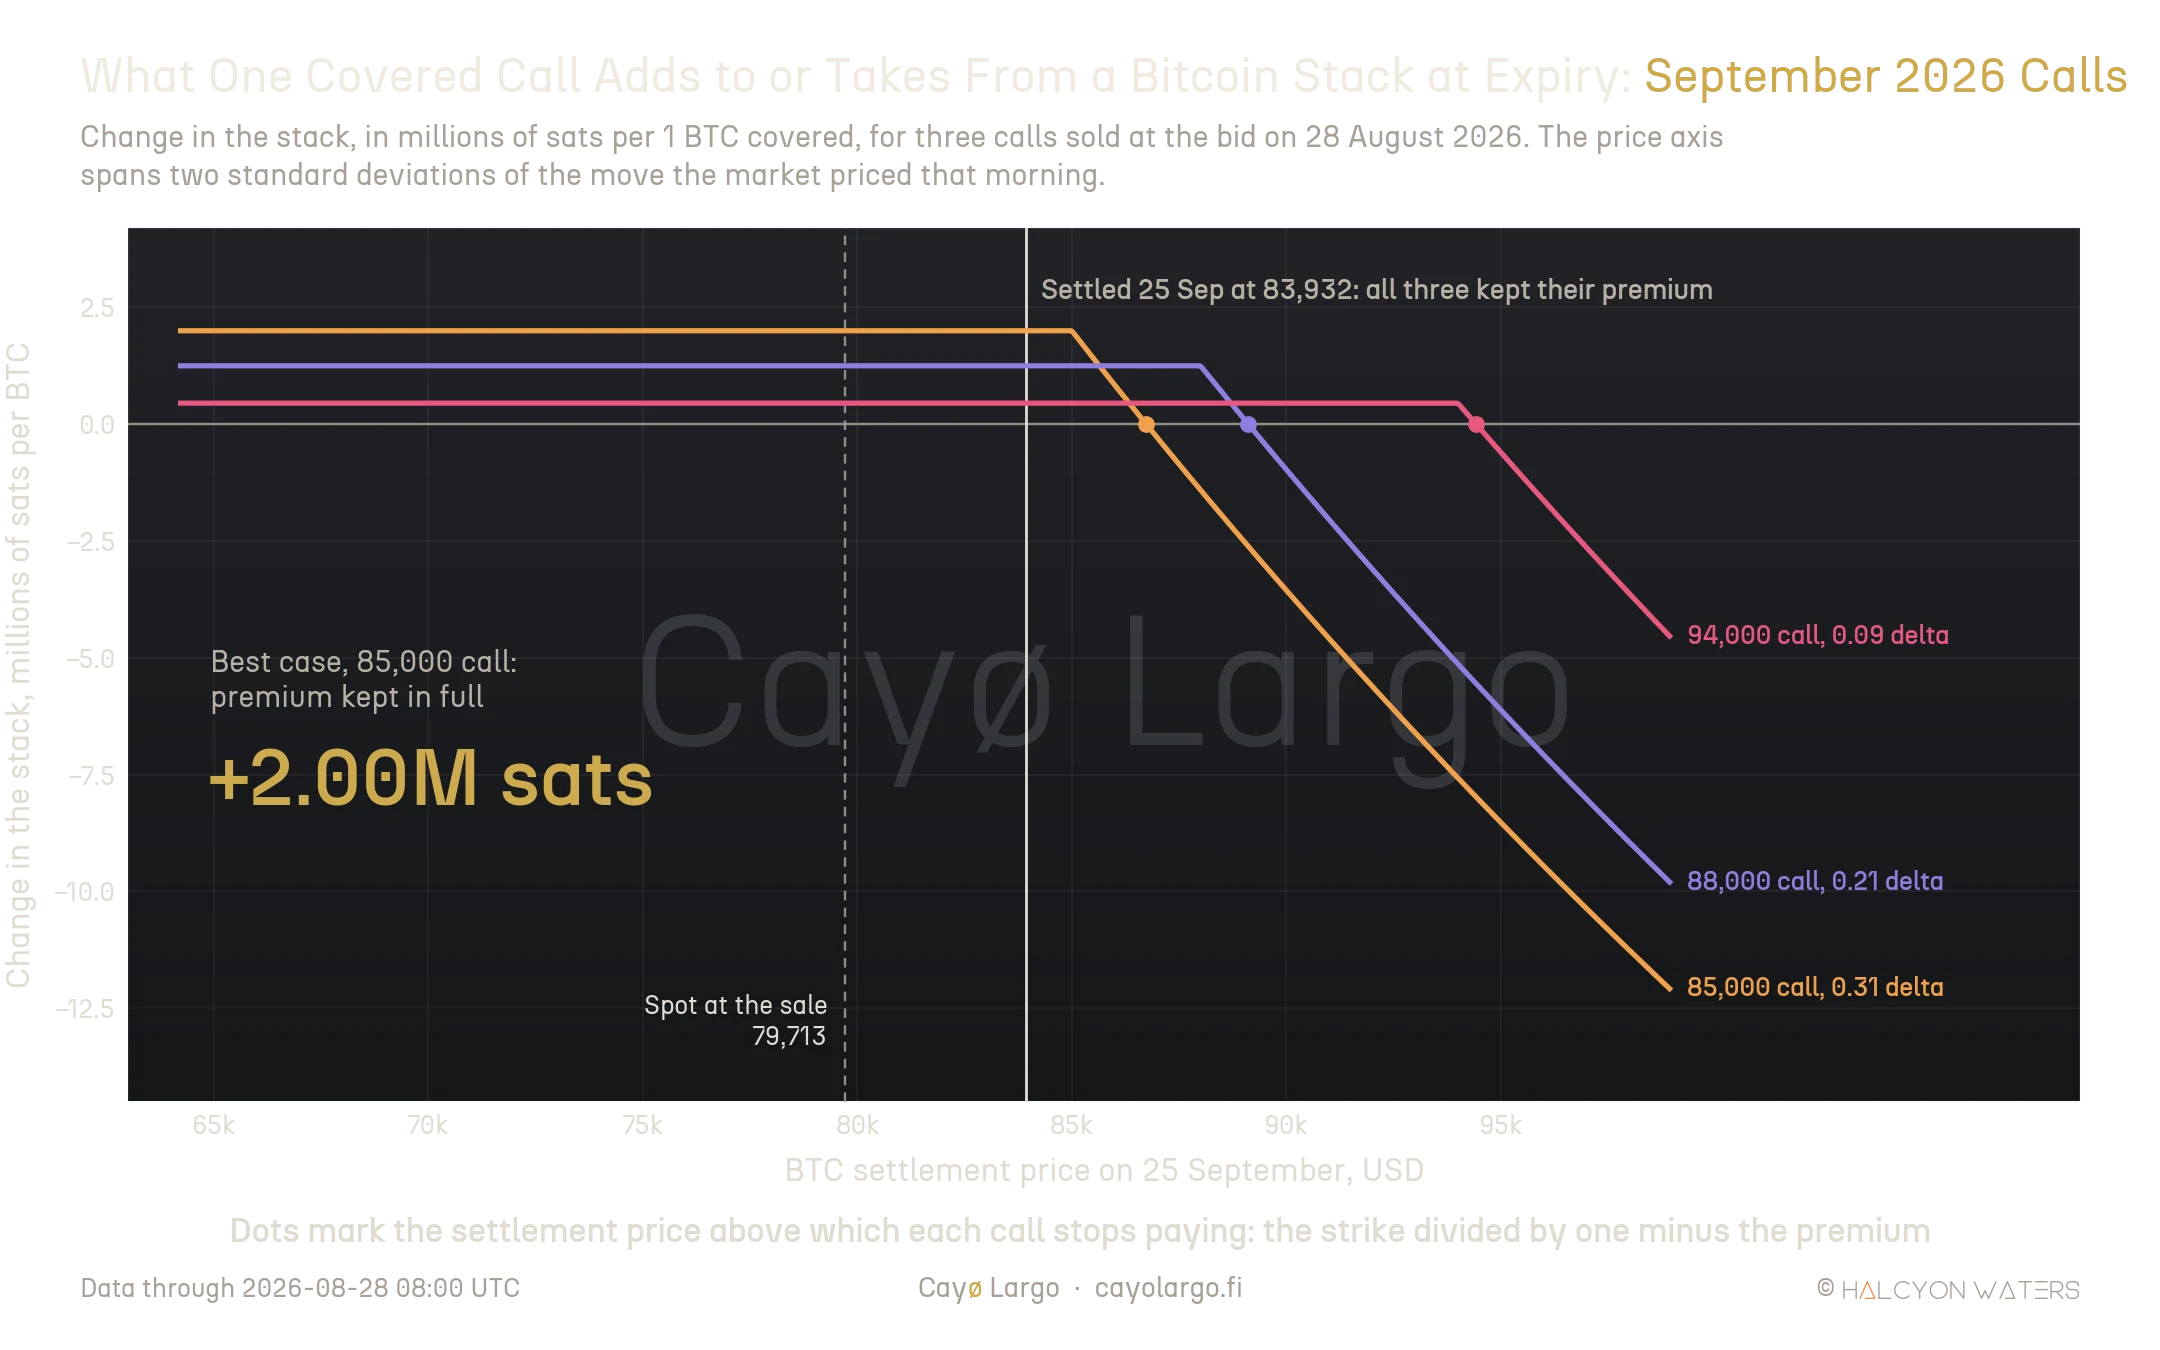
Figure 2: What each of the three calls adds to or takes from a one-bitcoin stack at expiry, across two standard deviations of the move the market priced that morning. The flat segment is the premium kept below the strike. The dot on the zero line marks the break-even, the settlement price at which the payout equals the premium. The solid line is where BTC actually settled on 25 September: all three calls kept their premium.
What was on the screen at 08:00?
Twelve expiries were listed that morning: three dailies, three Friday weeklies, two monthlies and four quarterlies. The 25 September contract is both the September monthly and a quarterly, which is why it carries the most strikes and by far the most open interest, about 95,739 BTC of open calls. The last column is the at-the-money implied volatility (ATM IV), the volatility the market was pricing into the strike nearest the forward. Our expiration calendar tracks the same dates live.
| Expiry (days left) | Type | Calls listed (with a bid) | ATM IV |
|---|---|---|---|
| 29 Aug, Sat (1) | daily | 22 (20) | 50.6% |
| 30 Aug, Sun (2) | daily | 28 (28) | 40.5% |
| 31 Aug, Mon (3) | daily | 28 (28) | 39.1% |
| 4 Sep, Fri (7) | weekly | 32 (32) | 40.5% |
| 11 Sep, Fri (14) | weekly | 27 (27) | 39.0% |
| 18 Sep, Fri (21) | weekly | 17 (17) | 39.5% |
| 25 Sep, Fri (28) | quarterly | 54 (48) | 39.0% |
| 30 Oct, Fri (63) | monthly | 48 (48) | 38.9% |
| 27 Nov, Fri (91) | monthly | 38 (38) | 40.2% |
| 25 Dec, Fri (119) | quarterly | 53 (53) | 41.1% |
| 26 Mar 2027, Fri (210) | quarterly | 47 (47) | 42.0% |
| 25 Jun 2027, Fri (301) | quarterly | 45 (45) | 42.9% |
Days left count from 08:00 on 28 August to each expiry's own 08:00 settlement. Every other expiry sat between 38.9% and 42.9%. The one-day Saturday contract was the outlier at 50.6%, a reminder that the shortest options price the next few hours rather than a month. For a first covered call, the September quarterly is the natural place to start: a four-week cycle, the deepest list of strikes and the most interest.
How to read one line of the option chain?
Take BTC-25SEP26-85000-C. It is a call on BTC, expiring on 25 September 2026, with a strike of $85,000. Every price on the line is quoted in BTC per one BTC of underlying, so a premium of 0.0200 means 2% of a coin, or 2,000,000 sats. The columns a seller needs are these:
- Bid and ask. The best price someone will pay for the call and the best price someone will sell it for. A covered-call seller hits the bid.
- Mark. Deribit's own estimate of fair value, used for margin and for profit and loss. It is not a price anyone has offered you.
- Delta. How much the option's value moves for a small move in BTC. It is also a rough gauge of the chance it finishes in the money. Jake Broe's covered-call lesson uses it exactly this way, as a rough probability. Our note on why knowing the Greeks is not enough on Deribit explains why the gauge is rough.
- Size at the bid. How many BTC of calls the best bid is willing to buy.
Here is the September quarterly around the calls that matter, with each strike's distance above the $79,713 spot:
| Strike (above spot) | Bid / ask, BTC | Delta | Size at bid, BTC |
|---|---|---|---|
| 80,000 (+0.4%) | 0.0420 / 0.0430 | 0.52 | 8.1 |
| 82,000 (+2.9%) | 0.0320 / 0.0325 | 0.43 | 1 |
| 84,000 (+5.4%) | 0.0235 / 0.0245 | 0.35 | 9.2 |
| 85,000 (+6.6%) | 0.0200 / 0.0210 | 0.31 | 9.8 |
| 86,000 (+7.9%) | 0.0170 / 0.0180 | 0.27 | 8 |
| 88,000 (+10.4%) | 0.0125 / 0.0130 | 0.21 | 0.1 |
| 90,000 (+12.9%) | 0.0085 / 0.0095 | 0.16 | 65.2 |
| 92,000 (+15.4%) | 0.0060 / 0.0070 | 0.12 | 68.5 |
| 94,000 (+17.9%) | 0.0045 / 0.0055 | 0.09 | 22.1 |
| 95,000 (+19.2%) | 0.0038 / 0.0044 | 0.08 | 46.8 |
| 96,000 (+20.4%) | 0.0032 / 0.0038 | 0.07 | 46.8 |
| 100,000 (+25.5%) | 0.0017 / 0.0022 | 0.04 | 67.5 |
Read down the bid column and the trade-off is already visible. The premium roughly halves with every 5,000 dollars of strike while the delta falls from a coin flip to a long shot. The same fields, snapshot by snapshot, are served by our options market data endpoint. The implied volatility that sets them, strike by strike, is drawn live on the vol surface explorer.
Three calls, three different bets
A common way to choose is by delta. Many teachers start near 0.30 for income. One quantitative researcher sells 20 to 30 delta calls systematically across many underlyings. The same lesson quoted above recommends a delta of about 30% for covered calls. We take the September calls closest to 0.30, 0.20 and 0.10 delta. For each, the premium is taken at the bid and the yield per cycle is simply that premium as a share of the coin. The annualized figure scales it to a year:
where is the annualized yield, is the premium in BTC per BTC covered and is the number of days to expiry. It is simple rather than compounded. It also assumes every cycle pays the same, which no cycle promises.
| Call (delta) | Premium, sats | Yield (a year) | Stops paying above |
|---|---|---|---|
| 85,000 (0.31) | 2.00M | 2.00% (26.1%) | 86,735 (+8.8%) |
| 88,000 (0.21) | 1.25M | 1.25% (16.3%) | 89,114 (+11.8%) |
| 94,000 (0.09) | 0.45M | 0.45% (5.9%) | 94,425 (+18.5%) |
Premiums are in sats per BTC covered. The yield is per cycle, with its annualized value in brackets. The last column is from the formula above, with its distance from spot. These are three different bets on the same coin. The 85,000 call pays more than four times what the 94,000 pays and gives the stack only 8.8% of room before it starts paying back. The 94,000 call hardly pays at all and asks BTC to rally 18.5% in four weeks before it costs anything. Neither is right in general. Which one suits a holder depends on how much of a rally they are prepared to sell, which is a question the chain cannot answer for you. One options desk head puts it simply: sell the call at the price where you would be glad to sell the coin anyway, not at whatever strike pays the most.
The same bet on twelve expiries
A second rule the teachers repeat is that shorter expiries earn more per year. The projectoption channel's covered-call masterclass shows it on a stock, where the same strike yielded 43.8% annualized on a 37-day cycle against 27.1% on a 337-day one. The chain that morning tells the same story, only louder. Here is the call nearest 0.20 delta on seven of the twelve expiries:
| Expiry (days left) | 0.20-delta strike (above spot) | Premium, % of the coin | Annualized |
|---|---|---|---|
| 29 Aug (1) | 81,500 (+2.2%) | 0.31% | 113.1% |
| 4 Sep (7) | 84,000 (+5.4%) | 0.60% | 31.3% |
| 11 Sep (14) | 86,000 (+7.9%) | 0.75% | 19.6% |
| 25 Sep (28) | 88,000 (+10.4%) | 1.25% | 16.3% |
| 30 Oct (63) | 94,000 (+17.9%) | 1.65% | 9.6% |
| 25 Dec (119) | 102,000 (+28.0%) | 2.40% | 7.4% |
| 25 Jun 2027 (301) | 130,000 (+63.1%) | 3.45% | 4.2% |
On paper the one-day call pays 113.1% a year. The catch is in the second column. Holding the delta fixed moves the strike: the one-day call sits 2.2% above spot, the June 2027 call 63.1% above it. Annualizing the daily assumes you can sell it 365 times at the same odds and rarely pay out. A strike that close to spot gets touched far more often in a year than one 10% away, so the annualized column compares premiums on the same morning and forecasts nothing. Whether short cycles really out-earn long ones once every payout is counted is exactly the kind of question the rest of this series answers with a year of settlements.
Is the price on the screen the price you get?
Not quite. The mark is Deribit's estimate and the bid is what a buyer will pay. A seller receives the bid. Near the money the gap is small. Further out it grows, because the premium itself becomes small while the spread does not shrink with it.
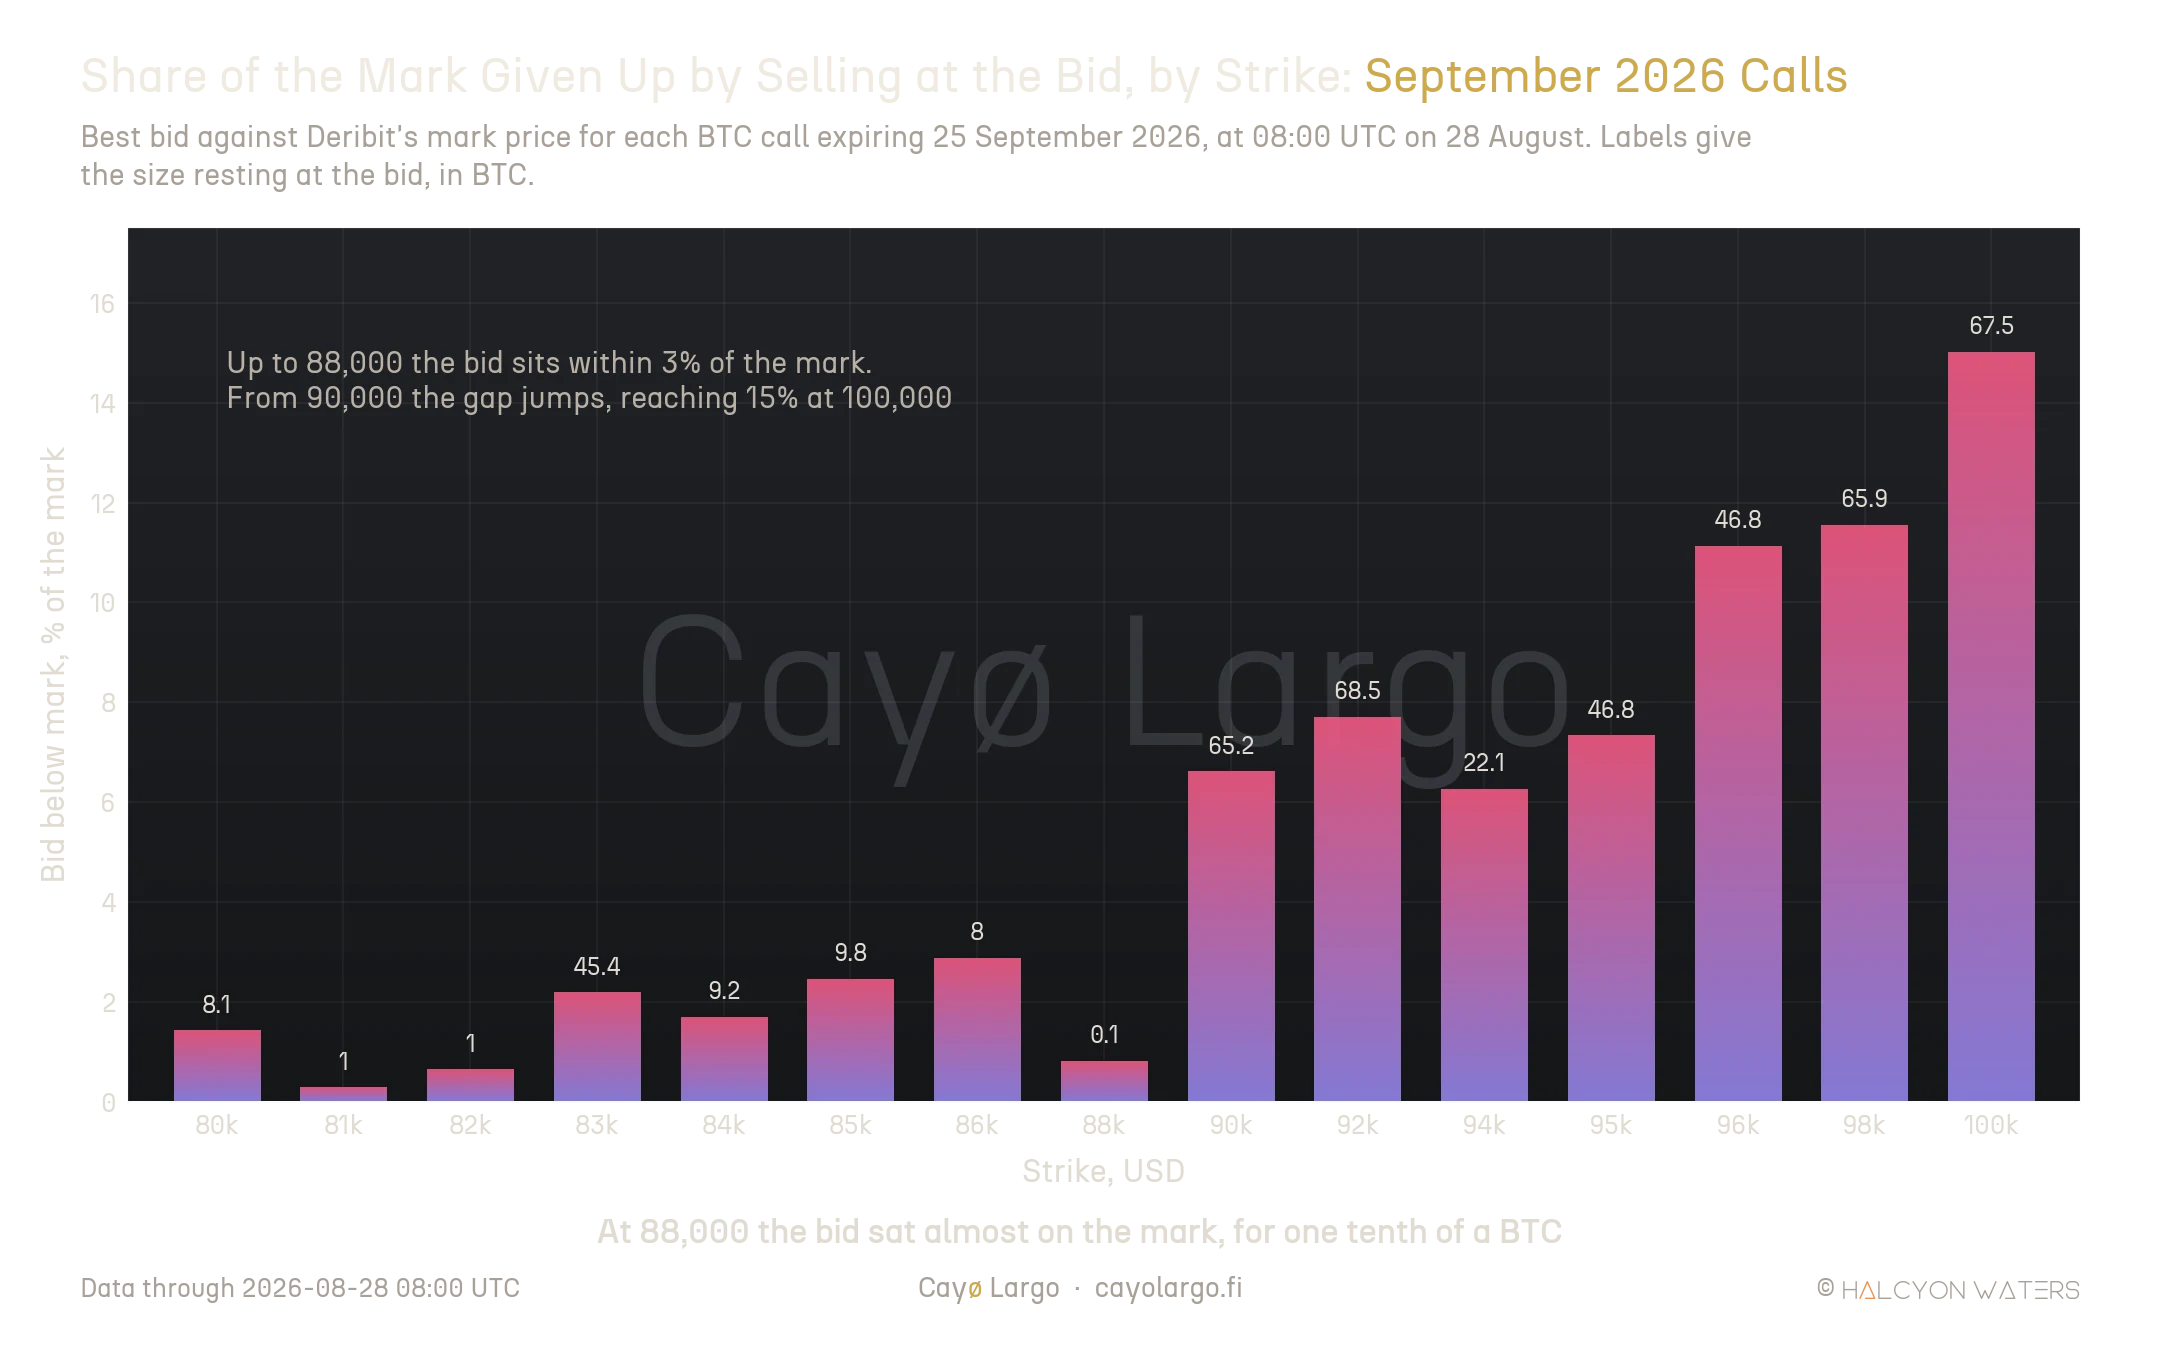
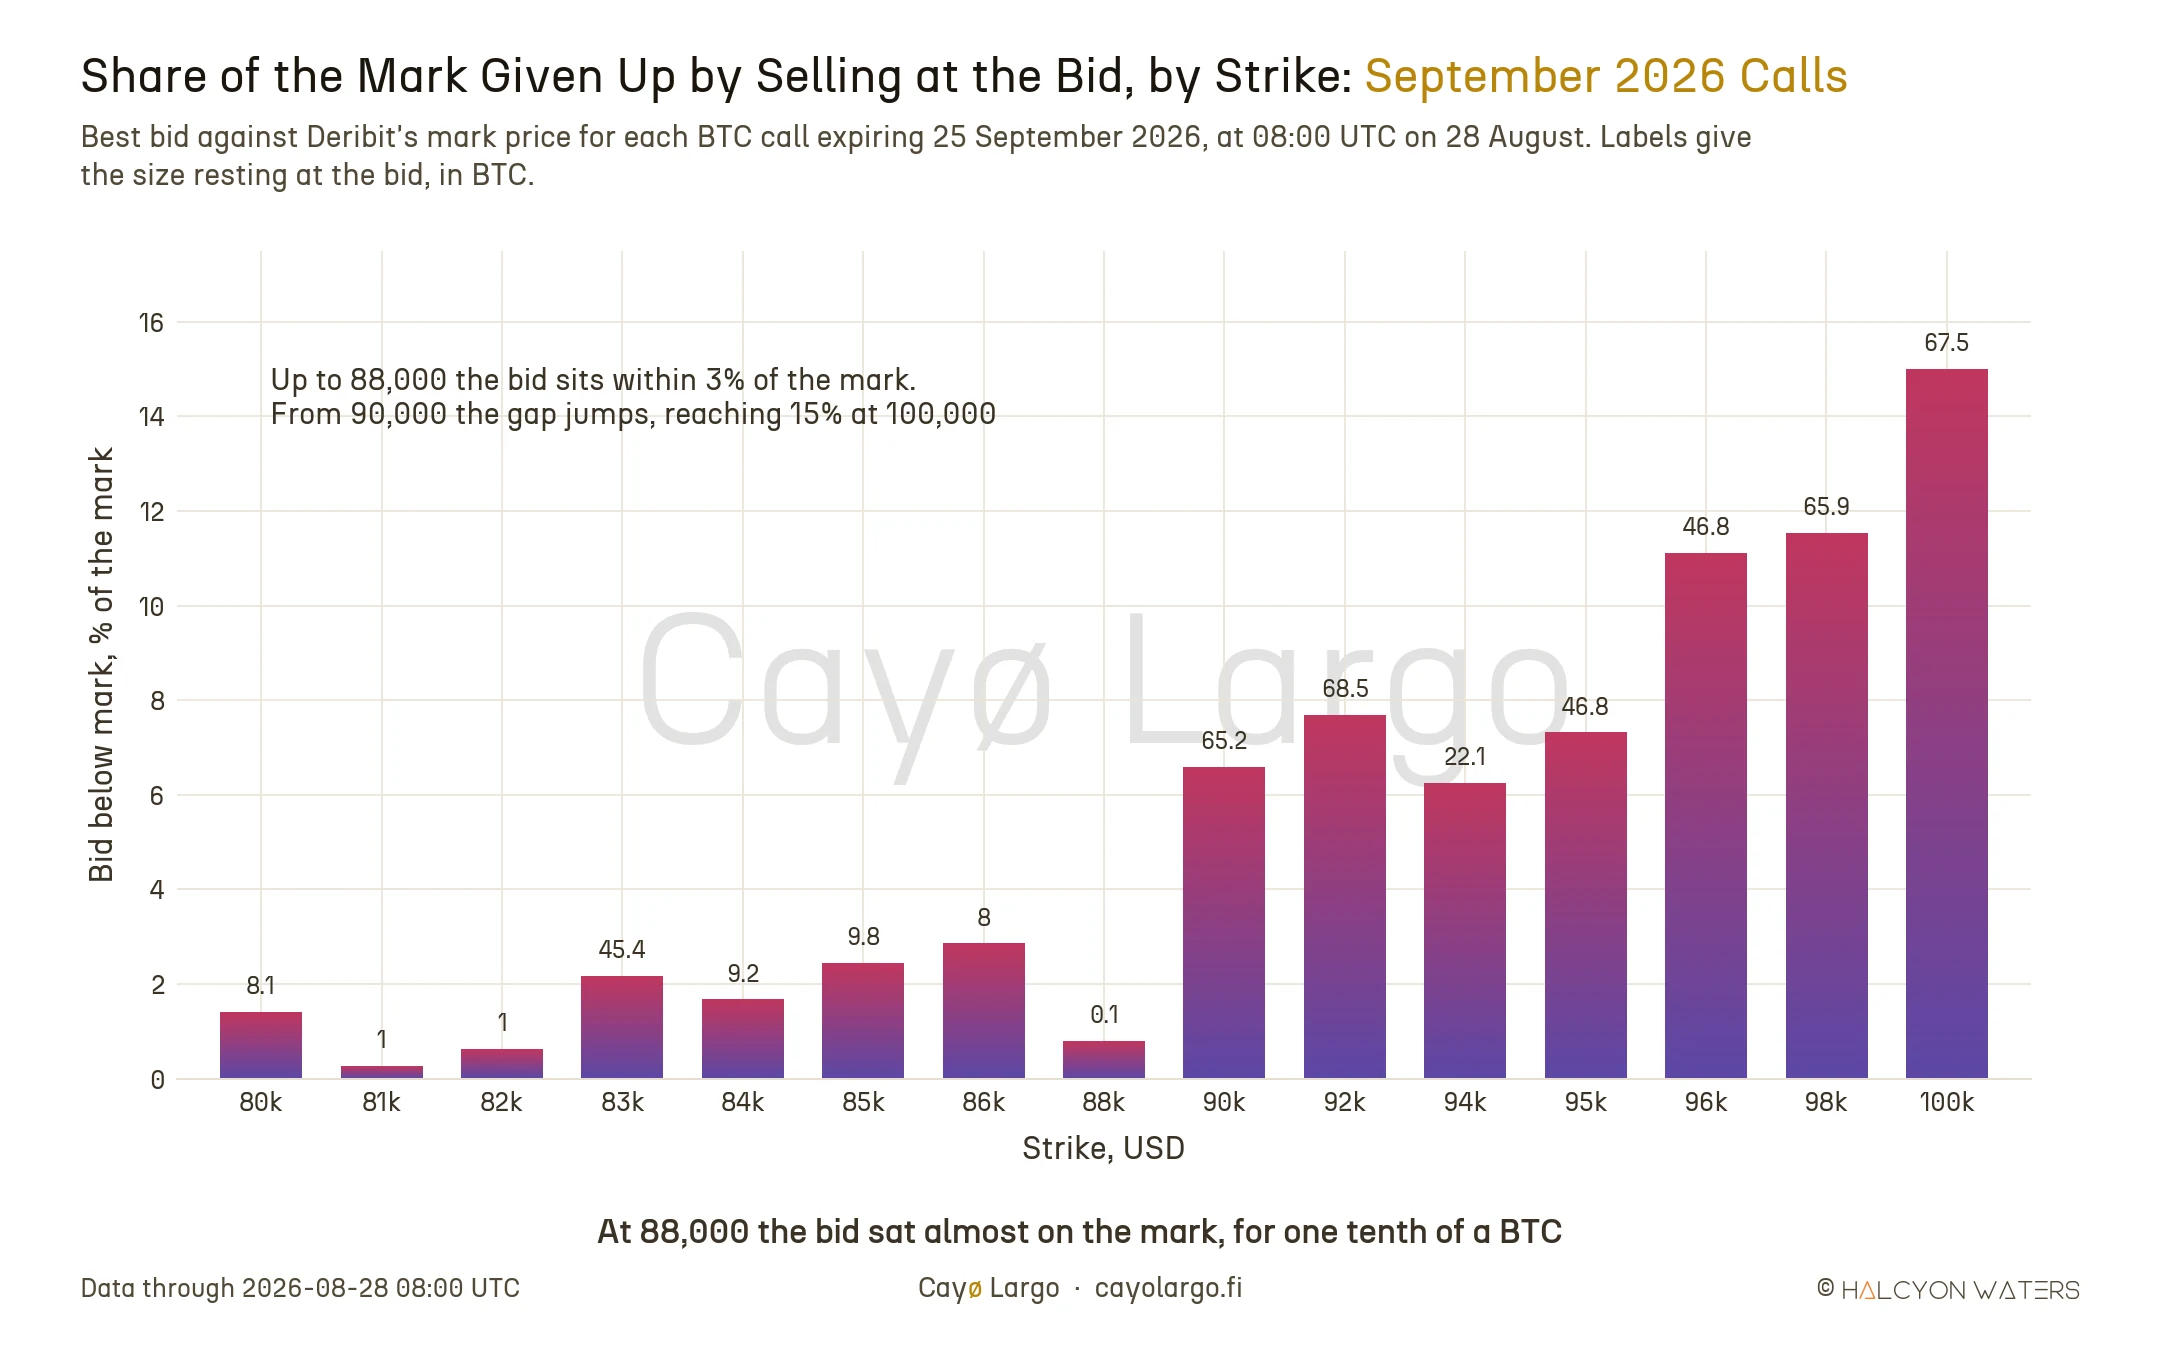
Figure 3: How much of Deribit's mark a seller gives up by selling at the best bid, strike by strike, with the size resting at each bid. The further out of the money, the larger the share of the premium the spread takes.
Up to 88,000 the bid sat within 3% of the mark. From 90,000 the gap jumps, to 6.6% there and 15% at 100,000. A seller of far out-of-the-money calls pays a far larger share of each premium to the spread than a seller near the money. Teachers who assume a fill at the mid are assuming the better half of that gap away.
Size is the second half of the answer. It moves faster than price. The 88,000 call had a bid almost equal to its mark at 08:00, for only 0.1 BTC. At 07:30 that same bid was for 63.8 BTC. By 08:10 it was back at 44.2 BTC. Meanwhile the 94,000 and 95,000 calls, which showed 22.1 and 46.8 BTC at the bid at 08:00, showed 0.2 BTC each ten minutes later. The chain is a photograph of a crowd that keeps moving. A single snapshot tells you the price. Only a few of them tell you whether you could have traded your size at it.
How did the three calls settle?
On 25 September BTC settled at $83,932, the 30-minute average of the index before 08:00. That was 5.3% above the index on the morning we sold and $1,068 below the 85,000 strike. All three calls expired worthless, so each stack kept its premium less the trading fee: 1.97M sats for the 85,000 call, 1.22M for the 88,000 call and 0.42M for the 94,000 call. The closest of them finished 1.3% short of paying anything back.
One good month says little about a strategy. The question a holder should ask is what the same choice does month after month, including the months nobody would pick as an example.
Every monthly cycle of 2026, won or lost
The rule behind the three calls is simple enough to run on every month in our archive. On the morning of each monthly settlement, sell the next monthly call nearest 0.30 delta at the best bid, hold it to settlement and count the result in sats after fees. We wrote the rule down before looking at any of the outcomes. Our archive of Deribit quotes allows eight such cycles, from 30 January to 25 September.
The call grew the stack in five of the six cycles to the end of July and by then had added 7.25M sats, more than 7% of a coin. Over the same stretch BTC fell from $82,510 on the first entry morning to $63,862 on 31 July. A holder counting in sats lost nothing to that fall and collected the premium every month.
Then one cycle took it all back. From 31 July to 28 August BTC rose 24.8%, from $63,862 to $79,681. It ran through the 67,000 strike the rule had sold that month. That single cycle cost 14.21M sats. The year ended 4.99M sats behind simply holding the coin, even though the call won six cycles out of eight. That is the outcome a podcast debate on the strategy expects over time: less than holding, in exchange for a steadier income. The calls nearer 0.20 and 0.10 delta fared worse still, ending 5.57M and 6.18M sats behind. A further strike made each bet smaller, yet the August rally reached those strikes too.
This is the shape of a covered call. The seller trades away the right tail of the coin's returns for a steady premium. In sats a falling month costs the holder nothing and pays the premium. Only a rally can hurt. One large enough can outweigh many months of income. Even a channel that teaches the strategy warns that the position underneath a covered call is not stable, so its income is not the monthly paycheck it is often sold as. The practical question is whether the income can be kept without leaving the stack open to that one month.
How to cap the rally loss?
The simplest protection is a second call, bought further out on the same expiry. The holder sells one call and buys a cheaper one above it. Up to the higher strike the pair behaves like the covered call. Beyond it the two payouts cancel. On 28 August that meant selling the first candidate of this note and buying the third: the 85,000 call at its 0.0200 bid and the 94,000 call at its 0.0055 ask, a net premium of 1.45M sats before fees.
For one BTC covered, the change in the stack becomes
where is the premium received for the call sold at strike , is the premium paid for the call bought at strike and is the settlement price. The loss is largest when BTC settles exactly at the higher strike. Above it the two payouts offset, so the worst case is known on the day of the trade:
For the September pair that floor was a loss of 8.12M sats before fees, whatever BTC did. The plain 85,000 call had no floor at all. The price of the floor is the premium of the call bought, which across the eight cycles took between 0.38% and 0.65% of a coin each month.
Run through 2026 on the same months, buying the call nearest 0.10 delta at the ask every time, the capped version finished the eight cycles 0.19M sats ahead, against 4.99M behind for the plain call:
| Settled (BTC over the cycle) | Sold / bought | Plain | Capped |
|---|---|---|---|
| 27 Feb (−18.1%) | 88,000 / 96,000 | +1.92 | +1.34 |
| 27 Mar (+1.4%) | 74,000 / 82,000 | +1.82 | +1.24 |
| 24 Apr (+13.5%) | 74,000 / 82,000 | −2.40 | −3.08 |
| 29 May (−5.6%) | 83,000 / 92,000 | +2.22 | +1.70 |
| 26 Jun (−17.6%) | 78,000 / 84,000 | +1.47 | +1.06 |
| 31 Jul (+5.7%) | 65,000 / 71,000 | +2.22 | +1.54 |
| 28 Aug (+24.8%) | 67,000 / 72,000 | −14.21 | −5.01 |
| 25 Sep (+5.3%) | 85,000 / 94,000 | +1.97 | +1.39 |
| Eight cycles | −4.99 | +0.19 |
Both versions sell the same call in every cycle. The second column gives the strikes sold and bought. The last two give the change in a one-coin stack in millions of sats, after fees on both legs.
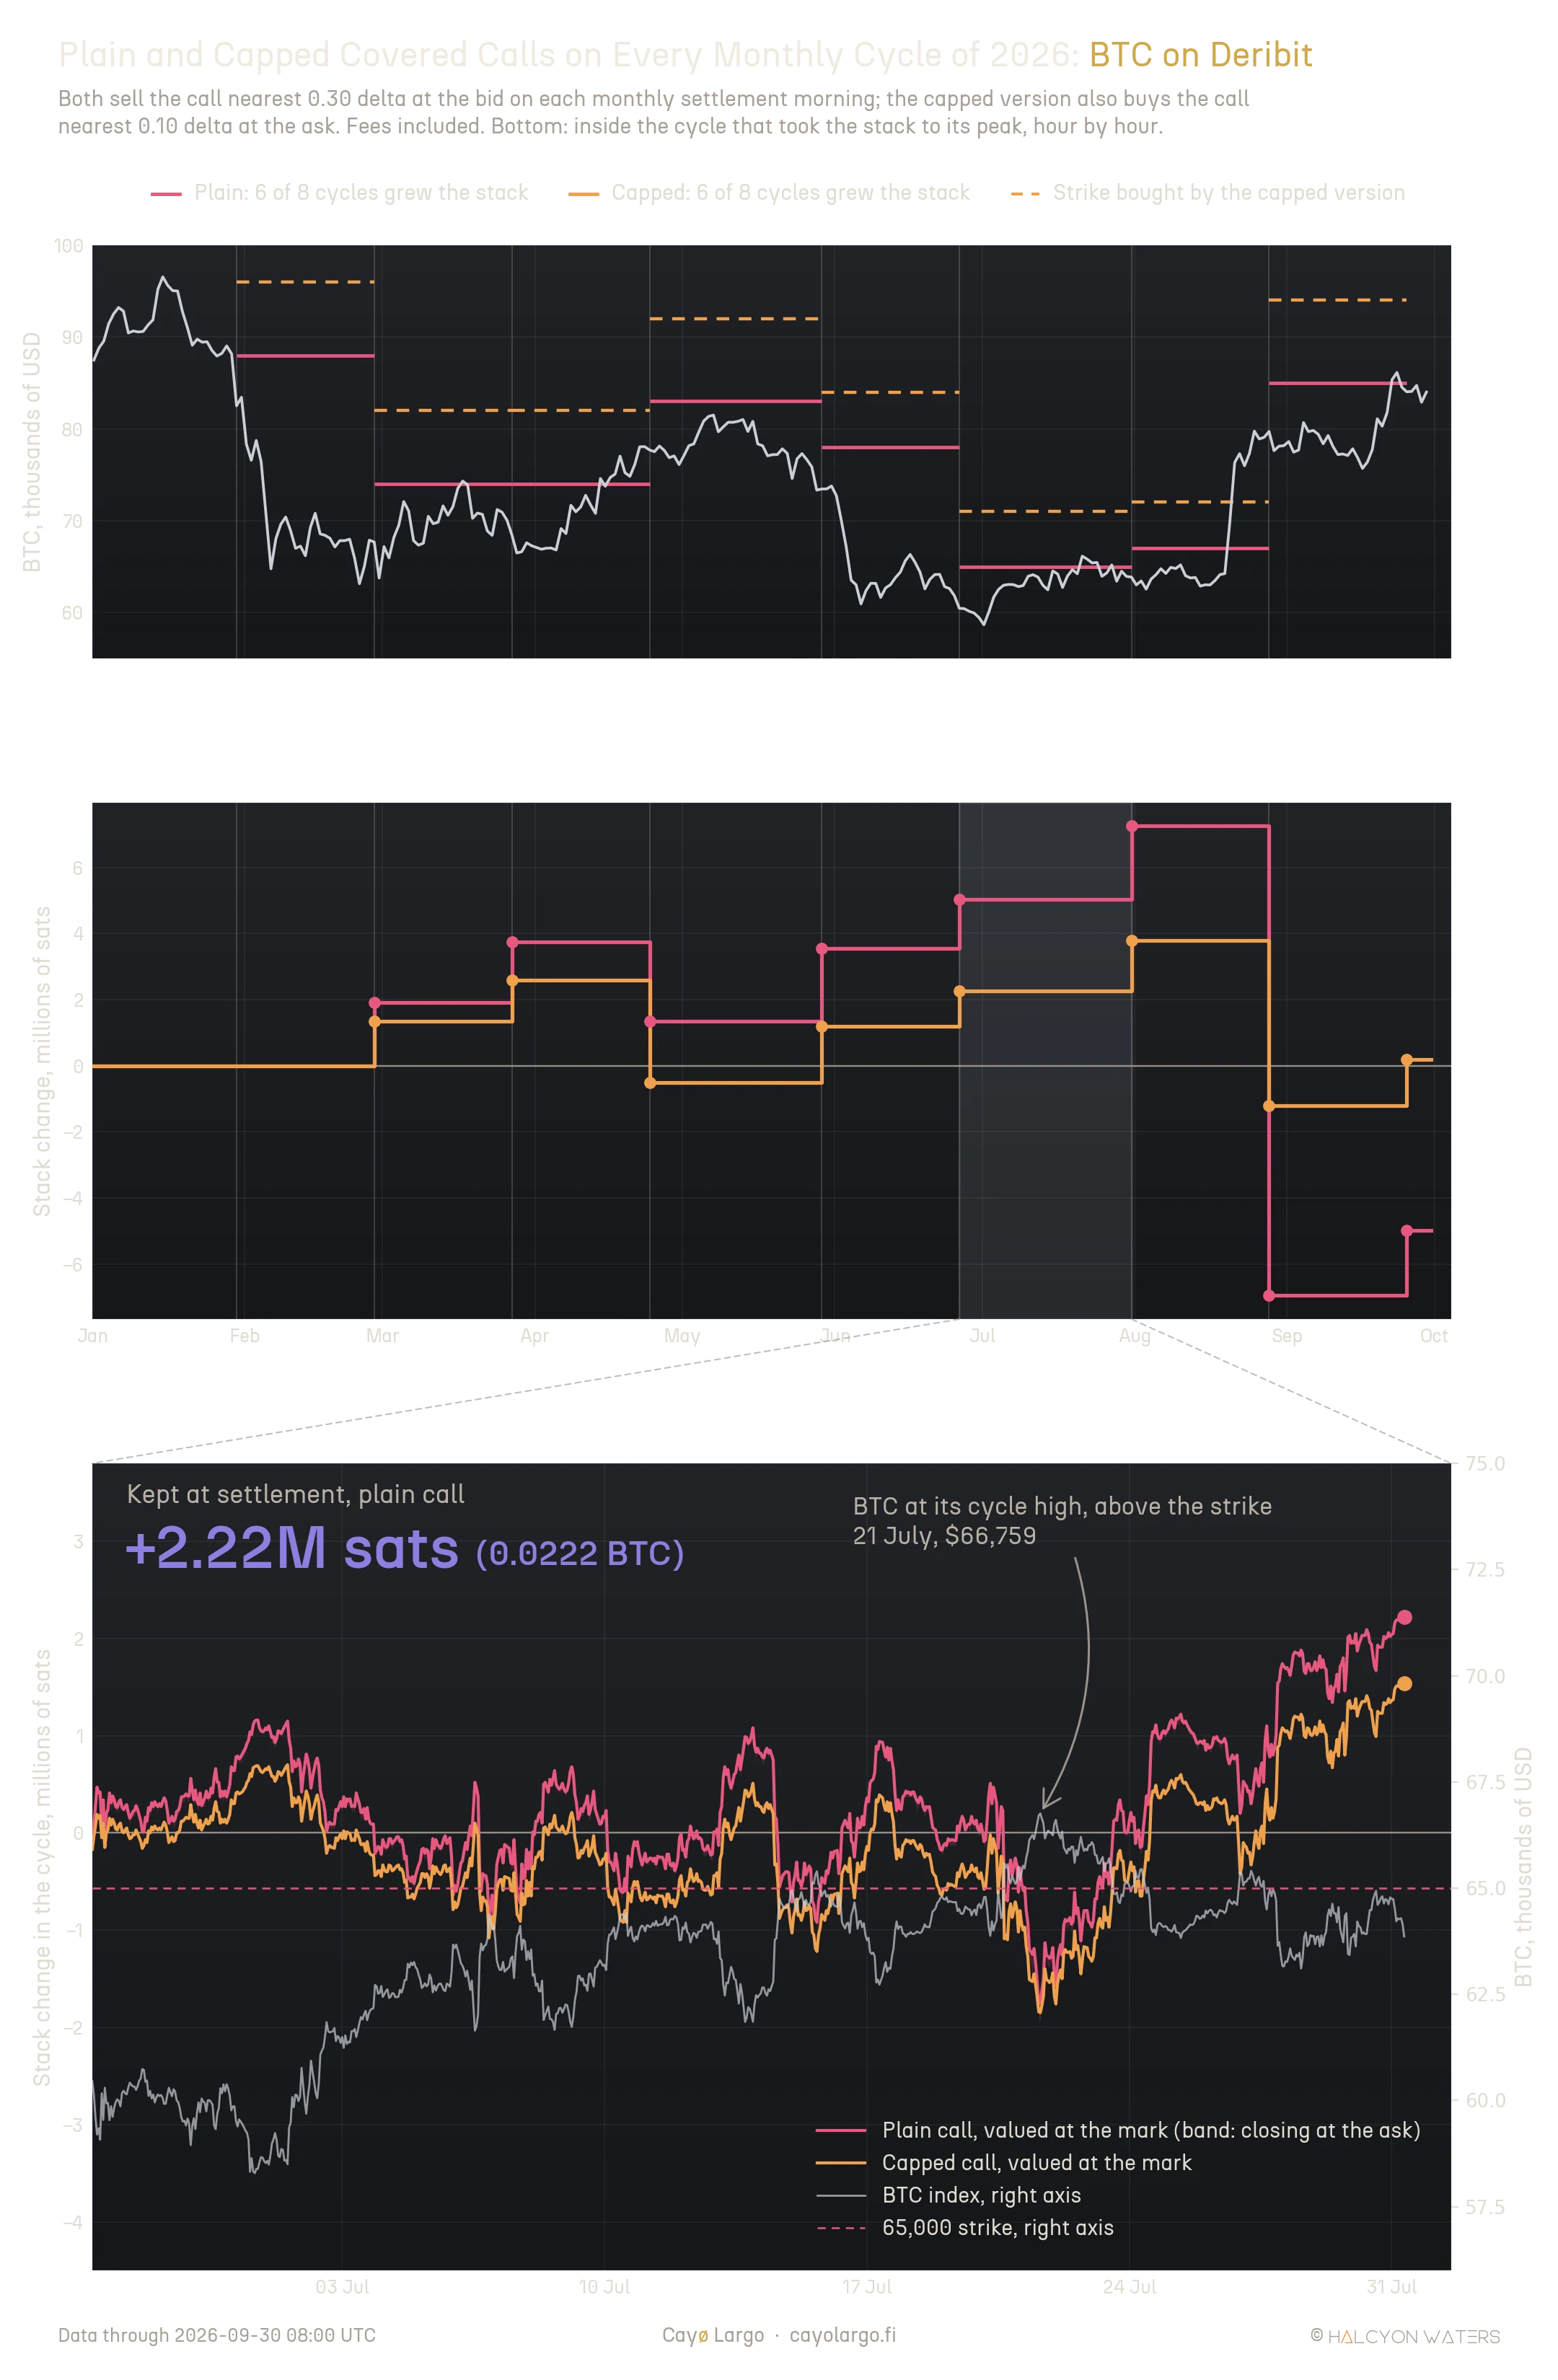
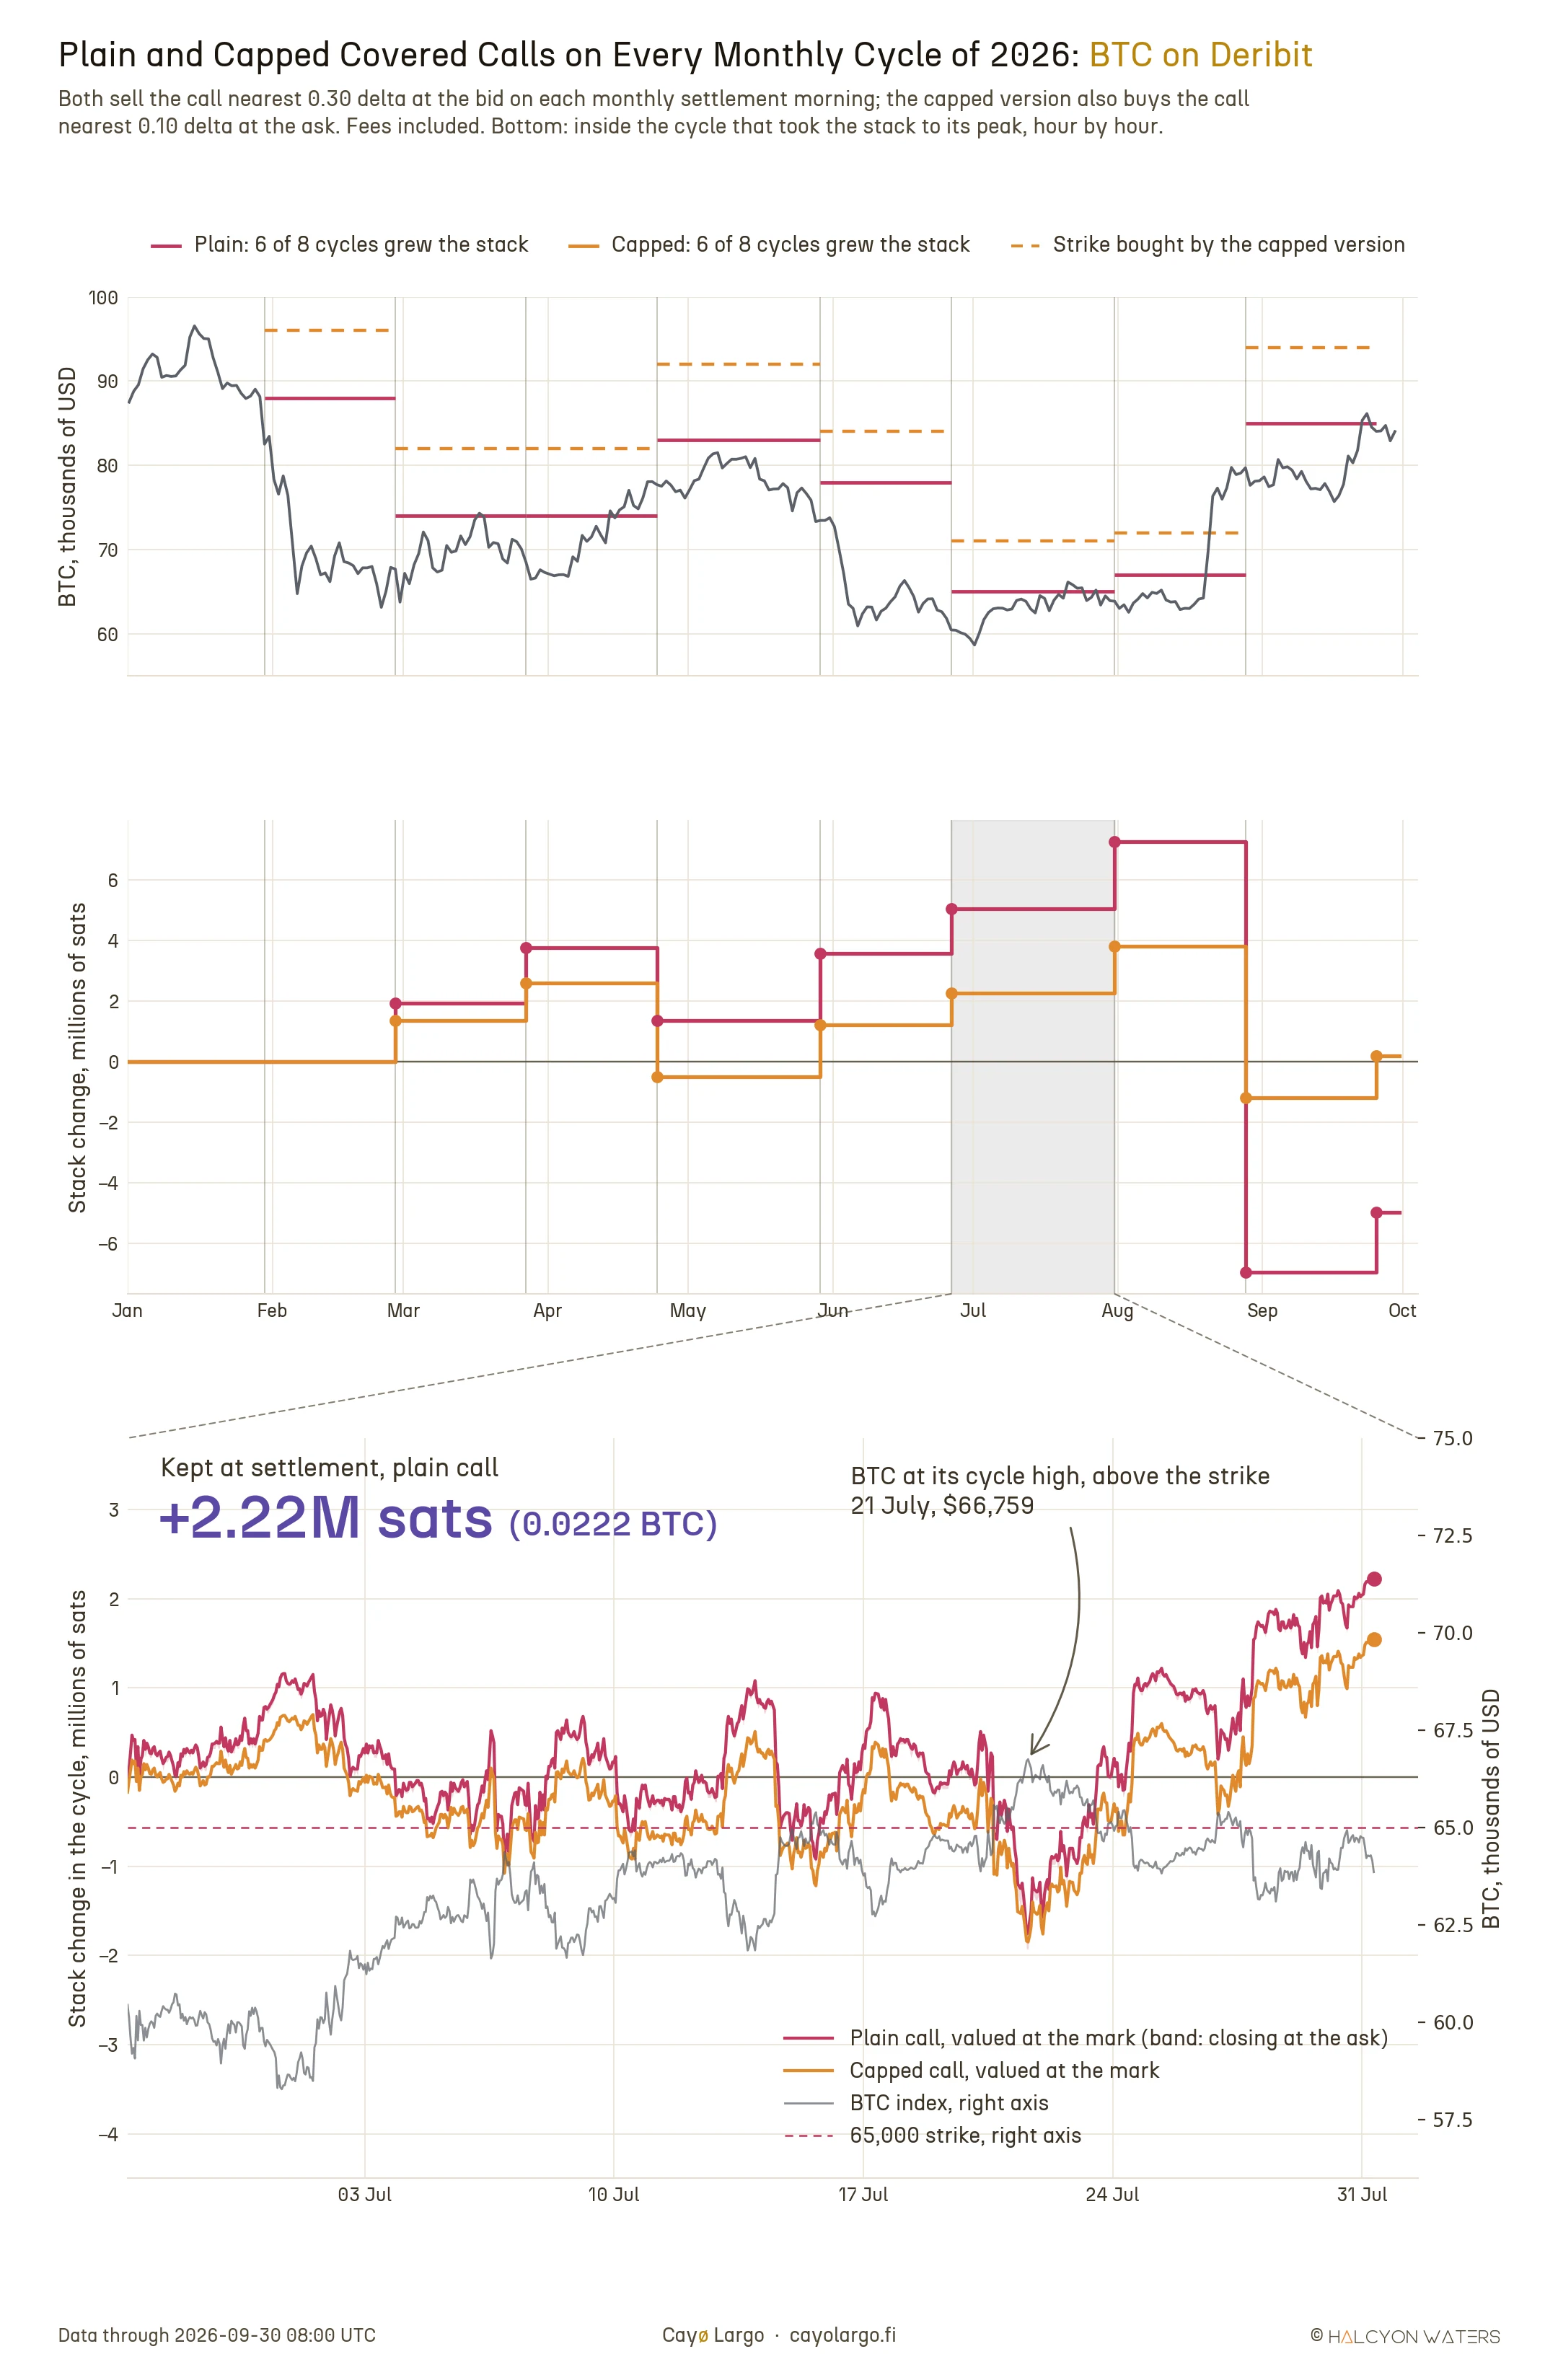
Figure 4: The plain and the capped covered call on every monthly cycle of 2026. Top: the BTC index with the strike each cycle sold and, dashed, the strike the capped version bought. Middle: the running change in a one-coin stack, stepping at each settlement. Bottom: inside the cycle that took both to their peak, 26 June to 31 July, valued hour by hour at Deribit's mark, with BTC and the 65,000 strike against the right-hand axis.
The cap cut the August loss from 14.21M to 5.01M sats. In every other month it earned less than the plain call. Part of each premium went on the call bought. In April it cost a little more, 3.08M against 2.40M, because the rally stopped between the two strikes. That is the trade the cap makes: a smaller premium every month in exchange for a year that one rally cannot decide. Over eight cycles it left the stack roughly where it started, slightly ahead.
The bottom panel of Figure 4 opens the cycle that took both books to their peak, from 26 June to 31 July. It values the position hour by hour at Deribit's mark. It shows what the monthly steps hide. BTC spent 105 hours above the 65,000 strike between 15 and 27 July. At its deepest, on 21 July, the plain call showed a paper loss of 1.76M sats. Closing it then at the ask would have locked in 1.93M. Two days later the position was back above zero. At settlement BTC stood at $63,912, the call expired worthless and the full 2.22M sats came home. Over the cycle the position sat below zero for just over a third of its hours. A covered call is paid for sitting through those hours. A seller who reacts to each of them gives the premium back.
What we did not test?
As usual, our research is not free of assumptions and limits. A few of them matter here. The teaching sections read one snapshot at one minute on one day, so every figure from the chain describes 28 August 2026 at 08:00 UTC. We quote Deribit's mark, delta and implied volatility as the exchange published them, without recomputing them. The yields in those sections leave out fees, while every 2026 result includes the trading and delivery fees from Deribit's schedule, charged on both legs of the capped call.
We compute each settlement ourselves as the 30-minute average of the BTC index before 08:00, which follows Deribit's definition but is not its published delivery price. The rules sell at the best bid and buy at the best ask whatever size rests there. On 28 August the bid at 88,000 was only 0.1 BTC, so a real account would not always have filled a whole coin at the prices above. We chose to test the cap after the plain call's August loss was known. It is the textbook protection rather than a rule fitted to that month, yet only the cycles still to come can test it independently. Above all, eight monthly cycles from a single year is a small sample. A year decided by one month is exactly the case where a longer record could read differently.
Where does the series go next?
The plain call won six months in eight, then one month took it all back. The cap held. Part 2 goes inside that month. It reads the option chain on 31 July, the morning the August calls were sold. It tests whether the adjustments covered-call teachers recommend would have saved it. It also asks whether any of this depends on the day of the week the call is sold or on the coin, with ETH as the second case. From October the capped rule runs forward, one cycle at a time. Each result is published whether it grows the stack or not.
References
- Jake Broe (2021). How to Sell Covered Calls: Options Trading Explained. YouTube, 9 March 2021. Uses delta as a rough probability of finishing in the money and recommends selling covered calls near 30 delta.
- projectoption (2026). Covered Call Options: Beginner to Master in 1 Hour. YouTube, 26 July 2026. Compares annualized yields across expiries and shows the shorter cycle yielding more per year on the same strike.
- Deribit (2025). USDC Settled BTC & ETH Options Launch. Deribit Insights, 15 August 2025. Distinguishes linear from inverse options and describes the inverse contracts as suited to holders who keep their funds in the coin.
- Deribit (2026). Change To Inverse Option Delivery Process. Deribit Insights, 24 June 2026. Sets out the BTC payout formula for an in-the-money inverse call, the 30-minute index average used at settlement and the settlement into futures from 1 August 2026.
- Alexander, C., Chen, D. and Imeraj, A. (2023). Crypto quanto and inverse options. Mathematical Finance, 33(4), 1005 to 1043. Circulated as a working paper under the title Inverse Options in a Black-Scholes World (2021). Shows that Deribit has always carried more than 90% of exchange trading in crypto options and lists only inverse products. Compares their pricing and hedging with direct options.
- projectoption (2026). Do Covered Calls Really Generate Consistent Monthly Income? YouTube, 23 April 2026. Argues that the stock underneath a covered call is not stable, so its income is not the steady paycheck it is often presented as.
- Roman Paolucci, Quant Guild (2026). How to Trade the Covered Call. YouTube, 28 April 2026. Derives the covered call from option theory and describes selling 20 to 30 delta calls systematically across many underlyings.
- SMB Capital (2021). The Right Way to Trade Covered Calls For Income. YouTube, 9 December 2021. Argues for selling covered calls at a price target rather than at whatever strike meets an income goal.
- The Iced Coffee Hour Clips (2026). Can Covered Calls REALLY Beat the Market? YouTube, 25 June 2026. A debate on weekly covered calls in which a host expects them to return less than holding over time, with a steadier income.
Disclaimer
This article is published by Halcyon Waters sp. z o.o. (Cayo Largo) for general information and educational purposes only. It is a study of an options strategy on historical data. It is not investment advice, not a personal recommendation, not an offer or solicitation to buy or sell any financial instrument, and not an inducement to enter into any transaction.
Cayo Largo is a data and analytics provider. It is not a broker, an investment adviser, or a portfolio manager. It does not execute trades or hold client funds, and nothing here is tailored to the circumstances, objectives, or risk tolerance of any reader. You are solely responsible for your own decisions and should seek independent professional advice before trading.
Options and other derivatives are high-risk instruments. They can move sharply, can expire worthless, and can lose more than the amount committed. You can lose your entire investment.
Any performance shown is hypothetical and backtested. It is calculated with the benefit of hindsight over past data and does not represent actual trading. Fees, funding, slippage and liquidity are modelled only as far as the article states, and the ability to enter or exit at the prices shown is not guaranteed. Hypothetical results have inherent limitations and frequently differ from results actually achieved. Past performance is not indicative of future results.
Market data, including data sourced from Deribit, is believed to be reliable but is not guaranteed to be accurate or complete. Cayo Largo accepts no liability for any loss arising from the use of this material.
Frequently Asked Questions
How does a covered call work on Deribit Bitcoin options?
You hold BTC and sell a call on it. Deribit's inverse options pay the premium in BTC at the sale. At expiry the call settles on a 30-minute time-weighted average of the index: below the strike it expires worthless and you keep the whole premium, above it you pay (index minus strike) divided by the index, in BTC, out of the stack. Nothing is delivered and there is no early assignment.
Which strike should I sell for a Bitcoin covered call?
There is no single right strike, only a trade-off. A strike closer to spot pays more premium and stops paying sooner as BTC rises. A strike further away pays less and leaves more room. Delta is a convenient way to compare them: many practitioners start near 0.30, which on 28 August 2026 was the 85,000 call on the September quarterly.
Why is the bid lower than the mark price on Deribit?
The mark is Deribit's own estimate of fair value, used for margin and for profit and loss. It is not a price anyone has offered. A seller receives the best bid, which sits below the mark by an amount that grows as strikes move further out of the money. On 28 August 2026 it ranged from under 3% near the money to 15% at the 100,000 call.
Does a Bitcoin covered call beat simply holding the coin?
The plain covered call did not in 2026. Selling the next monthly call near 0.30, 0.20 or 0.10 delta on each settlement morning grew the stack in six or seven of eight cycles, yet every version ended between 4.99M and 6.18M sats behind holding one coin. A capped version, which also bought the call nearest 0.10 delta, finished 0.19M sats ahead because it limited the loss in the one month BTC rallied 24.8%.
What is a capped covered call?
A covered call with a second, cheaper call bought further out on the same expiry. The holder keeps the difference between the two premiums and the covered-call payoff up to the higher strike. Above it the two calls offset, so the largest possible loss is fixed on the day of the trade: the gap between the strikes as a share of the higher strike, less the net premium.
Related Articles
Why Knowing Your Greeks Won't Save You on Deribit
You learned Delta, Gamma, Theta. You can explain Black-Scholes over coffee. Then you open Deribit's options page and none of it helps. Here's why options theory breaks down on a live screen.
Crypto Variance Risk Premium: Live IV vs RV on Six Coins
How to read IV vs RV charts and the variance risk premium to figure out whether crypto options are overpriced, underpriced, or fairly valued. Live AVAX example from Deribit.